
Research article · 2022 · Full text
International Journal of Horticulture and Food ScienceEffect of blended NPS fertilizer on food barley varieties in Gurawa district Ethiopia
Volume 4(2) · Pages 47–54 · DOI: 10.33545/26631067.2022.v4.i2a.106 ↗
Research areasCrop Yield and Soil FertilityAgricultural Productivity and Crop ImprovementPlant Micronutrient Interactions and Effects
Abstract
Author-writtenFood barley is one of the major staple crops in Ethiopia. In Gurawa district, the productivity of food barley is low due to poor agronomic practice. Most of the farmers in these areas do not use fertilizer and few others use very much below the optimum rate and inappropriate NPS fertilizer applications rate are among the most important agronomic factors that hinders productivity of food barley around the study area. An experiment was conducted in the Gurawa district in 2020 main cropping season to examine the responses of different NPS fertilizer rates on yield and yield components of food barley. Five different NPS fertilizer rates (0,50, 100, 150 and 200 kg ha-1) and three barley varieties (EH1493, BH1307 and Cross#41/98) a total of 15 treatment combinations were laid out in randomized complete block design with three replications. Phenological, growth, yield and yield related data were collected and analyzed using gestate software. The results of this study indicated that the main effect of different varieties and application of different NPS fertilizer rates showed highly significant effect on yield and yield components of food barley. However, the interaction effects of varieties and NPS rates did not significantly affect grain yield and yield components of food barley. The application of 200 kg ha-1 NPS fertilizer rate was gave the highest grain yield (4592 kg ha-1) compared with the other rates of NPS fertilizer application. The results of the partial budget analysis indicated that the application of 200 kg ha-1 of NPS fertilizer rate resulted in maximum marginal rate of return (1042.47%) and are economically profitable with a net benefit of 134798 birr ha-1 compared to other treatments. Thus it can be concluded that application of 200 kg NPS ha-1 was found to be profitable both agronomical and economical and can be recommended around the Gurawa area.
Summary
Source-checkedPlain-language reading of the full paper, prepared with AI and checked against the text. Each point links to the authors' own words.
Why it matters
- Food barley is a primary staple crop in Ethiopia. View evidence ↗
- Barley productivity in the Gurawa district is low because farmers either do not use fertilizer or apply it at rates far below the optimum. View evidence ↗
- Cereal production can be limited by sulfur deficiency, leading the Ethiopian Ministry of Agriculture to introduce a blended NPS fertilizer (19% N, 38% P2O5, and 7% S). View evidence ↗
The question
- The study aimed to evaluate how different NPS fertilizer rates affect the yield and yield-related traits of various barley varieties and to determine the economic cost-benefit of these rates. View evidence ↗
What they did
- The field experiment took place during the 2020 main cropping season at the Haramaya University experimental site in the Gurawa district of Ethiopia. View evidence ↗
- The study used a factorial design with 15 treatments: five NPS fertilizer rates (0, 50, 100, 150, and 200 kg ha-1) and three barley varieties (EH1493, HB1307, and Cross 41/98), with 100 kg ha-1 of Urea applied to all plots. View evidence ↗
- The experimental layout followed a randomized complete block design (RCBD) with three replications. View evidence ↗
- Data were analyzed using ANOVA via Genstat software, and treatment means were compared using the least significant difference (LSD) test at a 0.05 probability level. View evidence ↗
What they found
- The highest grain yield of 4.592 t ha-1 was achieved with the 200 kg ha-1 NPS rate, while the lowest yield of 2.625 t ha-1 occurred in the unfertilized control plots. View evidence ↗
- Spike length increased with fertilizer application, reaching a maximum of 12.17 cm at 200 kg ha-1 NPS compared to 9.4 cm in the control. View evidence ↗
- Among the varieties, EH1493 produced the tallest plants (106.79 cm), while Cross #41/98 produced the shortest (86.70 cm). View evidence ↗
- Aboveground biomass was highest at the 200 kg ha-1 NPS rate (12,337 kg ha-1) and lowest in the control plots (7,132 kg ha-1). View evidence ↗
- Straw yield peaked at 7.745 t ha-1 with 200 kg ha-1 NPS and was lowest at 4.507 t ha-1 in unfertilized plots. View evidence ↗
- The application of 200 kg ha-1 blended NPS (combined with 46 kg N ha-1) yielded the highest net benefit of 134,798 Birr ha-1 and a marginal rate of return of 1042.47%. View evidence ↗
- The harvest index was highest at the 200 kg ha-1 NPS rate (44.92) and lowest in the control plots. View evidence ↗
What it means
- The authors conclude that applying 200 kg ha-1 of NPS fertilizer is both agronomically and economically profitable and recommend its use in the Gurawa area. View evidence ↗
- The authors note that because the results are based on a single location and season, further studies across more locations and seasons are needed to refine the recommendations for the Gurawa district. View evidence ↗
Visual summary
3 visualsIllustrations explain the paper; charts are replotted from the paper's own table values.
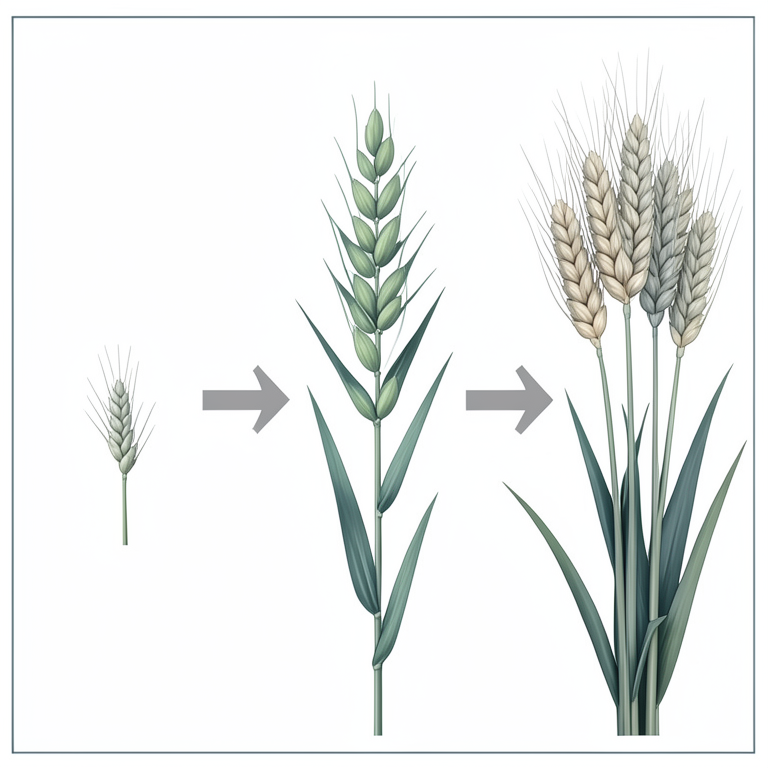
Impact of NPS Rates on Barley Yield and Profit
AI-generated conceptual illustration (food barley plants). It explains the idea and does not show study data.
View source evidence ↗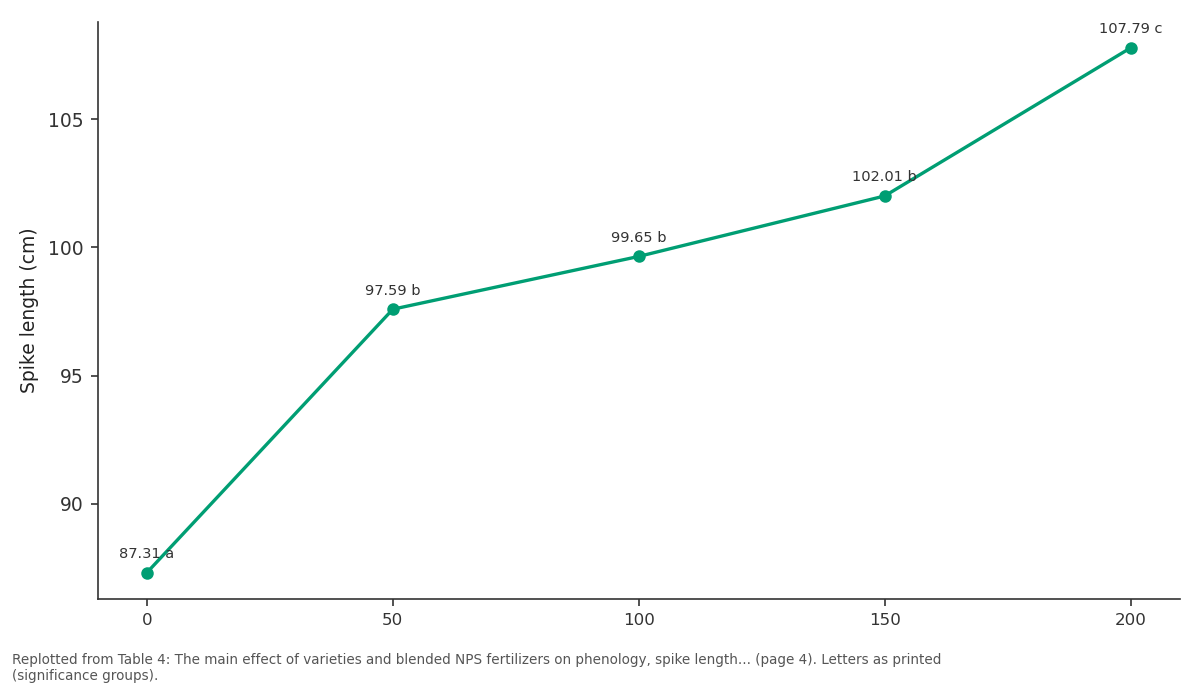
Plant height (cm): 0 vs 50 vs 100 vs 150 vs 200
Replotted from Table 4 (page 4) of the original paper. Every bar is the paper's own table value.
View source evidence ↗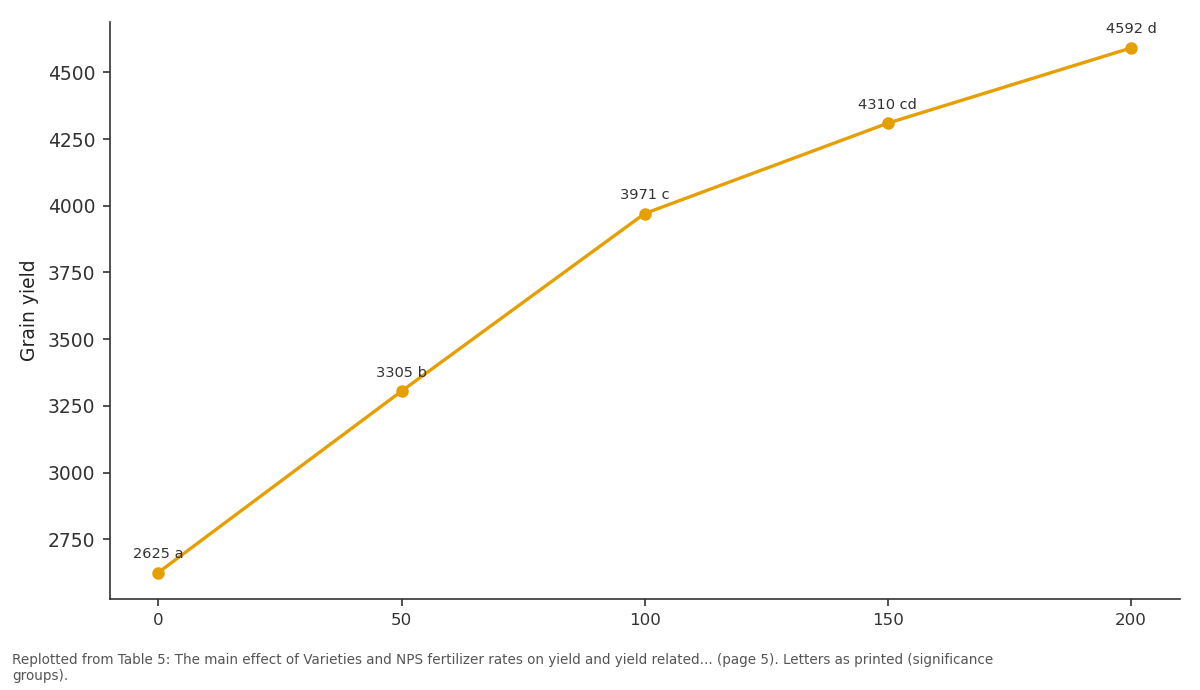
Grain / yield: 0 vs 50 vs 100 vs 150 vs 200
Replotted from Table 5 (page 5) of the original paper. Every bar is the paper's own table value.
View source evidence ↗Figures & tables
From the original paper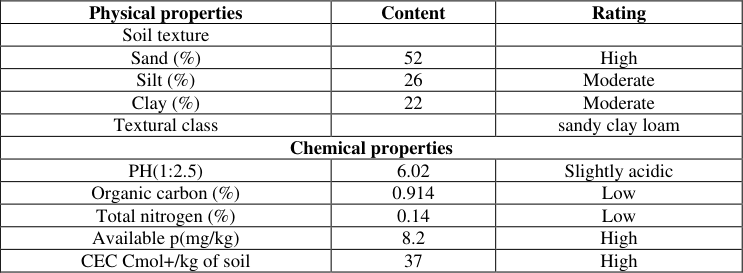 Table 3
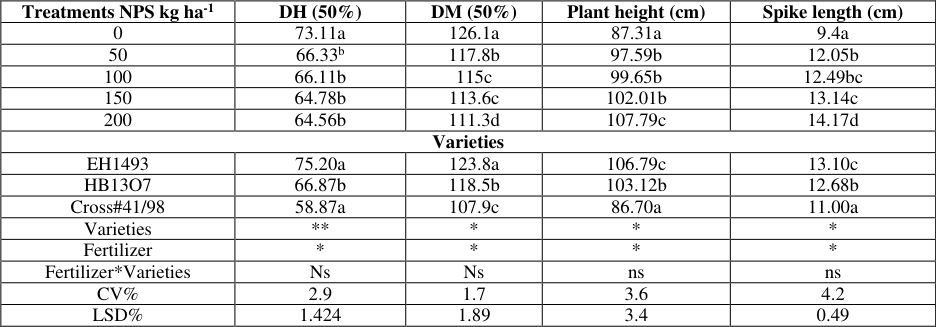 Table 4
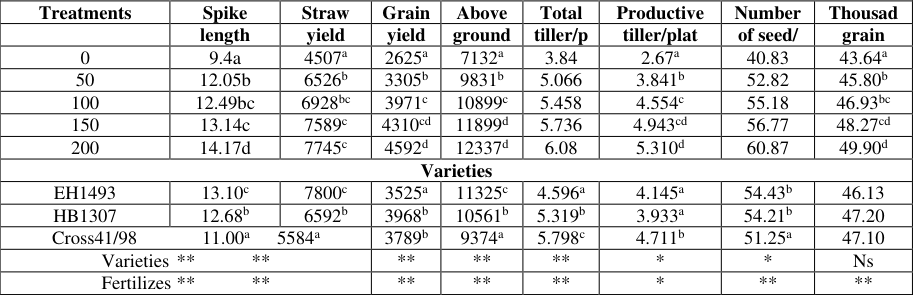 Table 5
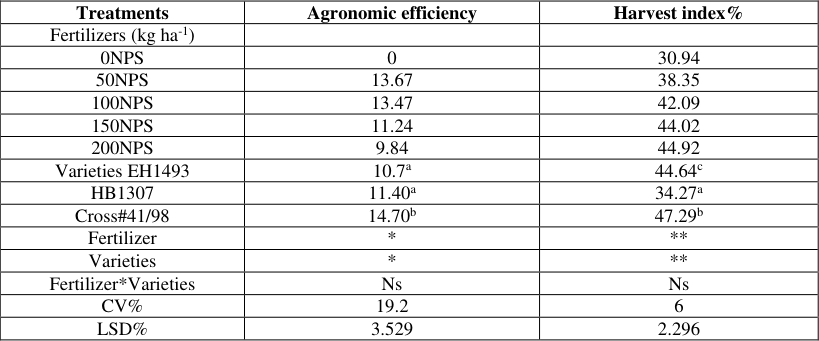 Table 6
 Table 7
Introduction
Barley (Hordeum vulgare L.) is an important grain crop in Ethiopia and has diverse ecologies being grown from1800 to 3400m altitude in different seasons (Muluken, 2013) [39] and makes Ethiopia being the second-largest producer in Africa, next to Morocco, accounting for about 25% of the total barley production in the continent (FAO, 2014) [16] According to the 2014/2015 forecasts from Ethiopia's Central Statistics Authority, of the 12.6 million hectares under cultivation of the grain crops, 80.78% was under cereals which contributed 87.36% of the grain production and barley took up about 8 and 7 percent of the grain crop area, and production respectively (CSA,2014/2015) [11] . In Ethiopia barley is ranked fifth of all cereals, based on the area of production, but third based on yield per unit area. It covers 7.56% of the land under grain crop cultivation with a yield of 1.96t ha -1 (CSA, 2016) [12] . Whereas the potential yield goes up to 6 t/ha on experimental plots (Habtamu et al, 2014) [19] indicating a productivity gap of about 4 tons per ha. Filling this gap would make Ethiopia among the major barley producing countries. Food barley is a fourth important crop in eastern Hararge followed by maize, sorghum and wheat in terms of the number of households (101,994) producing and fifth important crop in terms of area coverage (6,431.46 ha) followed by sorghum, maize, wheat and teff. However, the productivity of food barley in eastern Hararge is low 20.29 quintal/ha compared to the regional average of Oromia 21.73 quintal/ha (CSA, 2013/14). So far, no efforts have been made in promoting newly released food barley in eastern Hararge even though there is great potential in the highlands of the zone. There are several factors that reduce yield of barley in Ethiopia. They are poor soil fertility, water logging, drought, frost, soil acidity, diseases and insects, and weed competition (ICARDA, 2008) [20] . Among these, the most important constraints that threaten barley production in Ethiopia are poor soil fertility and low pH.
Since the major barley producing areas of the country are mainly located in the highlands, severe soil erosion and lack of appropriate soil conservation practices in the past have resulted in soils with low fertility and pH which leads to reduce barley production in Ethiopia. Consequently, the addition of nutrients like N, P and S to low fertile soil is important to increase barely yield and yield components. A balanced supply of essential nutrients needs for the growth of crops and optimal productivity. Lack of supply of mineral elements may limit plant growth and development (Nadian et al., 2010) [26] . Improved varieties (high yield, disease resistant, drought-resistant), good cultural practices like balanced fertilization and other management are very important for higher productivity of barely. Variety based fertilizer and soil fertility status recommendations are unusual in Ethiopia. Barely is very sensitive to insufficient nitrogen and very responsive to nitrogen, however, nitrogen is commonly the most limiting nutrient for crop production in the major agricultural areas and therefore adoption of good N management strategies often results in large economic benefits to farmers. Among the plant nutrients, it plays a very important role in crop productivity (Oikeh et al., 2007; Worku et al., 2007) [27,35] . Adequate phosphorus nutrition enhances many aspects of plant physiology, including the fundamental processes of photosynthesis, root growth particularly the development of lateral roots and fibrous rootlets (Brady and Weil, 2002) [8] . Balanced fertilization is the key to sustainable crop production and maintenance of soil health. For the last four to five decades, Ethiopian agriculture depended on imported fertilizer products; only urea and Di-ammonium phosphate (DAP), as sources of N and P, respectively. However, currently, it is generally recognized that the production of cereal crops can be limited by the deficiency of S and other nutrients (Assefa et al., 2015) [4] . The investment in inorganic fertilizer for crop production must be profitable to a farmer to justify its continuous use. Furthermore, a blanket recommendation often leads up to some nutrients being wasted like S. Although there are few studies on the economic benefits of fertilizer use in SSA, the results shows positive returns on inorganic fertilizer investments when either applied solely or in combination with organic amendments. (Vanlauwe et al., 2011) [32] . According to agricultural transformation agency (ATA) (2017), the blanket recommendation fertilizer for the barley was 100 and 150 kg ha -1 DAP and Urea respectively in the Arsi zone. However, the national recommendation of Urea and DAP (Di-ammonium Phosphate) were100 kg ha -1 , which farmers in most parts of Ethiopia including eastern Ethiopia are using without considering the differences of soil types and fertility status (MOA, 2013). This fertilizer only contains nitrogen and phosphorus that may not sufficient for the nutrient requirements of crops, which reduces yield and yield components of barley in Ethiopia. In order to solve these problems, the Ministry of Agriculture of Ethiopia has been currently introduced a new inorganic fertilizer (NPS) containing nitrogen, phosphorus and sulphur with a ratio of 19% N, 38% P 2 O 5 and 7% S as the main source of phosphorous (MoANR, 2013). Only 30 to 40% of Ethiopian smallholder farmers use fertilizer, and those that do only apply 37 to 40 kg on average per hectare, which is below the recommended rates (MoA, 2012). Gurawa where this study was conducted is one of barley producing area in east Hararge zone of eastern Oromia, Ethiopia. The production of barley in the area under main cropping season is well known; since there is a high demand grain for food, sell and straw for animal feeds. Barley yield is low in Eastern Hararge and Gurawa districts because most of the farmers in these areas do not use fertilizer and few others use very much below the optimum rate (Gurawa agriculture and natural resource office, 2019). Therefore, in the area there is a need to study the effect of different NPS rates on the yield and yield components of barley to achieve maximum yield. The objective of this study was to assess the effect of NPS fertilizer rates on yield and yield-related traits of barley varieties and to estimate the cost-benefit of NPS fertilizer rates for barley production.
Materials and Methods
Materials and Methods
Description of the Study Areas
Field experiment was conducted at experimental site of Haramaya University in Gurawa district in East Hararge zone of Oromia regional State, Ethiopia, during 2020 main cropping season. The altitude of this district ranges from 500 to 2425 meters above sea level and the latitude 09 0 08'12.8" N and longitude 41 o 51'09.3" E. The rainfall pattern is bimodal, the first rains (Belg) fall starting from March/April to May and the main rain season extends from June to September/October with an average annual rainfall of 725 mm.
Design, Treatments and Procedures
The experiment consisted of 15 treatments, five NPS fertilizer rates (0, 50, 100, 150 and 200 kg ha -1 and three barley varieties (EH1493, HB1307 and Cross 41/98), besides 100 kg ha -1 of Urea was applied uniformly to all plots. The experiment was arranged in factorial combination of randomized complete block design (RCBD) with three replications and consisted of five fertilizer rates: (T1) NPS (0 kg h -1 ) used as a control, (T2) NPS (50 kg h -1 ), (T3) NPS (100 kg h -1 ), (T4) NPS (150 kg h -1 ), (T5) NPS (200 kg h -1 ) and three food barley varieties (EH1493, HB1307 and Cross41/98). The total treatment were combined of 5 x 3 = 15. Gross plots size was 2m x 2m = 4m 2 ) and the distance between plots and blocks were 0.5 m and 1m apart, respectively. Each plot consisted of 10 rows and the spacing between barley plant rows was 20 cm apart. The land of experimental field was ploughed three times and prepared very well before time of sowing and by using tractor and ploughing. The first was tilled by tractor, the second was tilled by oxen and the third was plowed and leveled manually. The layout of experimental field was made and the plots were leveled across a gradient slop of land and the full rate of NPS was drilled based on the treatments in the rows and incorporated with the soil at sowing the seed. The rows were made across each plot and treatments were assigned randomly to distribute the experimental plots in the blocks, seed was drilled by hand at the seed rate of 125 kg h -1 (50 gm plot -1 ). The urea was applied in two splits application after planting (50% was applied at 45 days after emergence and half was top dressed at the tillering stage).
Soil Sampling and Analysis
Before planting 12 soil samples were collected from 0-30 cm depth in zigzag way from the experimental field and composited as one soil sample and were taken to the soil laboratory and the samples were air-dried, grind and sieved through a 2mm sieve tube and analyzed for selected soil parameters such as, soil PH, cation exchange (CEC), organic carbon, total N, available P, S and soil texture at Haramaya university Agricultural research laboratory Soil texture was determined using the Bouyoucos hydrometer method (Bouyoucos, 1962) [7] . The pH of the soil was measured in the supernatant suspension of a 1: 2.5 soil to water ratio using a pH meter by potentiometer method (Rhoades, 1982) [40] . Organic carbon was determined by Walkley and Black oxidation method (Walkley and Black, 1934) [41] . Cation exchange capacity and Exchangeable K was measured after saturating the soil with 1N ammonium acetate (NH4OAC) and displacing it with 1N NaOAC (Van Reeuwijk, 1993) [42] . Available phosphorus was determined using the Olsen method (Olsen et al., 1954) [43] . Available S was determined by KH2PO4 extractant (Johnson and Fixen, 1990) [44] . Available B was determined using hot water method (Sippola and Ervio, 1977) [45] .
Data collection
Crop phenology: days to 50% heading, days to 90% physiological maturity Growth and yield parameter: plant height (cm), spike length (cm),number of productive tillers, total number of tillers, number of seed per spike, thousand grain weights, grain yield, aboveground dry biomass yield, straw yield, harvest index
Data Analysis
The collected data were subjected to statistical analysis. Analysis of variance (ANOVA) was carried out using genstat software. The comparisons among treatment means were assessed using the least significant difference (LSD) test at 0.05 level of probability (Gomez and Gomez, 1984) [18] .
Results and Discussion
Results and Discussion
Chemical and Physical Properties of Soil before Sowing
The physical and chemical properties of the soil of the study area were conducted at the soil laboratory of Haramaya University main campus. The result of soil analysis in the laboratory was indicated that the soil texture of the experimental area was dominated by (sandy clay loam).The ratio of soil texture (proportion of sand, silt and clay, in the soil) of experimental field was 52%, 26% and 22% sand, silt and clay, respectively. The texture properties of the soil influence water holding capacity, water intake rates, aeration, root penetration and soil fertility. Crop Phenology and Plant Height Days to 50% heading and 90% physiological maturity Data analysis of variance showed that the main effect of varieties and NPS were highly significant (p<001) on plant height, 50% heading and 90% physiological maturity but their interaction did not significantly affect 50% of heading and 90% physiological maturity. The mean number of days required to 50% heading was between 58.87 and 75.20 days for the varieties (Table 3). The fastest day to heading was recorded for Cross41/98, while the longest day to heading was recorded for EH1493 (Table 3).
| Physical properties | Content | Rating |
|---|---|---|
| Soil texture | ||
| Sand (%) | 52 | High |
| Silt (%) | 26 | Moderate |
| Clay (%) | 22 | Moderate |
| Textural class | sandy clay loam | |
| Chemical properties | ||
| PH(1:2.5) | 6.02 | Slightly acidic |
| Organic carbon (%) | 0.914 | Low |
| Total nitrogen (%) | 0.14 | Low |
| Available p(mg/kg) | 8.2 | High |
| CEC Cmol+/kg of soil | 37 | High |
Table text extracted from the original PDF; superscript letters are shown inline. The original table image is below.
View original table image
The number of days required to 90% physiological maturity was between 107.9 and 123.8 days for the varieties (Table 3). The earliest day to maturity was recorded for Cross#41/98 and the longest days to maturity was recorded for EH1493. Similar to the days to 50% heading the interaction effect of fertilizer treatments and varieties (Table 3) did not show significant effect on days to physiological maturity. The significant difference among the varieties for these phonological traits might be due to their genetic inheritance variation. The maximum days of heading were observed with 0 NPS kg/ha while the minimum days of heading were observed with 200 NPS kg/ha, which might be due to the composition NPS contains p which was used in the plants cell by dray matter accumulation which facilitates plant growth and development, therefore it fastens the period of crop maturity. This finding was consistence with (Abebe, 2018; Lake and Bezabih, 2018) [1,22] . According to the current study the longest day to maturity was recorded from the control and the shortest days to maturity was observed from the plots which received highest NPS fertilizer rate (Table 3). As NPS fertilizer rate increased days to maturity was decreased, due to phosphorus plays a vital role in the development of the reproductive part of plants, seed formation, root growth and encouragement of early maturing of crops (Brady and Weil, 2002) [8] . This result was consistence with Chalachew (2019) [10] , who reported that days to maturity of food barley was shorter at higher rates of NPS application and Tagesse Abera et al. (2018) [50] reported that days to maturity of bread wheat was shorter at higher rates of NPS fertilizer application. Besides that the application of NPS fertilizer and compost at higher rates gave early maturity because of vigorous growth, early tasseling and silking of the crop, while plants at the lower nutrient application matured lately because of insufficient nutrients (Sisay and Adugnaw, 2020). This finding was also supported by Dagne (2016) [13] who describes early maturity days were recorded with the application of blended fertilizer whereas the longest days to maturity were recorded for control.
Plant height
Data analysis of variance showed that the main effect of varieties and NPS were highly significant (p<001) on plant height. The tallest plant height (106.79 cm) was obtained from the varieties EH1493 and shortest plant height (86.70 cm) was obtained from the varieties Cross #41/98 which might be due to genetic inheritance differences between varieties. This finding was consistence with (Abebe, 2018; Lake and Bezabih, 2018) [1,22] . The plant height was also increased with increasing blended NPS fertilizer application. The tallest plant height was recorded from the plots which received 200 kg h -1 while the shortest was observed from plots which received 0 kg h -1 . Besides the application of phosphorus slightly increases plant height. This result was supported by (Mesfin Kassa, et al., 2015) [24] , similar with (Tagesse Abera et al., 2018) [50] .
Spike length
The main effect of varieties and NPS had highly significant effect (p<0.001) on spike length. But the interaction of blended NPS and varieties did not significantly affect spike length. The longest spike length (12.17 cm) was obtained from the plots which received 200 NPS kg h -1 then, the shortest (9.4) was recorded from 0 NPS kg h -1 nitrogen and phosphors increases vegetative growth of plants. Besides, the spike length was significantly increased with increasing application of blended fertilizer rates (Table 3) In line with the finding of Diriba et al. (2019) [14] who reported that NPSB rate applications increased spike length of bread wheat. Similarly, Dinka Tariku et al. (2018) [47] reported that higher mean spike length of barley was obtained from application of sole and integrated nutrient management as compared to non-fertilized on barley. Similarly Wakene et al. (2014) reported that plant height of barely was increase with increased NP fertilizer rates application.
Yield and Yield related parameters Number of seed/spike
The main effect of NPS fertilizer rates had highly significant influence (p<0.01) on number of seed/spike of barley. However varieties had significant influence on number of seed per spike (p<0.05) and the maximum and minimum number of seed per spike was recorded from varieties EH1493 and Cross41/98, respectively. This result was due to genetic variation between varieties and it was similar with the finding of (Alam et al., 2007) [46] . The maximum (60.87) number of seed per spike was recorded from the plots which received 200 kg h -1 while; the minimum (40.83) was obtained from control plots. The incensement of number of seed per spike linearly increases with the application of blended NPS fertilizer rates (Table 4). This result is consistence with the finding of Malkamu et al. (2019), who evaluated the response of different blended fertilizers on yield and yield components of food barley and in line with Bereket et al. (2014) [6] who reported that macro and micro nutrients (Nitrogen, Phosphorous with Sulfur and Born) fertilizers application can increase plant height, spike length, number of tillers and number of kernel with increasing doses and combination.
| Treatments NPS kg ha-1 | DH (50%) | DM (50%) | Plant height (cm) | Spike length (cm) |
|---|---|---|---|---|
| 0 | 73.11a | 126.1a | 87.31a | 9.4a |
| 50 | 66.33b | 117.8b | 97.59b | 12.05b |
| 100 | 66.11b | 115c | 99.65b | 12.49bc |
| 150 | 64.78b | 113.6c | 102.01b | 13.14c |
| 200 | 64.56b | 111.3d | 107.79c | 14.17d |
| Varieties | ||||
| EH1493 | 75.20a | 123.8a | 106.79c | 13.10c |
| HB13O7 | 66.87b | 118.5b | 103.12b | 12.68b |
| Cross#41/98 | 58.87a | 107.9c | 86.70a | 11.00a |
| Varieties | ** | * | * | * |
| Fertilizer | * | * | * | * |
| Fertilizer*Varieties | Ns | Ns | ns | ns |
| CV% | 2.9 | 1.7 | 3.6 | 4.2 |
| LSD% | 1.424 | 1.89 | 3.4 | 0.49 |
Table text extracted from the original PDF; superscript letters are shown inline. The original table image is below.
View original table image
Number of total tiller
The analysis of variance was noticeable that the application NPS fertilizers and varieties had highly significant influence (p<0.001) on number of total tillers per plant. But, their interaction effect of the two factors was not significant. The highest number of total tillers (6.08 tiller/plant) was obtained with the application of blended fertilizer 200 kg NPS ha -1 , while the lowest number of total tillers (3.84 tiller/plant) was obtained from the unfertilized plots (Table 4). The number of tillers was increased with the highest rates of NPS might be due to the rapid exchange of combined carbohydrates into protein and accordingly increased the number and size of growing cells, finally leading in increased number of tillers. This finding is in line with the result of (Yared Tesfaye et al., 2020) [37] .who concluded that combined application of 150 kg NPS and 46 kg N ha -1 can be recommended for production of teff in the study area and other areas with similar agro-ecological conditions. In agreement with the result, Wakjira (2018) reported total number of tillers increased consistently and significantly in response to increasing the rate of blended NPS fertilizer from nil to 120 kg ha -1 . Seifu (2018) [48] reported that highest total number of tillers of teff was obtained from the application of the highest rate 150 kg ha -1 blended (NPSB) fertilizer whereas the lowest number of tillers was from the control plot.
Thousand grain weight
The thousand grain weights were not significantly affected by varieties and their interaction with fertilizers, but highly significantly affected (p<001) by NPS fertilizer application. The highest thousand grain weight (49.90 gm) was attributed from the plots which received 200 NPS kg ha -1 and the lowest (43.64) was recorded from unfertilized plots (table 4).This result was in line with the findings of Malkamu et al. (2019), who evaluated the response of different blended fertilizers on yield and yield components of food barley and who obtained the maximum (43.97 gm) 1000 kernels weight were obtained from the application of 200 NPSB kg ha -1 blended fertilizers treatment. Whereas, thousand kernel weight (28.37 gm) t was obtained from the control. Correspondence with the finding of Assefa Woldie (2015) [5] who suggested that increasing incorporated cattle manure and mineral fertilizer application had increased the thousand kernel weights of barley.
Productive tiller
Data analysis of variance showed that the main effect of varieties and NPS had significant influence (p<001) on productive tiller. Number of productive tiller per plant of barley was increased with increasing blended fertilizers application rates. The maximum productive tiller (5.310) was observed from the highest NPS fertilizer application rate and the minimum (2.67) was obtained from unfertilized (control) plot. (Table 5). The highest number of productive tillers might be due to sufficient amount of growth and development of plants owing to the essential elements under blended NPS fertilizer condition. This result was consistence with the results of Fayera et al. (2014) [17] , who found the highest productive tillers of teff (26 tillers per plant) under the application of 200 kg ha -1 of blended fertilizer (14N, 21P 2 O 5 , 15K 2 O, 6.5S, 1.3Zn and 0.5B) combined with 23 kg N ha -1 fertilizer. This result is also supported by the findings of Wakjira (2018), where productive tiller number of teff was increased from 8.62 to 15.17 under the application blended NPS fertilizer rates at zero and 120 kg ha -1 respectively. Similarly, Seifu (2018) [48] reported that highest number of productive tillers of teff was obtained from the application of the 150 kg ha -1 blended (NPSB) fertilizer rate while the lowest number of productive tillers obtained from the control plot.
| Treatments | Spike | Straw | Grain | Above | Total | Productive | Number | Thousad |
|---|---|---|---|---|---|---|---|---|
| length | yield | yield | ground | tiller/p | tiller/plat | of seed/ | grain | |
| 0 | 9.4a | 4507a | 2625a | 7132a | 3.84 | 2.67a | 40.83 | 43.64a |
| 50 | 12.05b | 6526b | 3305b | 9831b | 5.066 | 3.841b | 52.82 | 45.80b |
| 100 | 12.49bc | 6928bc | 3971c | 10899c | 5.458 | 4.554c | 55.18 | 46.93bc |
| 150 | 13.14c | 7589c | 4310cd | 11899d | 5.736 | 4.943cd | 56.77 | 48.27cd |
| 200 | 14.17d | 7745c | 4592d | 12337d | 6.08 | 5.310d | 60.87 | 49.90d |
| Varieties | ||||||||
| EH1493 | 13.10c | 7800c | 3525a | 11325c | 4.596a | 4.145a | 54.43b | 46.13 |
| HB1307 | 12.68b | 6592b | 3968b | 10561b | 5.319b | 3.933a | 54.21b | 47.20 |
| Cross41/98 11.00a 5584a | 3789b | 9374a | 5.798c | 4.711b | 51.25a | 47.10 | ||
| Varieties ** ** | ** | ** | ** | * | * | Ns | ||
| Fertilizes ** ** | ** | ** | ** | * | ** | ** |
Table text extracted from the original PDF; superscript letters are shown inline. The original table image is below.
View original table image
Grain yield
The analysis of variance described that the main effect of varieties had highly significant (p<0.001) effect on grain yield of barley however NPS fertilizer application rates had significant effect (p<001) on grain yield. But the interaction of NPS and Varieties were not significant effect on the grain yield (Table 4). Increasing the rates of NPS fertilizers was increased the grain yields of barley. The maximum grain yield (4.592 t ha -1 ) was obtained from 200NPS kg ha -1 of fertilizer application. Oppositely, the minimum grain yield (2.625 t ha -1 ) was gained from unfertilized plot, The maximum grain yield at the highest NPS rate of fertilizer might have resulted from more profitable root growth and increased uptake of nutrients and better growth preferred over all others due to working together/collaborative effect of the three nutrients which enhanced yield components and yield of barley. This result was in line with the finding of Yared et al. (2020) [37] who illuminate the effects of blended NPS fertilizer rates and row spacing on yield and yield components of barley at highlands of Ethiopia.
Aboveground biomass
Data analysis was revealed that the main effect of varieties and NPS were highly significant (p<001) on above ground biomass. However, their interaction was not significant on above ground biomass. The maximum total above ground biomass (12337 kg h -1 ) was observed from the plots which received the highest (200 kg h -1 NPS) fertilizer rates and the minimum biomass (7132 kg h -1 ) was obtained from the plot which received the lowest (0 kg h -1 NPS) fertilizer rates (Table 4). As NPS increased the total biomass was also increased. This might be due to the application of P, N and S increases dry matter accumulation in plant tissues and nitrogen and phosphors increases vegetative growth of plants, especially at higher doses. In addition, the significant increase in spike length, number of seeds per spike, number of fertile tillers, non-fertile tillers and grain yield by NP contributed for the significant increase in TBM. These finding is in line with the result of Mesfin, and Zemach., (2015) who reported the effect of nitrogen and phosphorus fertilizer rates on yield and yield components of barley and supported by Rashid.et.al. (2007) [28] who indicated comparative effect of varieties and fertilizer levels on barley.
Straw yield
The analysis of variance indicated that the main effect of NPS fertilizer rates and varieties had highly significant effect (p<0.001) on the straw yield of barley. The highest (7.745 t ha -1 ) and the lowest (4.507 t ha -1 ) straw yield were obtained from application of 200NPS kg ha -1 of blended fertilizer and unfertilized respectively. The straw yield increases with increasing NPS fertilizers rates due to phosphorus which increases dry matter accumulation (Table4). These result was consistence with the finding of Wubishet et al. (2017) [49] who reported that application of 150 kg ha -1 NPSB blended fertilizer increased the straw yield and agreement with the finding of Yared et al. (2020) [37] , who reported effect of blended NPS and nitrogen fertilizers rates on yield components and yield of tef [eragrostis tef (zucc.).
Agronomic use efficiency
The analysis of variance shows that nutrient uptake was significantly different (p<0.001) among the varieties. The maximum nutrient uptake (14.70 kg ha -1 ) was observed from Cross#41/98 variety, whereas the minimum was gained from EH1493 variety (10.07 kg ha -1 ) (Table 5), which might be due to genetic inheritance deference among varieties. However, the main effect of blended NPS fertilizers was significantly influence (p<0.05) on agronomic use efficiency. Besides the utilization of different NPS blended fertilizers rates were significantly affect clearly revealed nutrient return and agronomic use efficiency on barley (Table 5). As the application of NPS fertilizer rates increased, then the clearly revealed nutrient return and agronomic use nutrient efficiency were decreased. Therefore, clearly revealed nutrient return and agronomic nutrient use efficiency was recorded at 100 and 50 Kg ha -1 NPS blended fertilizers respectively. This result was consistencies with the finding of Melkamu et al. (2019) [23] Who declared effects of blended fertilizers on nutrient use efficiency and the effects of different blended fertilizers and their rates on yield and yield components of barley.
Harvest index
Analysis of variance shows that Harvest index was highly significantly (p<0.001) affected by main effects of blended NPS and varieties and not significantly affected by their interaction. This result is in lined with the findings of Tagesse Abera et al. (2018) [50] . Harvest index was linearly increased with increasing fertilizer application. The highest mean harvest index (44.92) was obtained at higher rate of NPS (200 kg ha -1 ) while, the lowest harvest index was gained from the control plots (0NPS kg ha -1 ). In the varieties the highest harvest index (47.29%) was observed from Cross#41/98, while the lowest harvest index (34.27%) was obtained from HB1307 (table5). The variety that have most harvest index was visible its tendency to efficiently distribute the dry matter gained to sink organ contrasted to other varieties. This result is followed by (Ketema Niguse et al., 2018) [21] .
Economic Analysis
Partial Budget Analysis: As indicated in Table 6, the highest net benefit of 134798 Birr ha -1 with marginal rate of return (MRR) of 1042.47% was obtained in response to application of 200 kg blended NPS ha -1 combined with 46 kg N ha -1 . However, the lowest net benefit 78750 Birr ha -1 was Obtained for the control treatment without the application of NPS fertilizer rates. Thus, applications of 200 kg blended NPS ha -1 combined with 100 kg urea ha -1 rate is economically beneficial as compared to the other treatments in the study area because the highest net benefit and the marginal rate of return was above the minimum level (100%). In this case 100 kg ha -1 of urea was equally applied for all treatments.
| Treatments | Agronomic efficiency | Harvest index% |
|---|---|---|
| Fertilizers (kg ha-1) | ||
| 0NPS | 0 | 30.94 |
| 50NPS | 13.67 | 38.35 |
| 100NPS | 13.47 | 42.09 |
| 150NPS | 11.24 | 44.02 |
| 200NPS | 9.84 | 44.92 |
| Varieties EH1493 | 10.7a | 44.64c |
| HB1307 | 11.40a | 34.27a |
| Cross#41/98 | 14.70b | 47.29b |
| Fertilizer | * | ** |
| Varieties | * | ** |
| Fertilizer*Varieties | Ns | Ns |
| CV% | 19.2 | 6 |
| LSD% | 3.529 | 2.296 |
Table text extracted from the original PDF; superscript letters are shown inline. The original table image is below.
View original table image
Conclusion
The result of soil laboratory shows that the soil of the experimental area was texturally sandy clay loam with the pH 6.02 which was slightly acidic. The CEC of was 37cmo (+) kg of soil which was high. The analysis revealed that the soil of the experimental site contains (0.914% OC, 1.58% OM and 0.14% N) which was low. Available P content of the soil was 8.2 mg kg -1 which was high range. Main effect of both NPS fertilizer rate and varieties had highly significant effect (p<0.001) on phenological, plant height, total tiller per plant and above ground biomass and the main effect of NPS fertilizers rates had significant influence on number of seed/spike. The maximum (54.43) number of seed per spike was recorded from EH1493. Grain yield was significantly and highly significantly (p<001) influenced by NPS fertilizers and varieties, respectively. The maximum grain yield (4592 kg ha -1 ) was obtained from 200NPS kg ha - 1 of fertilizer application. Thousand grain weights were highly significantly affected (p<001) by NPS fertilizer application. The highest thousand grain weights (49.90 gm) were attributed from the plots which received 200 NPS kg ha -1 . The main effect of NPS fertilizer rates and varieties had highly significant effect (p<0.001) on the straw yield of barley. The highest straw yield (7745 kg ha -1 ) was obtained from application 200NPS kg ha -1 of blended fertilizer. The nutrient uptake was significantly different (p<0.001) among the varieties. The maximum nutrient uptake (14.70 kg ha -1 ) was observed from Cross#41/98 variety. However, the main effect of blended NPS fertilizers significantly influenced (p<0.05) agronomic use efficiency. The highest net benefit of 134798 Birr ha -1 with marginal rate of return (MRR) of 1042.47% was obtained in response to application of 200 kg blended NPS ha -1 . Thus, applications of 200 kg blended NPS ha -1 combined with 100 kg urea ha -1 rate is economically beneficial for production of barley yield as compared to the other treatments in the study area. But this result was at one location and at one season; so other study has to be repeated on more location and season to achieve best conclusion and recommendation for Gurawa district.
Figures and tables from the paper
| Treatments | NPS | Adjusted | Total Return | Total variable | Net Income | MRR |
|---|---|---|---|---|---|---|
| Kg ha-1 | Yield kg ha-1 | (Birr ha-1) | Cost (Birr ha-1) | (Birr ha-1) | (%) | |
| T1 | 0 | 2625 | 78750 | 0.00 | 78750 | 0.00 |
| T2 | 50 | 3305 | 99150 | 740.5 | 98410 | 2654.96 |
| T3 | 100 | 3971 | 119130 | 1481 | 117649 | 0.00 |
| T4 | 150 | 4310 | 129300 | 2221.5 | 127078.5 | 1273.4 |
| T5 | 200 | 4592 | 137760 | 2962 | 134798 | 1042.47 |
Table text extracted from the original PDF; superscript letters are shown inline. The original table image is below.
View original table image
References
38 in the original paper- Alam MZ, SA Haider. Growth attributes of barley (Hordeum vulgare L.) cultivars in relation to different doses of nitrogen fertilizer. Journal of Life Earth Science. 2006;1:77-82.
- Assefa M, Johnson MR, Semoka NA, Tekalign M. Crop Response to Applied Nitrogen, Sulphur, and Phosphorous in three Representative Areas of the Central Highlands of Ethiopia-I. International Journal of Plant & Soil Science. 2015;8(5):1-11.
- Assefa Woldie. Response of barley (Hordeum vulgare L.) to integrated cattle manure and mineral fertilizer application in the vertisol areas of south Tigray, Ethiopia. Journal of Plant Sciences. 2015;3(2):71-76.
- Bereket H, Dawit H, Mehretab H, Gebremedhin G. Effects of Mineral Nitrogen and Phosphorus Fertilizers on Yield and Nutrient Utilization of Bread Wheat on the Sandy Soils of Hawzen District, Northern Ethiopia. Agriculture, Forestry, and Fisheries. 2014;3(3):189198.
- Bouyoucos GJ. Hydrometer method improved for making particle size analyses of soils 1. Agronomy journal. 1962 Sep;54(5):464-5.
- CSA (Central Statistical Agency).2016.Central Statistical Agency agricultural sample survey report on area and production of major crops private peasant holdings, meher season. Addis Ababa, Ethiopia. vol. I.
- Dagne C. Blended Fertilizers Effects on Maize Yield and Yield components of Western Oromia, Ethiopia. Agriculture, Forestry and Fisheriezs. 2016;5(5):151162.
- Diriba Shiferaw G, Rut-Duga D, Wogayehu W. Effects of blended fertilizer rates on bread wheat (Triticum aestivum L.) varieties on growth and yield attributes. J Ecol & Nat Resour. 2019;3(3):1-3.
- Fayera Asefa AD, Mohammed M. Evaluation of Tef [Eragrostis tef (Zuccagni) Trotter] Responses to Different Rates of NPK Along With Zn and B in Didessa District, Southwestern Ethiopia. World Applied Sciences Journal. 2014;32(11):2245-2249.
- Gomez KA, Gomez H. Statistical analysis for agricultural research. John Willy and Sons Inc., 1984, 120-55.
- Habtamu A, Heluf G, Bobe B, Enyew A. Fertility Status of Soils under Different Land uses at Wujiraba Watershed, North-Western Highlands of Ethiopia. Agriculture, Forestry and Fisheries. 2014;3410-419.
- Ketema N, Mulatu K. Response of food barley (Hordeum Vulgare L.) varieties to N fertilizer rates in Limo District, Hadiya zone, Ethiopia, Debark University and Debre markos university, Departmen of plant sciences. Journal of Natural scince research.ISSN2225-3186 (paper) ISSN2225-0921 (online). 2018;15(8).
- Lake Mekonnen, Bezabih Kiros W. Response of Food Barley (Hordeum Vulgare L) to International Journal of Research in Agriculture and Forestry. 2018;5:21-26.
- Kassa M, Sorsa Z. Effect of nitrogen and phosphorus fertilizer rates on yield and yield components of barley (Hordeum vugarae L.) varieties at Damot Gale District, Wolaita Zone, Ethiopia. American Journal of Agriculture and Forestry. 2015 Dec 22;3(6):271-5.
- Nadian H, Najarzadegan R, Saeid KA, Gharineh MH, Siadat A. Effects of boron and sulfur application on yield and yield components of Brassica napus L. in a calcareous soil. World Applied Sciences Journal. 2010;11(1):89-95.
- Oikeh SO, Chude VO, Kling GJ, Horst WJ. Comparative productivity of nitrogen-use efficient and nitrogen inefficient maize cultivars and traditional grain sorghum in the moist Savannah of West Africa. African J Agri. Res. 2007;2:112-118.
- Rashid A, Khan UK, Khan DJ. Comparative Effect of Varieties and Fertilizer Level Barley (Hordeum vulgare). ISSN Online: 1814-9596 Pakistan; c2007.
- Gurmu S, Mintesnot A. Effect of Combined Application of NPS Fertilizer and Compost on Phenology and Growth of Quality Protein Maize (Zea mays L.) at Jimma, South Western Ethiopia. International Journal of Research Studies in Science, Engineering and Technology. 2020;7:18-28.
- Chaturvedi RK, Singh B, Singh VK. A review on impact of ceramic fertilizers with slow release of nutrient elements for agriculture applications. Int. J Agric. Food Sci. 2021;3(1):01-04. DOI: 10.33545/2664844X.2021.v3.i1a.42
- Vanlauwe B, Kihara J, Chivenge P, Pypers P, Coe R, Six J. Agronomic use efficiency of N fertilizer in maize-based systems in sub-Saharan Africa within the context of integrated soil fertility management. Plant and Soil. 2011;339:35-50.
- Tigre W, Worku W, Haile W. Effects of Nitrogen and Phosphorus Fertilizer Levels on Growth and Development of Barley (Hordeum vulgare L.) at Bore District, Southern Oromia, Ethiopia. American Journal of Life Sciences. 2014;2(5)260-266.
- Tesfahun W. Tef Yield Response to NPS Fertilizer and Methods of Sowing in East Shewa, Ethiopia. Journal of Agricultural Sciences. 2018;13(2):162-173.
- Worku M, Friesen BE, Diallob OA, Horst WJ. Nitrogen uptake and utilization in contrasting nitrogen efficient tropical maize hybrids. Crop Sci. 2007;47:519-528.
- Woubshet D, Selamyihun K, Cherukuri V. Effect of integrated use of lime, blended fertilizer, and compost on productivity, nutrient removal and economics of barley (Hordeum vulgare L.) on acid soils of high lands in West Showa Zone of Ethiopia. Int. J of Life Sciences. 2017;5(3):311-322.
- Yared T, Seyoum A, Kabna A, Girma T, Obsa C. Effect of Blended NPS Fertilizer Levels and Row Spacing on Yield Components and Yield of Food Barley (Hordeum Vulgare L.) at High Land of Guji Zone, Southern Ethiopia. Acad. Res. J Agri. Sci. Res. 2020;8(6):609618.
- Tesfaye Y, Teshome G, Asefa K. Effects of Nitrogen and Phosphorus Fertilizers Rate on Yield and Yield Components of Tef at Adola District, Guji Zone, in Southern Ethiopia. American Journal of Agricultural Research. 2019;4:57.
- Muluken B. Study on malting barley genotypes under diverse Agroecologies of north western Ethiopia. African journal of plant science. 2013 Nov 30;7(11):548-57.
- Rhoades RE, Booth RH. Farmer-back-to-farmer: a model for generating acceptable agricultural technology. Agricultural administration. 1982 Oct 1;11(2):127-37.
- Walkley A, Black IA. An examination of the Degtjareff method for determining soil organic matter, and a proposed modification of the chromic acid titration method. Soil science. 1934 Jan 1;37(1):29-38.
- Reeuwijk HJ, Irth H, Tjaden UR, Merkus FW, Van der Greef J. Liquid chromatographic determination of βcyclodextrin derivatives based on fluorescence enhancement after inclusion complexation. Journal of Chromatography B: Biomedical Sciences and Applications. 1993 Apr 21;614(1):95-101.
- Olsen SR. Estimation of available phosphorus in soils by extraction with sodium bicarbonate. US Department of Agriculture; 1954.
- Johnson GV, Fixen PE. Testing soils for sulfur, boron, molybdenum, and chlorine. Soil testing and plant analysis. 1990 Jan 1;3:265-73.
- Ervio RR. Makela-Kurtto, Sippola J.. Chemical characteristics of Finish agricultural soils in 1974 and in 1987. Acidification in Finland. Springer-Verlag. Berlin, Heidelberg. Farrah, H. and WF Pickering. 1977; c1990. p. 189-97.
- Alam MR, Amin MR, Kabir AK, Moniruzzaman M, McNeill DM. Effect of Tannins in Acacia nilotica, Albizia procera and Sesbania acculeata Foliage Determined In vitro, In sacco, and In vivo. Asianaustralasian journal of animal sciences. 2007;20(2):2208.
- Tariku EZ, Abebe GA, Melketsedik ZA, Gutema BT. Prevalence and factors associated with stunting and thinness among school-age children in Arba Minch Health and Demographic Surveillance Site, Southern Ethiopia. PloS one. 2018 Nov 2;13(11):e0206659.
- Seifu WD, Gebissa AD. Prevalence and antibiotic susceptibility of Uropathogens from cases of urinary tract infections (UTI) in Shashemene referral hospital, Ethiopia. BMC infectious diseases. 2018 Dec;18(1):1-9.
- Wubishet Z, Yacob H. Cross-sectional survey on equine gastro intestinal stroglylosis and fasciolosis in Goba District of Bale Zone, Oromia Regional State, Ethiopia. Anim Vet Sci. 2017 Oct 30;5(5):84-8.
- Abera T, Belete K, Tamado Tana. Effect of Blended NPS Fertilizer Supplemented with Nitrogen on Yield Components and Yield of Bread Wheat (Triticum aestivum L.). Journal of Natural Sciences Research. 2018;8(11):90-96.
Cited by 1
From OpenAlex, OpenCitations and reference lists read by Scinovex
- Effects of Weeding Frequency and NPS Fertilizer Rates on Barley (Hordeum vulgare L.) Yield performance, Western Ethiopia ↗
Mendera Jaleta, Zerihun Jalata, Wagari Alemayehu · International Journal of Agricultural Science and Food Technology · 2024
Background: Food barley is one of the main staple crops in Ethiopia, however, its production is influenced by several factors including the effect of weeds and low soil fertility. Purpose: An experiment was conducted with the objective of investigating the combined impact of weeding frequencies and NPS fertilizer rates on barley growth and yield performance. Methodology: Three levels of weeding…
❝ 2PDF