
Research article · 2022 · Full text
International Journal of Horticulture and Food ScienceStudies on genetic variability and character association in fennel (Foeniculum vulgare mill.)
Volume 4(2) · Pages 134–139 · DOI: 10.33545/26631067.2022.v4.i2b.120 ↗
Research areasAgricultural Practices and Plant GeneticsGenetics and Plant BreedingAgricultural Science and Fertilization
Abstract
Author-writtenA set of ten genotypes of fennel were evaluated for studying of “Studies on Genetic Variability and Character association in Fennel (Foeniculum vulgare Mill.)”. The experiment was conducted in a Randomized Block Design with three replications during the Rabi season, 2021 at Horticultural Research Farm, Department of Horticulture, Naini Agricultural Institute, Sam Higginbottom University of Agriculture, Technology and Sciences, Prayagraj. The data were recorded from five randomly selected plants for each genotype in all the replications for twelve characters. From the present investigation it is concluded that among 10 genotypes of fennel on the basis of mean performance 2 genotypes namely; Sugandha-111 and Surbhi had maximum seed yield per plant and performed better for other desirable traits as compared to Kalyan (Check). Analysis of variance showed the presence of significant variation among different genotypes for all characters studied. Number of primary branches per plant and seed yield per hectare exhibited moderate estimates of GCV and PCV and also High estimates of Heritability (Broad-sense). Therefore, these characters should be given priority during selection for improvement in fennel. Positive and significant correlation was observed for number of umbels per plant, number of umbellet per umbel, number of seeds per umbel, seed yield per hectare and seed index with seed yield per plant at both phenotypic and genotypic level. Path Coefficient analysis revealed that days to maturity, number of primary branches per plant, number of seeds per umbel, seed index and harvest index had direct positive effect on seed yield per plant at genotypic level. While days to 50% flowering, days to maturity, number of umbels per plant, number of umbellet per umbel, number of seeds per umbel, seed yield per hectare and seed index had direct positive effect on seed yield per plant at phenotypic level. Selection in these traits will lead to higher efficiency in breeding programme for improving yield. Thus these traits may be ranked as most important attributing traits for seed yield per plant in fennel.
Summary
Source-checkedPlain-language reading of the full paper, prepared with AI and checked against the text. Each point links to the authors' own words.
Why it matters
- India is the global leader in fennel production, accounting for 60% of the world's total output. View evidence ↗
- Because fennel yield is a complex, quantitatively inherited trait, understanding genetic variability and the association between yield and its components is a necessary first step for breeding programs. View evidence ↗
The question
- The study aimed to evaluate ten fennel genotypes to analyze their genetic variability and the associations between different characters. View evidence ↗
What they did
- The research used a Randomized Block Design with three replications, testing nine genotypes and one check variety during the Rabi 2021-22 season. View evidence ↗
- Twelve quantitative characters were measured from five randomly selected plants per genotype, including seed yield per plant, seed yield per hectare, and various growth and flowering metrics. View evidence ↗
What they found
- Based on mean performance, the genotypes Sugandha-111 and Surbhi achieved the highest seed yield per plant and outperformed the Kalyan check variety in other desirable traits. View evidence ↗
- Analysis of variance confirmed that there were significant differences among the ten genotypes for all twelve characters studied. View evidence ↗
- Moderate Genotypic Coefficient of Variation (GCV) and Phenotypic Coefficient of Variation (PCV) were found for seed yield per hectare and the number of primary branches per plant, indicating potential for improvement. View evidence ↗
- High broad-sense heritability (60% or higher) was observed for several traits, including seed yield per plant, seed yield per hectare, and the number of primary branches per plant. View evidence ↗
- Seed yield per plant showed positive and significant correlations at both phenotypic and genotypic levels with seed index, seed yield per hectare, and the number of seeds, umbellets, and umbels. View evidence ↗
- At the genotypic level, path coefficient analysis showed that seed yield per plant was directly and positively affected by harvest index, seed index, number of seeds per umbel, number of primary branches per plant, and days to maturity. View evidence ↗
- At the phenotypic level, direct positive effects on seed yield per plant were observed from seed index, seed yield per hectare, number of seeds per umbel, number of umbellets per umbel, number of umbels per plant, days to maturity, and days to 50% flowering. View evidence ↗
What it means
- The authors recommend prioritizing the number of primary branches per plant and seed yield per hectare for selection in fennel improvement programs due to their moderate variability and high heritability. View evidence ↗
Visual summary
3 visualsIllustrations explain the paper; charts are replotted from the paper's own table values.
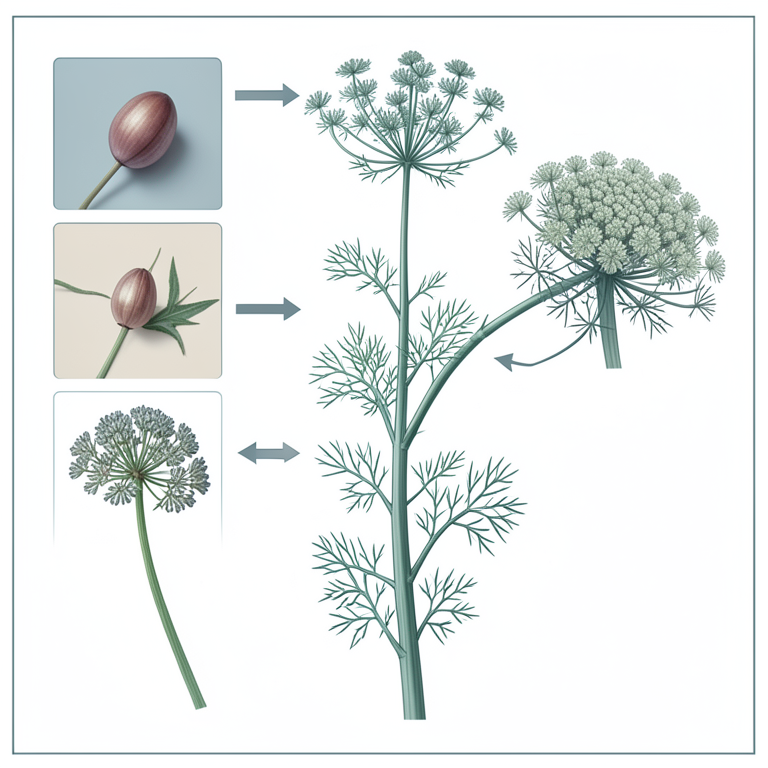
Yield Component Association
AI-generated conceptual illustration (fennel plants (Foeniculum vulgare mill.)). It explains the idea and does not show study data.
View source evidence ↗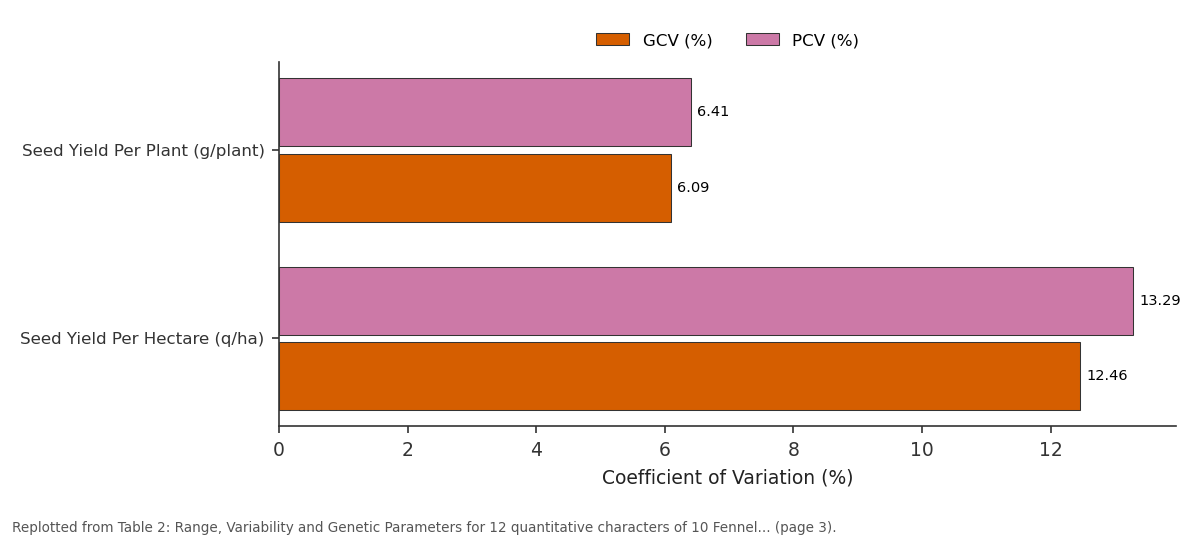
GCV (%) and PCV (%): Seed Yield Per Plant... vs Seed Yield Per Hectare...
Replotted from Table 2 (page 3) of the original paper. Every bar is the paper's own table value.
View source evidence ↗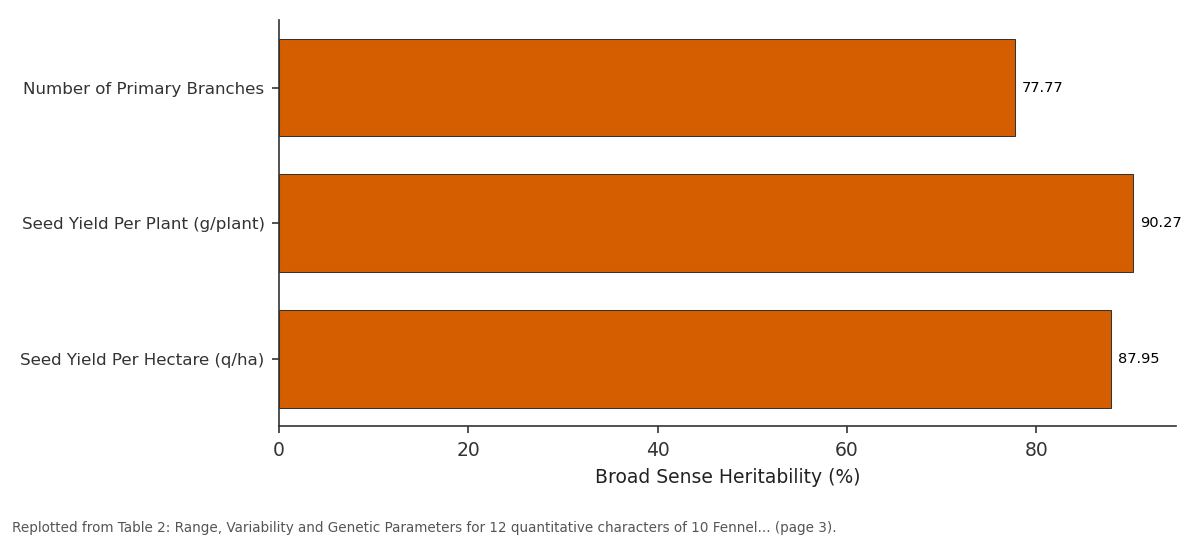
h2 (Heritability Broad Sense) (%): Number of Primary... vs Seed Yield Per Plant... vs Seed Yield Per Hectare...
Replotted from Table 2 (page 3) of the original paper. Every bar is the paper's own table value.
View source evidence ↗Figures & tables
From the original paper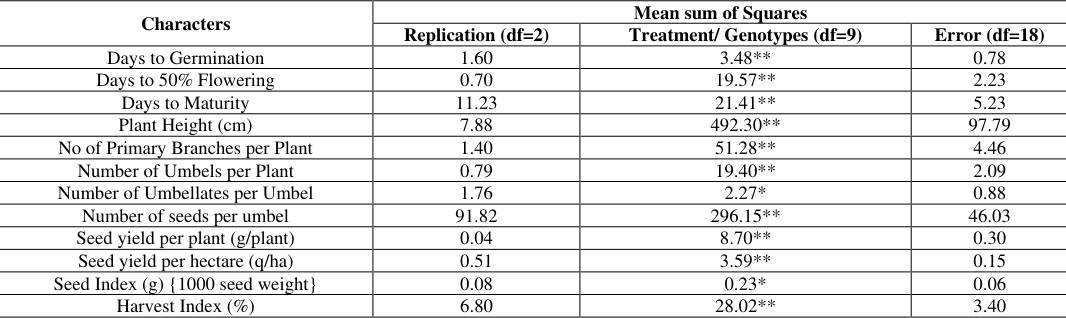 Table 1
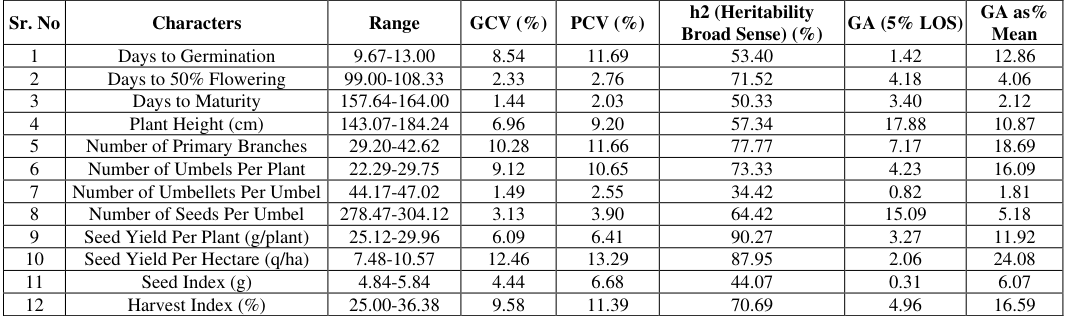 Table 2
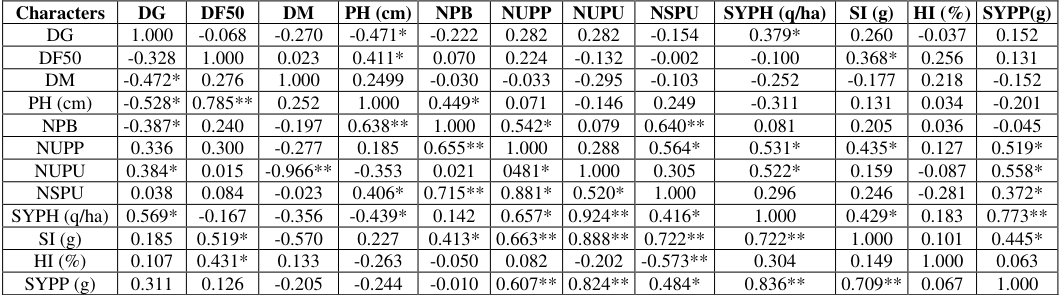 Table 3
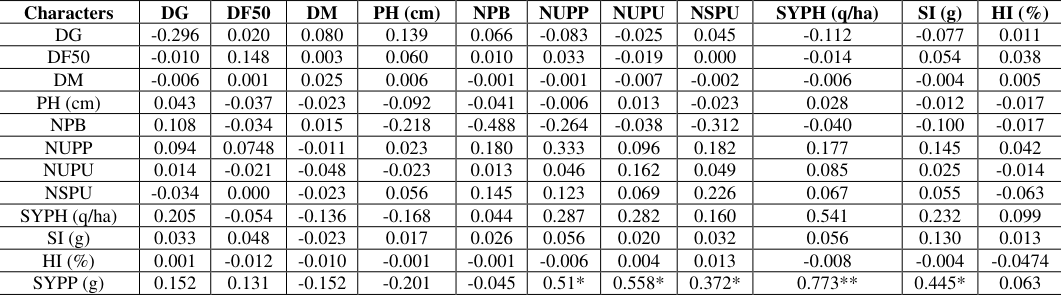 Table 4
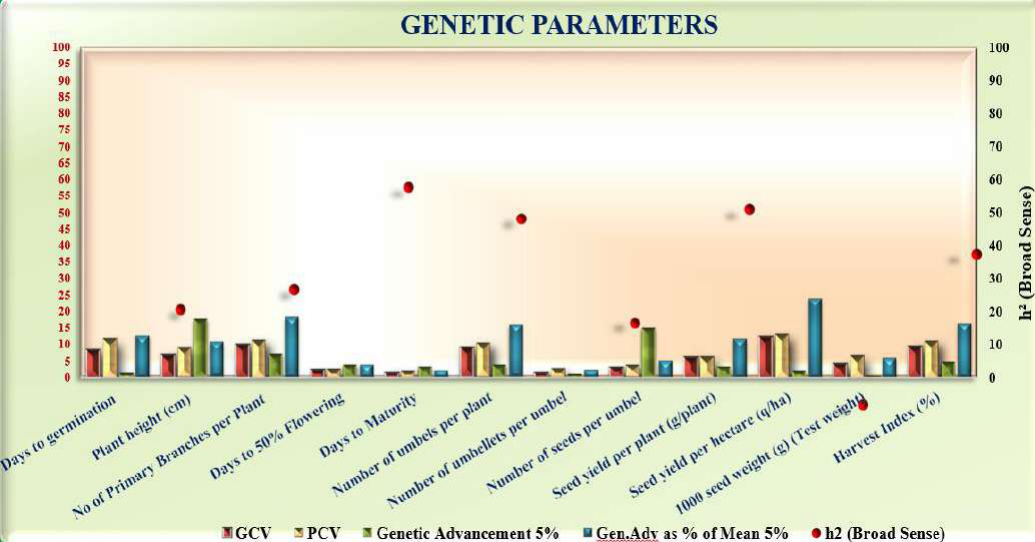 Fig1
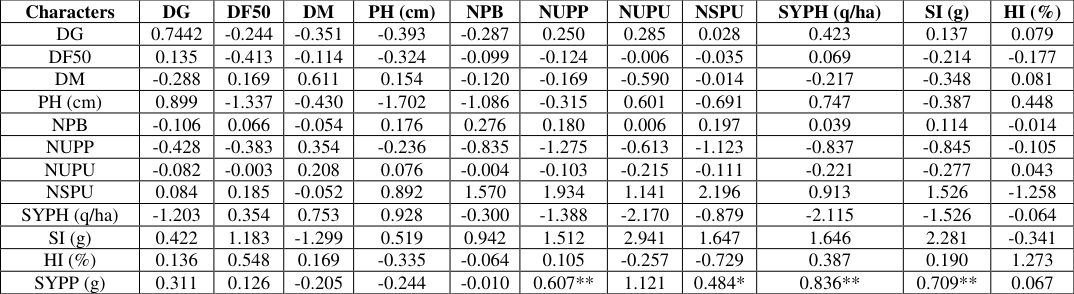 Table 5
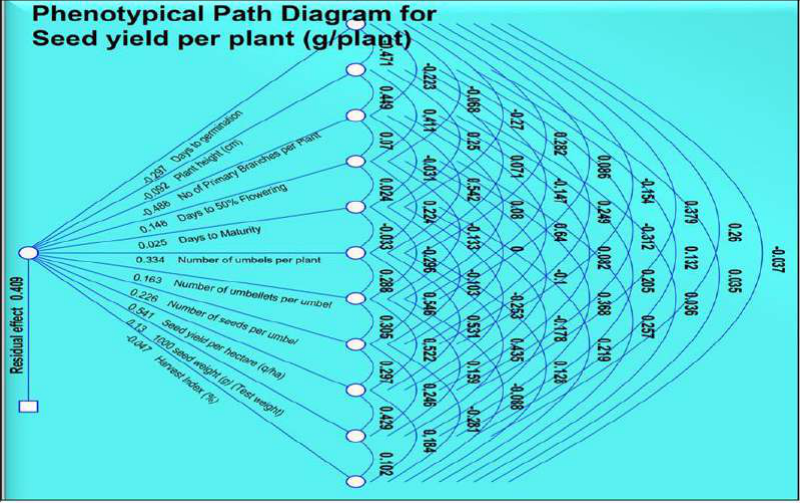 Figure 2
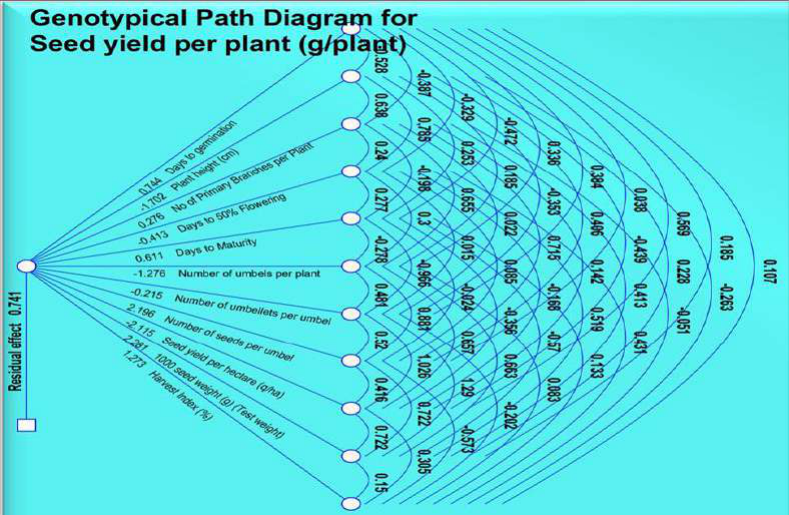 Figure 3
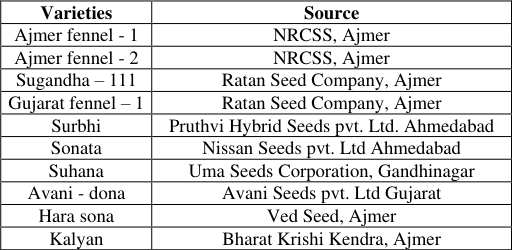 Table 6
Introduction
Fennel is a flowering plant species in the carrot family. It is a hardy, perennial herb with yellow flowers and feathery leaves. It is indigenous to the shores of the Mediterranean but has become widely naturalized in many parts of the world, especially on dry soils near the sea-coast and on riverbanks. Fennel botanically known as Foeniculum vulgare Mill. Belonging to family Apiaceae is a cross pollinated crop. It is a diploid species with chromosome number, 2n=2X=22 (Karpechenko, 1925) [12] and native of Europe (De Candole, 1959) [6] and Mediterranean region (Vavilov, 1935). It is an annual, biennial, or perennial herbaceous plant, depending on the variety, which grows in good soils from sunny mild climatic regions and is a well-known aromatic plant species. The leaves and seeds of fennel are used in many culinary traditions. India ranks first in fennel production producing 60% of world's fennel production followed by China and Bulgaria (FAOSTAT, 2019) [9] . The area under Fennel production in India accounts to 82.72 thousand ha with production of 137.29 million tonnes in year 2020-21. (Source: NHB, Ministry of Agriculture & Farmers Welfare, Government of India, 2020-21). Gujarat ranks first in area and production of fennel in year 2020-21 followed by Rajasthan and Madhya Pradesh. The production of fennel in Uttar Pradesh is 0.64 million tonnes for year 2020-21. A raw fennel bulb (235 g) consists of 212 g of water, 2.91 g of protein, 0.47 g of fat, and 17.2 g of carbohydrate (including 7.28 g of dietary fibre and 9.24 g of sugars), providing a total of 72.8 Calories (kcal) of energy. The 235 g bulb provides 115 mg of calcium, 1.72 mg of iron, 40 mg of magnesium, 188 mg of phosphorus, 973 mg of potassium, 122 mg of sodium, trace amounts of zinc, copper, and selenium, 28.2 mg of vitamin C, as well as choline, several B vitamins, folate, beta-carotene, lutein, zeaxanthin, vitamin E, and vitamin K. (FDC, USDA, 2021). Yield is a complex character and depends upon number of component characters which are quantitatively inherited. As such before launching any breeding programme, a thorough knowledge of the nature and magnitude of genetic variability and extent of association between yield and other components is essential. Evaluation of genotypes to assess the existing variability is considered as preliminary step in any crop improvement programme. Information on the magnitude of variation in the available genetic material and the part played by the environment on the expression of plant characters are prime importance for the appraisal of the magnitude of possible improvement. Variability for different traits in the source population is a prerequisite for crop improvement since all attempts of breeding and selection would be futile unless major portion of variability is heritable. Further, estimate of genetic advance and heritability would give the best picture of the extent of improvement expected from selection and reliability of selection based on phenotype (Falconer, 1989). Path coefficient is defined as the ratio of the standard deviation of the effect due to a given cause to the total standard deviation of the effect. The path analysis is simply standardized partial regression coefficient analysis which may be useful in choosing the characters that have direct and indirect effect on yield. The correlation coefficient provides information about the degree of association between two characters. However, it is now known that almost all characters are polygenic and almost all genes are pleiotropic in action such that each gene, apart from its direct contribution to a particular character contributes to several other characters also. Therefore, correlation coefficient alone would not provide a clear picture about the contribution of a particular character. For example, the estimates of correlation coefficient between two characters may be positive but the direct effect of the characters to the correlation coefficient may be negative. In this case, indirect effects are the cause of correlation coefficient and have masked the direct effect of the character. In such instances, indirect effect should be taken into consideration in formulating a selection strategy. Path analysis was initially suggested by Wright (1921) [23] and he gave the concept and methodology of path analysis but was applied for the first time in plant breeding by Dewey and Lu (1959) [24] .
Material and Methods
The experimental material for present investigation comprised of 10 genotypes of fennel (Foeniculum vulgare Mill.) were obtained from the different sources and sown at Horticultural Research Farm, Department of Horticulture, Naini Agricultural Institute, Sam Higginbottom University of Agriculture, Technology and Sciences, Prayagraj. The experiment was conducted in Randomized Block Design comprising 10 (9 genotypes +1 check) genotypes with three replications during Rabi 2021-22. The unit plot size would be 1 m2. The plants will be planted with a spacing of 30 cm between the rows and 15 cm between the plants. There were ten plants in each plot. The observations were recorded on randomly selected five plants on characters comprising Days to Germination (DM), Days to 50% flowering (DF50), Days to maturity (DM), Plant height (cm) (PH), Number of primary branches per plant (NPB), Number of Umbels per plant (NUPP), Number of Umbellets per umbel (NUPU), Number of seeds per umbel (NSPU), Seed yield per plant (g/plant) (SYPP), Seed yield per hectare (q/ha) (SYPH), Seed Index (g) (SI) [1000 seed weight], Harvest index (%) Analysis of Variance was calculated using the formula suggested by Fisher, 1963 [8] ; Coefficient of variation including Genotypic coefficient of Variation and Phenotypic Coefficient of Variation was calculated using the formula suggested by Burton, 1952 [4] ; Heritability (broad sense) was calculated using the formula suggested by Allard, 1960 [3] ; Genetic advance was calculated using the formula suggested by Johnson et al., 1955 [11] , Correlation coefficient Analysis was calculated using formula given by Al-Jibouri et al., 1958 [2] , while Path Coefficient Analysis was calculated using formula given by Dewey and Lu, 1959 [24] .
Results and Discussion
The analysis of variance for all characters of fennel genotypes revealed presence of good extant of significant differences among the genotypes for all traits. Henceforth, the data for all 12 characters that showed sufficient amount of significant differences were subjected to further statistical analysis. These results were in agreement with the studies conducted by Alam et al. (2003) [1] , Lal (2007) [14] , Kumawat et al. (2010) [13] , Jaydev et al. (2020) [10] . Both Moderate GCV and PCV was recorded for number of primary branches per plant and seed yield per hectare which suggests that improvement in these characters might be gained to a reasonable extent. Both low GCV and PCV were recorded for days to 50% flowering, days to maturity, Plant length. Number of umbellets per umbel, number of seeds per umbel, seed yield per plant and seed index. While days to germination, number of umbels per plant and harvest index had low GCV but moderate PCV. Similar results for high GCV and PCV were concluded earlier by was earlier reported by Alam et al. (2003) [1] , Lal (2007) [14] , Kumawat et al. (2010) [13] , Mohan et al. (2017) [16] , Jaydev et al. (2020) [10] . This also suggests that improvement in these characters might be gained to a reasonable extent therefore, selection for these characters would be effective because response to selection is directly proportional to the variability present in the experimental material. In present study, High heritability (broad sense) estimates (60% and above) had been observed for days to 50% flowering, number of primary branches per plant, number of umbels per plant, number of seeds per umbel, seed yield per plant (g/plant), seed yield per hectare (q/ha), and harvest index (%). Therefore, these characters are predominantly governed by additive gene action and could be improved through individual plant selection owing to their high heritability values. Similar inferences were reported earlier by Rohit et al. (2018) [18] , Patel et al. (2018) [17] and Rajput et al. (2022) [19] . Moderate GCV along with high heritability was observed for Number of primary branches per plant and seed yield per hectare. This indicated that these traits are comparatively under less influence of environment henceforth, desirable for selection in breeding programme. High estimates of heritability coupled with moderate genetic advance as% of mean was recorded for number of primary branches per plant, number of umbels per plant, seed yield per plant (g/plant), seed yield per plant (g/plant), seed yield per hectare (q/ha), and harvest index (%). While moderate estimates of heritability coupled with moderate genetic advance as% of mean was observed for days to germination and Plant height (cm). These traits are governed by additive gene action and thus can be improved through direct selection. This indicates closeness of respective σ2p and σ2g value thereby low environmental effect on expression of these characters. Such values may be attributed to the additive gene effects and direct selection for these traits would be fruitful. Thus, phenotypic selection may be effective for these characters. Similar inferences were drawn by reported earlier by Alam et al. (2003) [1] , Lal (2007) [14] , Sastry et [18] , Patel et al. (2018) [17] and Rajput et al. (2022) [19] .
Positive and significant correlation was observed for number of umbels per plant, number of umbellets per umbel, number of seeds per umbel, seed yield per hectare and seed index with seed yield per plant at both phenotypic and genotypic level. Therefore, these characters emerged as most important attributing associates of seed yield per plant in fennel. Thus, selection practiced for the improvement in one character will automatically result in the improvement of the other character even if direct selection for improvement has not been made for the yield character. Path Coefficient analysis revealed that days to maturity, number of primary branches per plant, number of seeds per umbel, seed index and harvest index had direct positive effect on seed yield per plant at genotypic level. While days to 50% flowering, days to maturity, number of umbels per plant, number of umbellets per umbel, number of seeds per umbel, seed yield per hectare and seed index had direct positive effect on seed yield per plant at phenotypic level. Selection in these traits will lead to higher efficiency in breeding programme for improving yield. Thus these traits may be ranked as most important attributing traits for seed yield per plant in fennel. The similar results were reported earlier by Alam et al. (2003) [1] , Lal (2007) [14] , Sastry et al. (2009), Kumawat et al. (2010) [13] , Sengupta et al. (2014), Mohan et al. (2017) [16] , Rohit et al. (2018) [18] and Jaydev et al. (2020) [10] .
Acknowledgement
AcknowledgementThe author would like express heartfelt gratitude to Dr. Devi Singh (Associate Professor, Department of Horticulture, NAI, SHUATS, Prayagraj for his continuous guidance and supervision throughout our research period. And also, equally extend our profound gratitude to Dr. C John Wesley, Associate Professor, Department of Centre for Geospatial Technologies, SHUATS, Prayagraj for his valuable suggestions, guidance.
Figures and tables from the paper
| Characters | Mean sum of Squares | — | — |
|---|---|---|---|
| Replication (df=2) | Treatment/ Genotypes (df=9) | Error (df=18) | |
| Days to Germination | 1.60 | 3.48** | 0.78 |
| Days to 50% Flowering | 0.70 | 19.57** | 2.23 |
| Days to Maturity | 11.23 | 21.41** | 5.23 |
| Plant Height (cm) | 7.88 | 492.30** | 97.79 |
| No of Primary Branches per Plant | 1.40 | 51.28** | 4.46 |
| Number of Umbels per Plant | 0.79 | 19.40** | 2.09 |
| Number of Umbellates per Umbel | 1.76 | 2.27* | 0.88 |
| Number of seeds per umbel | 91.82 | 296.15** | 46.03 |
| Seed yield per plant (g/plant) | 0.04 | 8.70** | 0.30 |
| Seed yield per hectare (q/ha) | 0.51 | 3.59** | 0.15 |
| Seed Index (g) {1000 seed weight} | 0.08 | 0.23* | 0.06 |
| Harvest Index (%) | 6.80 | 28.02** | 3.40 |
Table text extracted from the original PDF; superscript letters are shown inline. The original table image is below.
View original table image
| Sr. No | Characters | Range | GCV (%) | PCV (%) | h2 (Heritability Broad Sense) (%) | GA (5% LOS) | GA as% Mean |
|---|---|---|---|---|---|---|---|
| 1 | Days to Germination | 9.67-13.00 | 8.54 | 11.69 | 53.40 | 1.42 | 12.86 |
| 2 | Days to 50% Flowering | 99.00-108.33 | 2.33 | 2.76 | 71.52 | 4.18 | 4.06 |
| 3 | Days to Maturity | 157.64-164.00 | 1.44 | 2.03 | 50.33 | 3.40 | 2.12 |
| 4 | Plant Height (cm) | 143.07-184.24 | 6.96 | 9.20 | 57.34 | 17.88 | 10.87 |
| 5 | Number of Primary Branches | 29.20-42.62 | 10.28 | 11.66 | 77.77 | 7.17 | 18.69 |
| 6 | Number of Umbels Per Plant | 22.29-29.75 | 9.12 | 10.65 | 73.33 | 4.23 | 16.09 |
| 7 | Number of Umbellets Per Umbel | 44.17-47.02 | 1.49 | 2.55 | 34.42 | 0.82 | 1.81 |
| 8 | Number of Seeds Per Umbel | 278.47-304.12 | 3.13 | 3.90 | 64.42 | 15.09 | 5.18 |
| 9 | Seed Yield Per Plant (g/plant) | 25.12-29.96 | 6.09 | 6.41 | 90.27 | 3.27 | 11.92 |
| 10 | Seed Yield Per Hectare (q/ha) | 7.48-10.57 | 12.46 | 13.29 | 87.95 | 2.06 | 24.08 |
| 11 | Seed Index (g) | 4.84-5.84 | 4.44 | 6.68 | 44.07 | 0.31 | 6.07 |
| 12 | Harvest Index (%) | 25.00-36.38 | 9.58 | 11.39 | 70.69 | 4.96 | 16.59 |
Table text extracted from the original PDF; superscript letters are shown inline. The original table image is below.
View original table image
| Characters | DG | DF50 | DM | PH (cm) | NPB | NUPP | NUPU | NSPU | SYPH (q/ha) | SI (g) | HI (%) | SYPP(g) |
|---|---|---|---|---|---|---|---|---|---|---|---|---|
| DG | 1.000 | -0.068 | -0.270 | -0.471* | -0.222 | 0.282 | 0.282 | -0.154 | 0.379* | 0.260 | -0.037 | 0.152 |
| DF50 | -0.328 | 1.000 | 0.023 | 0.411* | 0.070 | 0.224 | -0.132 | -0.002 | -0.100 | 0.368* | 0.256 | 0.131 |
| DM | -0.472* | 0.276 | 1.000 | 0.2499 | -0.030 | -0.033 | -0.295 | -0.103 | -0.252 | -0.177 | 0.218 | -0.152 |
| PH (cm) | -0.528* | 0.785** | 0.252 | 1.000 | 0.449* | 0.071 | -0.146 | 0.249 | -0.311 | 0.131 | 0.034 | -0.201 |
| NPB | -0.387* | 0.240 | -0.197 | 0.638** | 1.000 | 0.542* | 0.079 | 0.640** | 0.081 | 0.205 | 0.036 | -0.045 |
| NUPP | 0.336 | 0.300 | -0.277 | 0.185 | 0.655** | 1.000 | 0.288 | 0.564* | 0.531* | 0.435* | 0.127 | 0.519* |
| NUPU | 0.384* | 0.015 | -0.966** | -0.353 | 0.021 | 0481* | 1.000 | 0.305 | 0.522* | 0.159 | -0.087 | 0.558* |
| NSPU | 0.038 | 0.084 | -0.023 | 0.406* | 0.715** | 0.881* | 0.520* | 1.000 | 0.296 | 0.246 | -0.281 | 0.372* |
| SYPH (q/ha) | 0.569* | -0.167 | -0.356 | -0.439* | 0.142 | 0.657* | 0.924** | 0.416* | 1.000 | 0.429* | 0.183 | 0.773** |
| SI (g) | 0.185 | 0.519* | -0.570 | 0.227 | 0.413* | 0.663** | 0.888** | 0.722** | 0.722** | 1.000 | 0.101 | 0.445* |
| HI (%) | 0.107 | 0.431* | 0.133 | -0.263 | -0.050 | 0.082 | -0.202 | -0.573** | 0.304 | 0.149 | 1.000 | 0.063 |
| SYPP (g) | 0.311 | 0.126 | -0.205 | -0.244 | -0.010 | 0.607** | 0.824** | 0.484* | 0.836** | 0.709** | 0.067 | 1.000 |
Table text extracted from the original PDF; superscript letters are shown inline. The original table image is below.
View original table image
| Characters | DG | DF50 | DM | PH (cm) | NPB | NUPP | NUPU | NSPU | SYPH (q/ha) | SI (g) | HI (%) |
|---|---|---|---|---|---|---|---|---|---|---|---|
| DG | -0.296 | 0.020 | 0.080 | 0.139 | 0.066 | -0.083 | -0.025 | 0.045 | -0.112 | -0.077 | 0.011 |
| DF50 | -0.010 | 0.148 | 0.003 | 0.060 | 0.010 | 0.033 | -0.019 | 0.000 | -0.014 | 0.054 | 0.038 |
| DM | -0.006 | 0.001 | 0.025 | 0.006 | -0.001 | -0.001 | -0.007 | -0.002 | -0.006 | -0.004 | 0.005 |
| PH (cm) | 0.043 | -0.037 | -0.023 | -0.092 | -0.041 | -0.006 | 0.013 | -0.023 | 0.028 | -0.012 | -0.017 |
| NPB | 0.108 | -0.034 | 0.015 | -0.218 | -0.488 | -0.264 | -0.038 | -0.312 | -0.040 | -0.100 | -0.017 |
| NUPP | 0.094 | 0.0748 | -0.011 | 0.023 | 0.180 | 0.333 | 0.096 | 0.182 | 0.177 | 0.145 | 0.042 |
| NUPU | 0.014 | -0.021 | -0.048 | -0.023 | 0.013 | 0.046 | 0.162 | 0.049 | 0.085 | 0.025 | -0.014 |
| NSPU | -0.034 | 0.000 | -0.023 | 0.056 | 0.145 | 0.123 | 0.069 | 0.226 | 0.067 | 0.055 | -0.063 |
| SYPH (q/ha) | 0.205 | -0.054 | -0.136 | -0.168 | 0.044 | 0.287 | 0.282 | 0.160 | 0.541 | 0.232 | 0.099 |
| SI (g) | 0.033 | 0.048 | -0.023 | 0.017 | 0.026 | 0.056 | 0.020 | 0.032 | 0.056 | 0.130 | 0.013 |
| HI (%) | 0.001 | -0.012 | -0.010 | -0.001 | -0.001 | -0.006 | 0.004 | 0.013 | -0.008 | -0.004 | -0.0474 |
| SYPP (g) | 0.152 | 0.131 | -0.152 | -0.201 | -0.045 | 0.51* | 0.558* | 0.372* | 0.773** | 0.445* | 0.063 |
Table text extracted from the original PDF; superscript letters are shown inline. The original table image is below.
View original table image
| Characters | DG | DF50 | DM | PH (cm) | NPB | NUPP | NUPU | NSPU | SYPH (q/ha) | SI (g) | HI (%) |
|---|---|---|---|---|---|---|---|---|---|---|---|
| DG | 0.7442 | -0.244 | -0.351 | -0.393 | -0.287 | 0.250 | 0.285 | 0.028 | 0.423 | 0.137 | 0.079 |
| DF50 | 0.135 | -0.413 | -0.114 | -0.324 | -0.099 | -0.124 | -0.006 | -0.035 | 0.069 | -0.214 | -0.177 |
| DM | -0.288 | 0.169 | 0.611 | 0.154 | -0.120 | -0.169 | -0.590 | -0.014 | -0.217 | -0.348 | 0.081 |
| PH (cm) | 0.899 | -1.337 | -0.430 | -1.702 | -1.086 | -0.315 | 0.601 | -0.691 | 0.747 | -0.387 | 0.448 |
| NPB | -0.106 | 0.066 | -0.054 | 0.176 | 0.276 | 0.180 | 0.006 | 0.197 | 0.039 | 0.114 | -0.014 |
| NUPP | -0.428 | -0.383 | 0.354 | -0.236 | -0.835 | -1.275 | -0.613 | -1.123 | -0.837 | -0.845 | -0.105 |
| NUPU | -0.082 | -0.003 | 0.208 | 0.076 | -0.004 | -0.103 | -0.215 | -0.111 | -0.221 | -0.277 | 0.043 |
| NSPU | 0.084 | 0.185 | -0.052 | 0.892 | 1.570 | 1.934 | 1.141 | 2.196 | 0.913 | 1.526 | -1.258 |
| SYPH (q/ha) | -1.203 | 0.354 | 0.753 | 0.928 | -0.300 | -1.388 | -2.170 | -0.879 | -2.115 | -1.526 | -0.064 |
| SI (g) | 0.422 | 1.183 | -1.299 | 0.519 | 0.942 | 1.512 | 2.941 | 1.647 | 1.646 | 2.281 | -0.341 |
| HI (%) | 0.136 | 0.548 | 0.169 | -0.335 | -0.064 | 0.105 | -0.257 | -0.729 | 0.387 | 0.190 | 1.273 |
| SYPP (g) | 0.311 | 0.126 | -0.205 | -0.244 | -0.010 | 0.607** | 1.121 | 0.484* | 0.836** | 0.709** | 0.067 |
Table text extracted from the original PDF; superscript letters are shown inline. The original table image is below.
View original table image
| Varieties | Source |
|---|---|
| Ajmer fennel - 1 | NRCSS, Ajmer |
| Ajmer fennel - 2 | NRCSS, Ajmer |
| Sugandha – 111 | Ratan Seed Company, Ajmer |
| Gujarat fennel – 1 | Ratan Seed Company, Ajmer |
| Surbhi | Pruthvi Hybrid Seeds pvt. Ltd. Ahmedabad |
| Sonata | Nissan Seeds pvt. Ltd Ahmedabad |
| Suhana | Uma Seeds Corporation, Gandhinagar |
| Avani - dona | Avani Seeds pvt. Ltd Gujarat |
| Hara sona | Ved Seed, Ajmer |
| Kalyan | Bharat Krishi Kendra, Ajmer |
Table text extracted from the original PDF; superscript letters are shown inline. The original table image is below.
View original table image
References
19 in the original paper- Alam K, Chaterjee R, Pariari A, Sharangi AB. Evaluation of fennel (Foeniculum vulgare Mill.) germplasm for growth and yield. Environment and Ecology. 2003;21(2):477-479.
- Al-Jibouri HA, Miller HA, Robinson HF. Genotypic and environmental variances and co-variances in upland cotton crosses of interspecific origin. Journal of Agronomy. 1958;50:633-636.
- Allard RW. Relationship between Relationship between genetic diversity and consistency of performance in different environment. Crop Science. 1960;1:127-132.
- Burton GW, Devane EM. Estimation of heritability in tall fescus (Festuca arundinacea) from replicated clonal material. Agronomy Journal. 1953;45:478-480.
- Das TR, Barua PK. Association Studies for Yield and its components in Green Gram. International Journal of Agriculture, Environment and Biotechnology. 2015;8(3):561-565.
- FAOSTAT. www.fao.org/faostat/en/data/CC. Food Supply-Crops Primary Equivalent. Visited on 15/12/2021; c2020.
- Jaydev S, Pandey VP, Singh D, Pattnaik M. Genetic variability studies in fennel (Foeniculum vulgare L.). The Pharma Innovation Journal. 2020;9(4):160-164.
- Johnson HW, Robinson HF, Comstock RE. Estimate of genetic and environmental variability in soyabean. Agronomy Journal. 1955;47:314-318.
- Karpechenko GD. Chromosomes of phaseoline. Bulletin Application of Botany. 1925;14:143-148.
- Lal RK. Associations among agronomic trails and path analysis in fennel (Foeniculum vulgare Mill.). Journal of Sustainable Agriculture. 2007;30(1):21-29.
- Mansholt UJ. Peach plant cultivation. Contribution to the knowledge of Dutch agriculture. 1909;3:228.
- Mohan C, Singh JP, Kumar S, Puri A. Studies on Character Association in Fennel (Foeniculum vulgarae Mill.) International Journal of Plant & Soil Science. 2017;14(6):1-5,
- Patel DG, Patel HB, Chauhan S, Patel AM. Genetic Variability Study in Fennel (Foeniculum valgarae Mill). International Journal of Current Microbiology and Applied Science. 2018;7(11):2403-2406.
- Rohit K, Meena RS, Verma AK, Hemant A, Panwar A. Analysis of Genetic Variability and Correlation in Fennel (Foeniculum Vulgare Mill.) Germplasm. Agricultural Research & Technology: Open Access Journal. 2018;3(4):125-128.
- Rajput SS, Sharma SK, Varsha K, Kunwar R, Kumawat GL, Yadav GL et al. Studies on genetic variability parameters and character association in fennel (Foeniculum vulgare Mill.) under semiarid conditions of Rajasthan. The Pharma Innovation Journal. 2022;11(4):1828-1833.
- Sengupta SK, Verma BK, Naidu AK. Genetic variability study in fennel (Foeniculum valgare Mill). International Science Journal. 2014;1(1):62-64.
- Vavilov NI. Origin and geography of cultivated plants. Archives of natural history. 2014;21(1):142.
- Wright S. Systems of mating. I. The biometric relations between parent and offspring. Genetics. 1921 Mar;6(2):111.
- Dewey DR, Lu K. A correlation and path-coefficient analysis of components of crested wheatgrass seed production 1. Agronomy journal. 1959 Sep;51(9):5158.
Cited by 1
From OpenAlex, OpenCitations and reference lists read by Scinovex
- Evaluation on mean performance of yield and its attributing characters in germplasm of fennel (Foeniculum vulgare Mill.)
Shivam Shivam, CN Ram, Achla Suman, Rajneesh Kumar, Lokesh Yadav, Sonal Sabara · International Journal of Research in Agronomy · 2024
The present study was conducted at the College of Horticulture and Forestry, Acharya Narendra Deva University of Agriculture & Technology, Kumarganj, Ayodhya during the rabi season of 2022-23. Plant material consisted of 57 genotypes of fennel including 2 check varieties NDF-1 (A.N.D.U.A.T, Kumarganj, Ayodhya) and RF-101 (SKNAU, Jobner, Rajasthan). The experiment was conducted in Augmented Block Design of 2x1.2m2 plot size with 40x60cm2 spacing. The assessment covered various characteristics related to both crop productivity and quality. Among the test entries, the wide variations in mean perf