
Research article · 2022 · Full text
International Journal of Agriculture Extension and Social DevelopmentCocoa enterprises in Ondo state: Farmers/buyers perception of involvement and constraints
Volume 5(2) · Pages 58–61 · DOI: 10.33545/26180723.2022.v5.i2a.157 ↗
Research areasLivestock and Poultry ManagementCocoa and Sweet Potato AgronomyAgriculture and Rural Development Research
Abstract
Author-writtenCocoa enterprise is very critical as a source of livelihood of the people in the rural areas of the region where it is produced as it accounts for a high proportion of the household income. Cocoa production in Nigeria is essentially on a small-scale level and is mainly produced in Ekiti, Ondo, Osun, Oyo and Ogun. Over 50% of the total quantity of cocoa produced for export or utilized locally per annum are from Ondo State. Of the global production, Africa production of cocoa beans has declined from 71.8% in 2007/2008 to 68% in 2009/2010. This study focuses on cocoa enterprises in ondo state, farmers/buyers perception of involvement in the enterprise as well as the constraints faced by them. Results show that that majority of the respondents had at least basic primary education as advocated by UNESCO. Cocoa farmers/buyers are of the perception that people see cocoa entrepreneur as well to do and have a lucrative business, they do not agree that cocoa entrepreneurs are better to do than their counterparts in other enterprises. There is an engagement in non-farm occupations by many of the farmers which serves as a means to augment their means of welfare. A larger proportion (89.3%) of the respondents indicated weather and climate variability, limited selling opportunities, lack of processing facilities international market fluctuations as major constraint faced by the enterprise.
Summary
Source-checkedPlain-language reading of the full paper, prepared with AI and checked against the text. Each point links to the authors' own words.
Why it matters
- Cocoa enterprises are vital for rural livelihoods in their production regions because they provide a significant portion of household income. View evidence ↗
- Ondo State is a primary hub for Nigerian cocoa, producing more than 50% of the country's annual cocoa for local use and export. View evidence ↗
- Nigerian cocoa production has declined due to factors including climate change, aging plantations, natural soil degradation, and a shift in focus toward oil exploitation. View evidence ↗
The question
- The study aims to identify the constraints facing cocoa enterprises in Ondo State and understand how farmers and buyers perceive their involvement in the business. View evidence ↗
What they did
- The researchers used stratified sampling to divide the 18 local government areas of Ondo State into cocoa-producing and less cocoa-producing categories. View evidence ↗
- The study analyzed data from a total sample size of 142 respondents, consisting of registered farmers and buyers. View evidence ↗
- The analysis considered several socioeconomic variables of the entrepreneurs, including their age, education, occupation, and household size. View evidence ↗
What they found
- Most respondents had at least a basic education, with 47.2% having secondary education, 38.0% primary, and 14.8% tertiary education. View evidence ↗
- Farming was the primary occupation for 72.5% of the respondents, while 27.5% were primarily traders. View evidence ↗
- A significant portion of the participants (72.5%) engaged in trading as a secondary occupation to supplement their income. View evidence ↗
- Despite the business being seen as lucrative, 62% of respondents held an unfavorable perception toward involvement in cocoa enterprises, compared to 38% with a favorable perception. View evidence ↗
- Weather and climate variability were identified as a major constraint by 89.3% of the respondents. View evidence ↗
- Major constraints included a lack of processing facilities (99.3%), limited selling opportunities (85.9%), and international market fluctuations (60.6%). View evidence ↗
- The perceived level of constraints was split nearly evenly, with 50.7% of respondents reporting a low level of constraints and 49.3% reporting a high level. View evidence ↗
What it means
- The authors recommend that the government subsidize production inputs and that financial institutions improve loan accessibility for cocoa farmers and buyers. View evidence ↗
Visual summary
3 visualsIllustrations explain the paper; charts are replotted from the paper's own table values.
Constraints to Cocoa Production
AI-generated conceptual illustration (Cocoa pods and beans in a farm setting). It explains the idea and does not show study data.
View source evidence ↗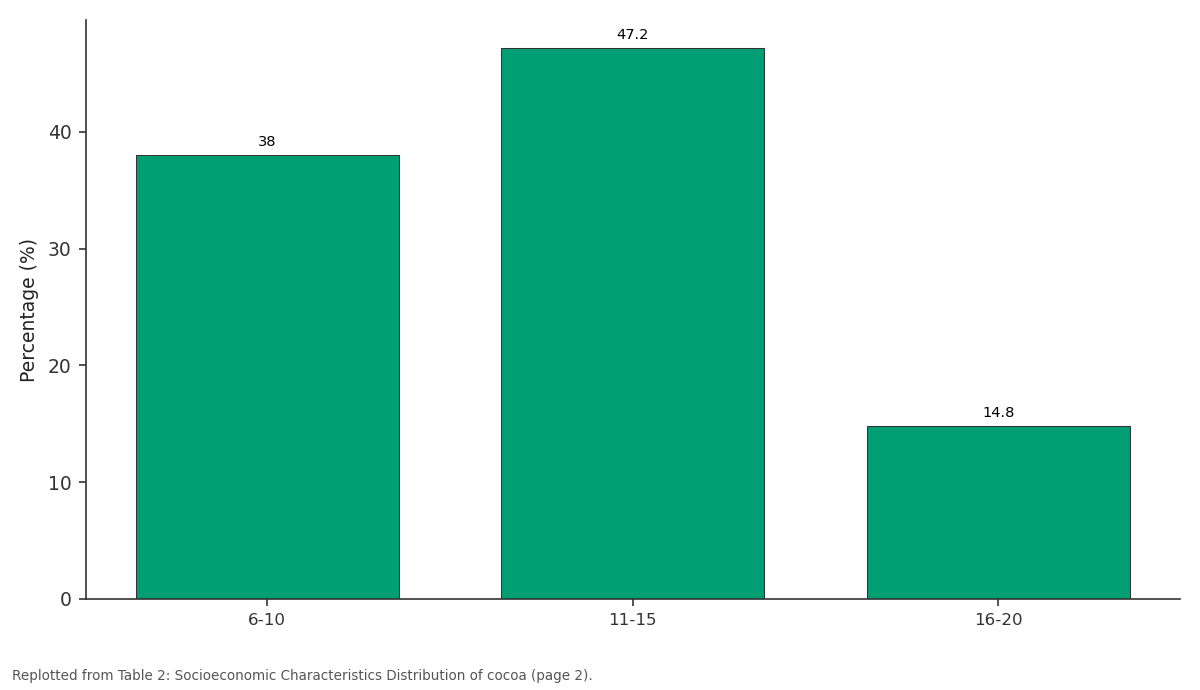
Percentage (%): 6-10 vs 11-15 vs 16-20
Replotted from Table 2 (page 2) of the original paper. Every bar is the paper's own table value.
View source evidence ↗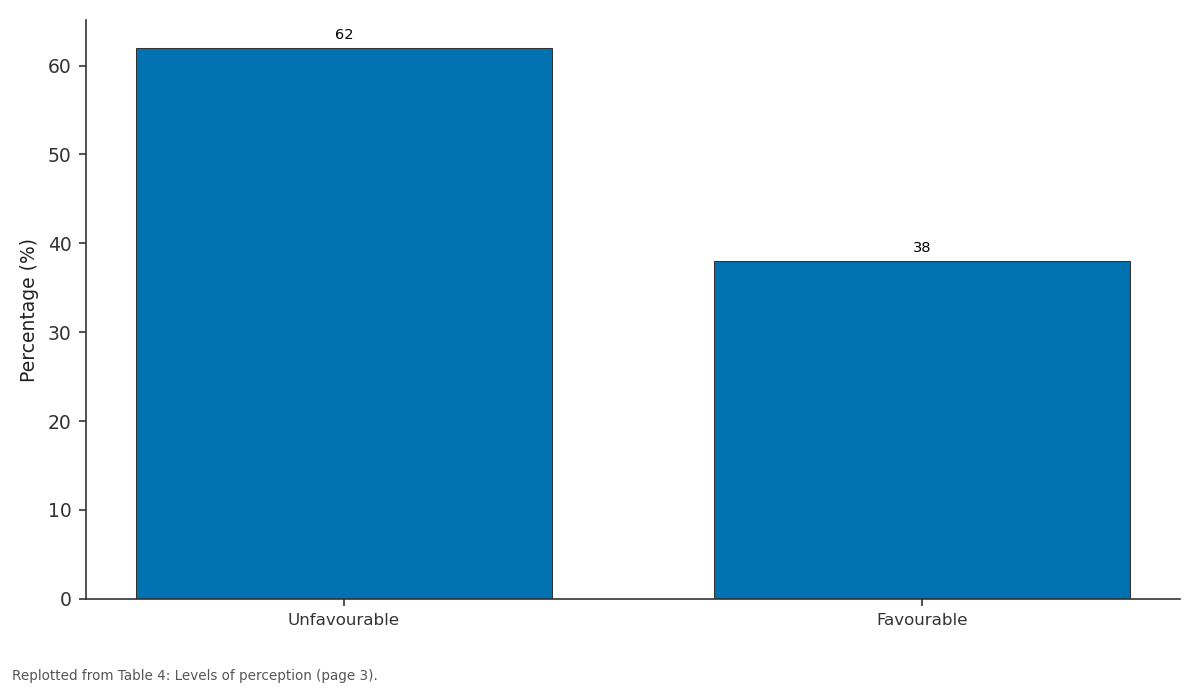
Percentage (%): Unfavourable vs Favourable
Replotted from Table 4 (page 3) of the original paper. Every bar is the paper's own table value.
View source evidence ↗Figures & tables
From the original paper Table 1
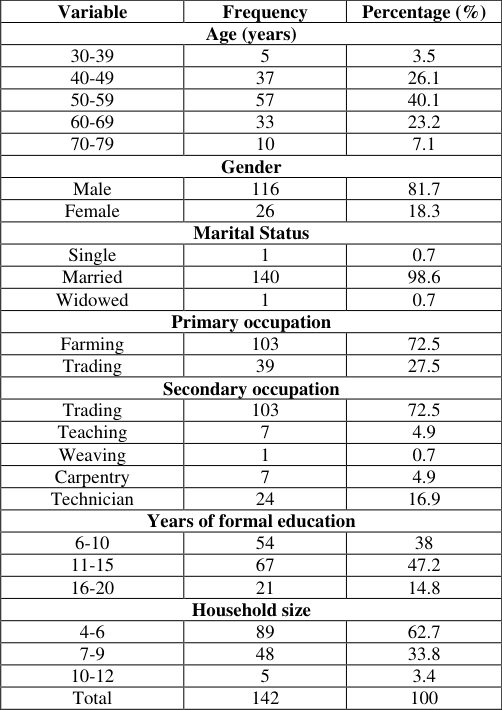 Table 2
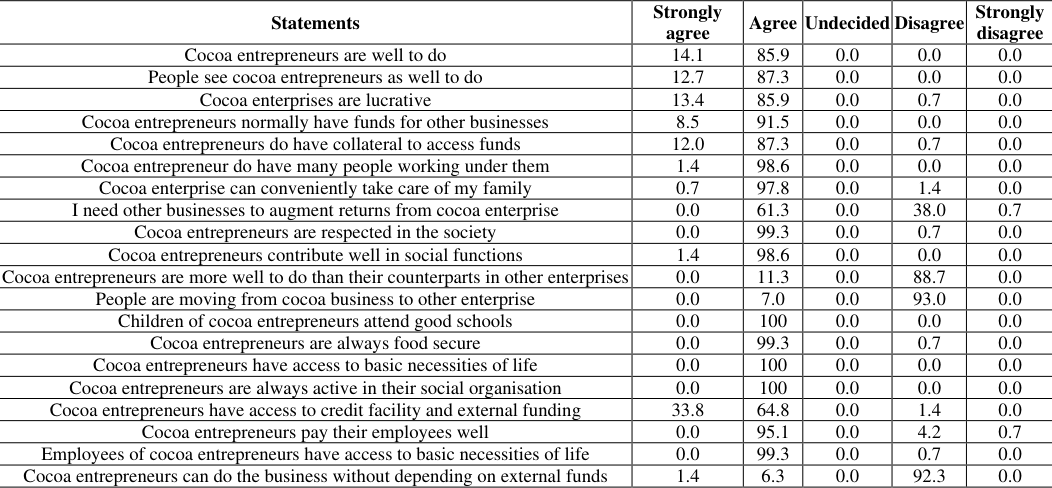 Table 3
 Table 4
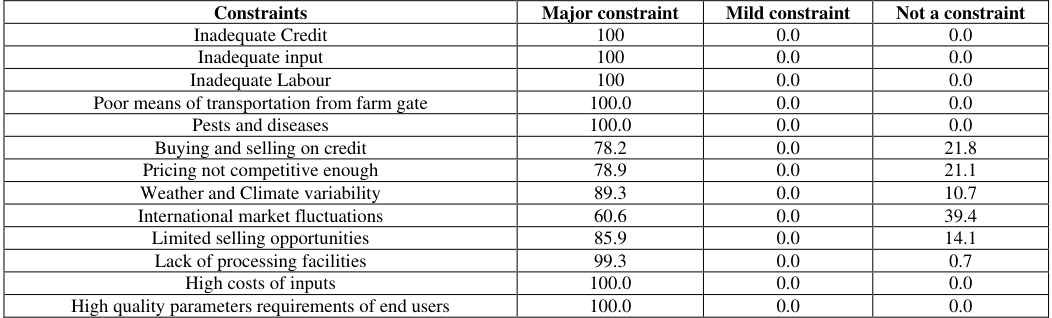 Table 5
 Table 6
Introduction
Nigeria is the world's fourth largest cocoa producer annual yield of 427800MT after Cote d'ivoire, Indonesia and Ghana with annual yield of 1,242,300MT, 810,100MT and 632,037 respectively and the third largest exporter after Côte d'Ivoire and Ghana (FAOSTAT,2005, Verter and Bečvářová, 2014) [2,8] . The Nigerian cocoa economy has a rich history which is well documented in literature. In terms of foreign exchange earnings, no single agricultural export commodity has earned more than cocoa (Nkang et al., 2009) [5] . Cocoa is a major export crop with revenue of at least 34 billion derived annually from the export of cocoa beans alone, besides revenue from cocoa by-products like butter, cake, liquor and powder (Akinwale, 2006; Ibiremo et al., 2011) [1,3] . In the southern belt of Nigeria cocoa is widely cultivated, owing to the soil and climatic conditions prevailing in the area. The top growing States Ondo, Ogun, Osun Oyo and Ekiti account for about 60% of the cocoa production and make up at least 30% of the total cocoa export in Nigeria. Others are Cross River, Edo, Abia, Kwara, Kogi, Adamawa, and Akwa Ibom. But Nigerian Bureau of Statistic (2013) [4] identified eighteen cocoa producing States in Nigeria. Therefore in addition to the aforesaid States, others are Taraba, Delta, Lagos, Bayelsa, River and Imo States In terms of capacity, Ondo State is rated as the largest cocoa producing state in Nigeria (Oluyole, 2018) [6] . Cocoa production in Nigeria is undertaken typically by poor, small scale and low technical farmers that neither use fertilizer nor manure for soil fertility improvement. These farmers therefore face challenges in setting up new cocoa farms and restoration of old ones. Meanwhile, high levels of yield loss to pests and disease is a major problem for world cocoa production. According to PwC (2016) [7] , Nigeria's output in cocoa production declined by 37.9 per cent between 2010 and 2014. However, Nigeria has been lagging behind and struggling to retain the fourth position in global cocoa production since 2014. Declined agricultural productivity due to oil discovery in Nigeria has drastically reduced the volume of agricultural products and revenue from cash crops over the years. Problems militating against cocoa production and enterprises in Nigeria that caused this decline are climate change, aging of plantation, soil nutrient degradation (natural) and negligence of agricultural sector in favour of oil exploitation amongst others. This study aims to reveal further constraints to cocoa enterprises and farmers/buyers perception of involvement in cocoa enterprises in ondo state.
Methodology
The population of study comprises of the farmers and buyers involved in cocoa enterprises in the study area. Stratified sampling technique was used to select respondents from the population of farmers and buyers in the study area. The cocoa producing LGA's are: Idanre, Owo, Ile Oluji, Ondo-west and Odigbo.
Stage 2: Forty percent (40%) of the cocoa producing LGA's were then selected using simple random sampling technique giving just two LGAs.
Stage 3: Forty percent (40%) of the registered farmers obtained from the produce office while 25% of registered buyers of the Cocoa Association of Nigeria were sampled as follows:
Data Analysis 3.1 Socioeconomic characteristics of the respondents
The socioeconomic characteristics of the cocoa entrepreneurs that were considered in the study include age, religion, marital status, household size, education, occupation, and income. The results on Table 1 show the distribution of the respondents according to the variables.
| Local Government | No of Registered cocoa farmers | Selection of 25% | No of Registered buyers | Selection of 25% |
|---|---|---|---|---|
| Ile Oluji | 220 | 55 | 80 | 20 |
| Ondo West | 184 | 48 | 76 | 19 |
| Total | 404 | 103 | 156 | 39 |
Table text extracted from the original PDF; superscript letters are shown inline. The original table image is below.
View original table image
Age
The distribution of the respondents by age as shown in Table 2 reveals that a highest proportion of respondents (40.1%) were between the age group of 50 and 59 years. While just 3.5% and 7.1% are between the age categories of 30 to 39yrs and 70 to 79yrs respectively, 26.1% and 23.2% fall between the age groups 40 to 49yrs and 60 to 69yrs respectively. Further analysis of this data shows that 97.5% of the respondents are between the age categories of between 40 and 79. This shows the predominance middle aged and adult in this agricultural enterprise. That youth are not as much involved in agricultural production.
| Variable | Frequency | Percentage (%) |
|---|---|---|
| Age (years) | ||
| 30-39 | 5 | 3.5 |
| 40-49 | 37 | 26.1 |
| 50-59 | 57 | 40.1 |
| 60-69 | 33 | 23.2 |
| 70-79 | 10 | 7.1 |
| Gender | ||
| Male | 116 | 81.7 |
| Female | 26 | 18.3 |
| Marital Status | ||
| Single | 1 | 0.7 |
| Married | 140 | 98.6 |
| Widowed | 1 | 0.7 |
| Primary occupation | ||
| Farming | 103 | 72.5 |
| Trading | 39 | 27.5 |
| Secondary occupation | ||
| Trading | 103 | 72.5 |
| Teaching | 7 | 4.9 |
| Weaving | 1 | 0.7 |
| Carpentry | 7 | 4.9 |
| Technician | 24 | 16.9 |
| Years of formal education | ||
| 6-10 | 54 | 38 |
| 11-15 | 67 | 47.2 |
| 16-20 | 21 | 14.8 |
| Household size | ||
| 4-6 | 89 | 62.7 |
| 7-9 | 48 | 33.8 |
| 10-12 | 5 | 3.4 |
| Total | 142 | 100 |
Table text extracted from the original PDF; superscript letters are shown inline. The original table image is below.
View original table image
Marital status
Most of the respondents (98.6%) were married with just 0.7% being single and widowed respectively. This indicates that majority of the respondents have dependants relying on them for means of existence which in turn will have impact on their welfare. Another dimension to the issue of marital status is access to resources especially in the case of women, which will in turn affect their welfare.
Occupation
The result on table 2 shows that 72.5% of the respondents indicated farming as their primary occupation while 27.5% of the respondents were primarily traders. While secondary occupation distribution of respondents reveals that 72.5% of the respondents indicated trading as their secondary occupation. Findings also revealed that 4.9% of the respondents each indicated teaching and carpentry as their secondary occupation while 0.7% and 16.9% have weaving and being technician respectively as their secondary occupation. These findings therefore show that agriculture is a major source of livelihood in the area. Agricultural policies favourable to agricultural development are therefore essential. Engagement in non-farm occupations by many of the farmers could therefore be seen as a means to augment their means of welfare.
Years of formal education
Table 2 reveals that a higher proportion of the respondents (47.2%) have secondary education. While 38.0% possess just the primary education, 14.8% of the respondents have tertiary education.
Household size
According to Table 1, 62.7% of the respondents have a household size of between 4 and 6. While just 33.8% has a household size of between 7-9, just 3.4% of the respondents have 10 to12 people in their households. Since the household size determines the per capita expenditure of the household, it will in turn affect the welfare of the family.
Perception of involvement in cocoa enterprises
The results in table 3 shows that Cocoa farmers/buyers are of the perception that people see cocoa entrepreneur as well to do and have a lucrative business, they main reason higher percentage disagree that people are moving from cocoa business to other business. They do not agree that cocoa entrepreneurs are better to do than their counterparts in other enterprises. There is an engagement in non-farm occupations by many of the farmers which serves as a means to augment their means of welfare. Result in Table 4 reveals that 62% of the respondents have unfavourable perception while 38% have a favourable or positive perception towards involvement in cocoa enterprises. This is inconsistent with the general favourable perception that cocoa entrepreneurs are involved in a lucrative business. Source: Field Survey (2013)
| Level | Frequency | Percentage (%) |
|---|---|---|
| Unfavourable | 88 | 62 |
| Favourable | 54 | 38 |
| Total | 142 | 100 |
Table text extracted from the original PDF; superscript letters are shown inline. The original table image is below.
View original table image
| Statements | Strongly agree | Agree | Undecided | Disagree | Strongly disagree |
|---|---|---|---|---|---|
| Cocoa entrepreneurs are well to do | 14.1 | 85.9 | 0.0 | 0.0 | 0.0 |
| People see cocoa entrepreneurs as well to do | 12.7 | 87.3 | 0.0 | 0.0 | 0.0 |
| Cocoa enterprises are lucrative | 13.4 | 85.9 | 0.0 | 0.7 | 0.0 |
| Cocoa entrepreneurs normally have funds for other businesses | 8.5 | 91.5 | 0.0 | 0.0 | 0.0 |
| Cocoa entrepreneurs do have collateral to access funds | 12.0 | 87.3 | 0.0 | 0.7 | 0.0 |
| Cocoa entrepreneur do have many people working under them | 1.4 | 98.6 | 0.0 | 0.0 | 0.0 |
| Cocoa enterprise can conveniently take care of my family | 0.7 | 97.8 | 0.0 | 1.4 | 0.0 |
| I need other businesses to augment returns from cocoa enterprise | 0.0 | 61.3 | 0.0 | 38.0 | 0.7 |
| Cocoa entrepreneurs are respected in the society | 0.0 | 99.3 | 0.0 | 0.7 | 0.0 |
| Cocoa entrepreneurs contribute well in social functions | 1.4 | 98.6 | 0.0 | 0.0 | 0.0 |
| Cocoa entrepreneurs are more well to do than their counterparts in other enterprises | 0.0 | 11.3 | 0.0 | 88.7 | 0.0 |
| People are moving from cocoa business to other enterprise | 0.0 | 7.0 | 0.0 | 93.0 | 0.0 |
| Children of cocoa entrepreneurs attend good schools | 0.0 | 100 | 0.0 | 0.0 | 0.0 |
| Cocoa entrepreneurs are always food secure | 0.0 | 99.3 | 0.0 | 0.7 | 0.0 |
| Cocoa entrepreneurs have access to basic necessities of life | 0.0 | 100 | 0.0 | 0.0 | 0.0 |
| Cocoa entrepreneurs are always active in their social organisation | 0.0 | 100 | 0.0 | 0.0 | 0.0 |
| Cocoa entrepreneurs have access to credit facility and external funding | 33.8 | 64.8 | 0.0 | 1.4 | 0.0 |
| Cocoa entrepreneurs pay their employees well | 0.0 | 95.1 | 0.0 | 4.2 | 0.7 |
| Employees of cocoa entrepreneurs have access to basic necessities of life | 0.0 | 99.3 | 0.0 | 0.7 | 0.0 |
| Cocoa entrepreneurs can do the business without depending on external funds | 1.4 | 6.3 | 0.0 | 92.3 | 0.0 |
Table text extracted from the original PDF; superscript letters are shown inline. The original table image is below.
View original table image
Constraints to cocoa enterprises
The distribution of respondents according to the constraints encountered in cocoa enterprises is shown in Table 4. All the respondents indicated inadequate credit, inadequate input, inadequate labour, poor means of transportation from farm gate and pests and diseases as major constraints.
In the case of buying and selling on credit as a constraint, 78.2% of the respondents indicated it as a major constraint while 21.8% do not see it as a constraint. Also for price not being competitive, 78.9% said it is a major constraint while 21.9% of them indicated it as not being a constraint. A larger proportion (89.3%) of the respondents also indicated weather and climate variability as a major constraint. Whereas 60.6%, 85.9% and 99.3% of the respondents indicated international market fluctuations, limited selling opportunities and lack of processing facilities respectively as major constraints, all the respondents admitted that high costs of inputs and high quality parameters required by end users are also major constraints. Source: Field Survey (2018)
Table 5 shows the distribution of respondents based on constraints encountered in their enterprise and level of constraints respectively. 50.7% of the respondents' level of facing the constraints is low while 49.3% of the respondent's level of facing constraint is high.
| Constraints | Major constraint | Mild constraint | Not a constraint |
|---|---|---|---|
| Inadequate Credit | 100 | 0.0 | 0.0 |
| Inadequate input | 100 | 0.0 | 0.0 |
| Inadequate Labour | 100 | 0.0 | 0.0 |
| Poor means of transportation from farm gate | 100.0 | 0.0 | 0.0 |
| Pests and diseases | 100.0 | 0.0 | 0.0 |
| Buying and selling on credit | 78.2 | 0.0 | 21.8 |
| Pricing not competitive enough | 78.9 | 0.0 | 21.1 |
| Weather and Climate variability | 89.3 | 0.0 | 10.7 |
| International market fluctuations | 60.6 | 0.0 | 39.4 |
| Limited selling opportunities | 85.9 | 0.0 | 14.1 |
| Lack of processing facilities | 99.3 | 0.0 | 0.7 |
| High costs of inputs | 100.0 | 0.0 | 0.0 |
| High quality parameters requirements of end users | 100.0 | 0.0 | 0.0 |
Table text extracted from the original PDF; superscript letters are shown inline. The original table image is below.
View original table image
Conclusion
The trend pattern of cocoa production in Nigeria has been fluctuating since 1970. Exportation is geometrically increasing while local processing is gradually dwindling.
Farmers and buyers from the study area yearn for a need to add other businesses to cocoa enterprise in other to augment returns from cocoa enterprise. Cocoa entrepreneurs in the study area disagree that they are better to do than their counterparts in other enterprises although they are food secure. They opined that Cocoa entrepreneurs cannot do the business without depending on external funds when inadequate credit, inadequate/high cost of input, inadequate labour, poor means of transportation from farm gate and pests and diseases are major constraints to the enterprise. This study hereby recommends that Government should subsidize input used in production and financial organization should make accessibility to loans easier for both the farmers and buyers.
Figures and tables from the paper
| Level | Frequency | Percentage |
|---|---|---|
| Low | 72 | 50.7 |
| High | 70 | 49.3 |
| Total | 142 | 100 |
Table text extracted from the original PDF; superscript letters are shown inline. The original table image is below.
View original table image
References
6 in the original paper- Akinwale O. Prospects and challenges in local production of cocoa as raw materials in Nigeria. Cocoa Mirror. 2006;1:9-11.
- FAOSTAT. Food and Agriculture Organization statistics: fao.com//faostat; Retrieved 12 th Dec 2012, 9 pm; c2005.
- Ibiremo OS, Daniel MA, Iremiren GO, Fagbola O. Soil fertility evaluation for cocoa production in South Eastern Adamawa State, Nigeria. World Journal of Agricultural Sciences. 2011;7(2):218-223.
- Nkang NM, Ajah EA, Abang SO, Edet EO. Investment in cocoa production in Nigeria: A cost and return analysis of three cocoa production management systems in the Cross River State cocoa belt. African Journal of Food, Agriculture, Nutrition and Development. 2009;9(2):713-27.
- Oluyole KA. Competitiveness and Comparative Advantage of Cocoa Production in Southwestern: A Policy Analysis Approach, Universal Journal of Agricultural Research. 2018;6(2):57-61.
- Verter N, Bečvářová V. Analysis of Some Drivers of Cocoa Export in Nigeria in the Era of Trade Liberalization, Economics & Informatics. 2014;6(4):208-218.