
Research article · 2023 · Full text
International Journal of Agriculture Extension and Social DevelopmentImpact of COVID-19 restrictions on livelihood and activities of postharvest value chain actors in Nigeria
Volume 6(1) · Pages 71–77 · DOI: 10.33545/26180723.2023.v6.i1b.151 ↗
Research areasCOVID-19 Pandemic Impacts
Abstract
Author-writtenNigeria’s first case of the highly communicable and deadly disease COVID-19 was formally documented in February 2020. The Federal Government of Nigeria thus introduced restrictions as control measures because at the time no vaccines or definite treatment existed. Fundamentally, this investigation was borne out of the assumption that postharvest value chain actors experienced disruptions which are fall outs of the restrictions. A cross sectional research design with a micro approach estimation methodology was used in 18 states across the 6 geopolitical zones. Data were obtained through questionnaire and interview guide, key informant interview, and focus group discussions (FGDs). A multi-stage sampling procedure was used to select respondents. Firstly, 16 states with high incidence of COVID-19 with formal restriction were purposively selected. Secondly, 6 key agricultural commodities in terms of their widespread trade and consumption were selected. Lastly, respondents were randomly selected from a pre-determined list obtained from Agricultural Development Programmes (ADPs) of the selected states, and relevant associations. A total of 96,000 respondents were sampled across 5 postharvest value chain actors. Data components were analyzed using both descriptive and inferential statistics. Results revealed that restriction environment was detrimental to output, access to market, food demand and supply, food prices, finance, labour demand and supply, sources of inputs, standard of living, and postharvest activities in general. Finally, the restrictions should not be seen in the light of negativities only, for it brought about increased intimacy among family members among others.
Summary
Source-checkedPlain-language reading of the full paper, prepared with AI and checked against the text. Each point links to the authors' own words.
Why it matters
- Nigeria's food system was already under pressure from drought, flooding, and insecurity before the COVID-19 pandemic began. View evidence ↗
- To contain the spread of COVID-19, the Nigerian government implemented restrictions on movement, time, and large gatherings. View evidence ↗
- The pandemic likely worsened existing agricultural challenges, affecting various actors in the postharvest value chain, though these impacts had not been fully assessed. View evidence ↗
The question
- The study aimed to investigate how COVID-19 restrictions affected the livelihoods and postharvest activities of farmers, processors, marketers, transporters, and consumers. View evidence ↗
- The research specifically examined the impact of restrictions on labor availability, market access, food supply and demand, pricing, and access to credit. View evidence ↗
What they did
- The study used a cross-sectional micro approach across 16 Nigerian states spanning all six geopolitical zones. View evidence ↗
- A total of 96,000 respondents were sampled, with 6,000 people per state and 1,200 representatives from each of the five value chain actor groups. View evidence ↗
- The study compared data from a 24-month period: 12 months before the restrictions and 12 months during the restrictions. View evidence ↗
- Data collection methods included questionnaires, interview guides, key informant interviews, and focus group discussions. View evidence ↗
What they found
- Market and farm access were severely limited, with 73% of farmers reporting difficulty accessing farms and 60% seeing reduced customer patronage. View evidence ↗
- Marketers faced significant logistical hurdles, with 87.4% struggling to reach customers and 86.6% having difficulty accessing warehouses or depots. View evidence ↗
- Consumers were heavily impacted, with 88.4% finding it difficult to access markets and 89.1% of those who could access markets paying higher prices. View evidence ↗
- Access to finance was severely restricted, with over 84% of all value chain actors unable to obtain loans during the restriction period. View evidence ↗
- Livelihoods declined for most farmers, with 81.5% experiencing a change and 55.8% specifically earning less money. View evidence ↗
- Among consumers, 72.4% saw a decline in livelihood, leading 75.5% to adopt coping mechanisms such as rationing or skipping meals. View evidence ↗
- Despite the negative economic impacts, the leading perceived benefit of the restrictions was increased intimacy among family members. View evidence ↗
What it means
- The authors conclude that the restrictions were generally detrimental, negatively impacting output, market access, pricing, finance, labor, and overall standards of living. View evidence ↗
- The authors suggest that these findings should be used to create a data-driven operational order for the postharvest sector to better guide responses during future pandemics. View evidence ↗
Visual summary
3 visualsIllustrations explain the paper; charts are replotted from the paper's own table values.
Postharvest Value Chain Disruption Map
AI-generated conceptual illustration (Nigerian agricultural postharvest value chain (cassava and maize crops, rural processing huts, open-air markets, and old). It explains the idea and does not show study data.
View source evidence ↗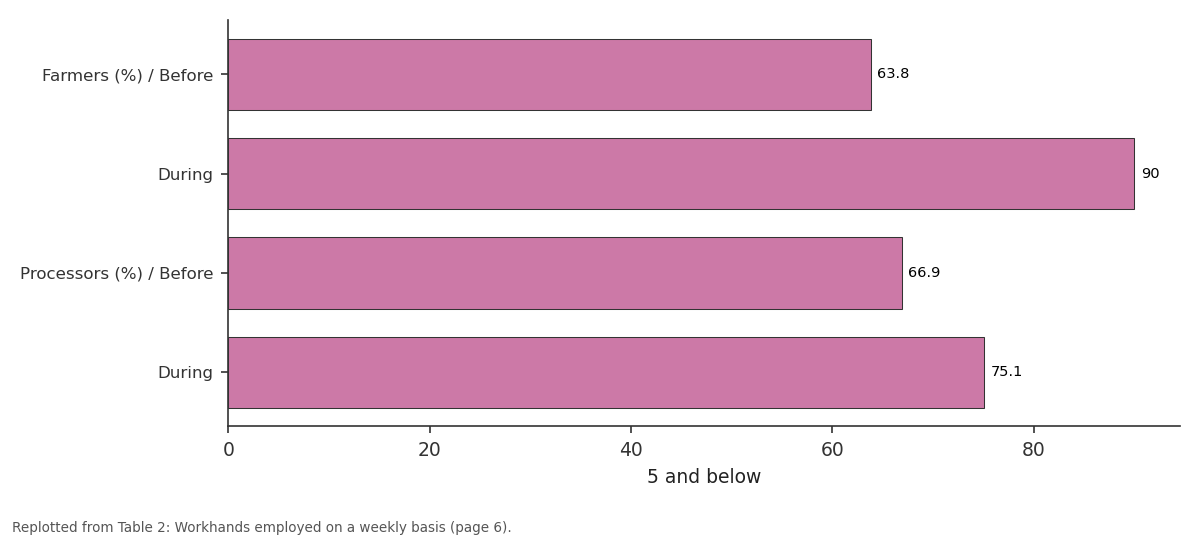
5 and below: Farmers (%) / Before vs During vs Processors (%) / Before vs During
Replotted from Table 2 (page 6) of the original paper. Every bar is the paper's own table value.
View source evidence ↗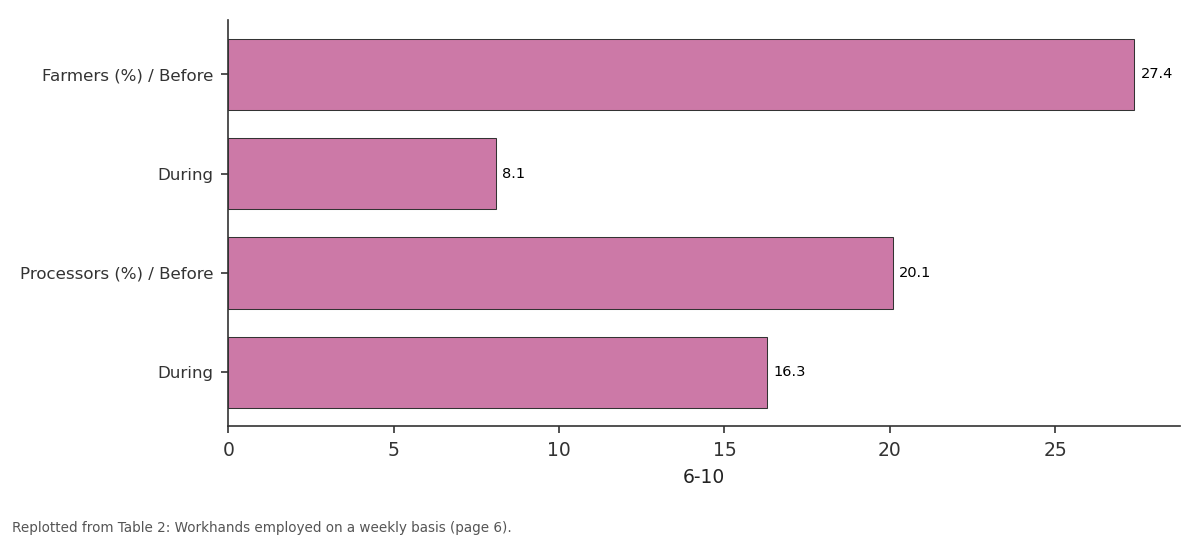
6-10: Farmers (%) / Before vs During vs Processors (%) / Before vs During
Replotted from Table 2 (page 6) of the original paper. Every bar is the paper's own table value.
View source evidence ↗Figures & tables
From the original paper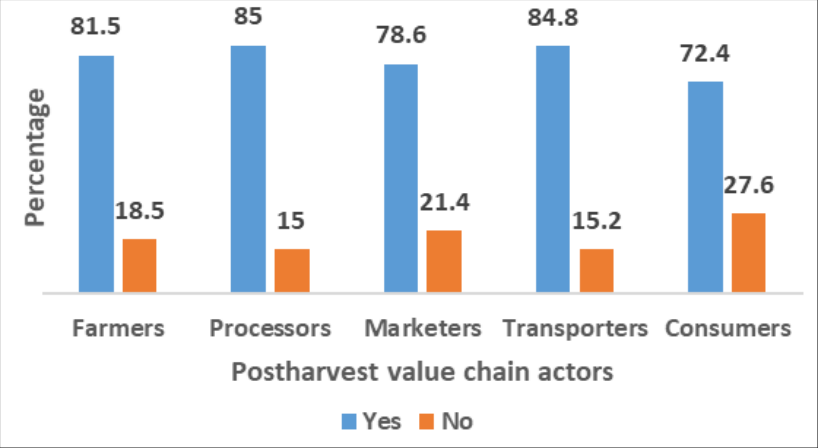 Figure 1
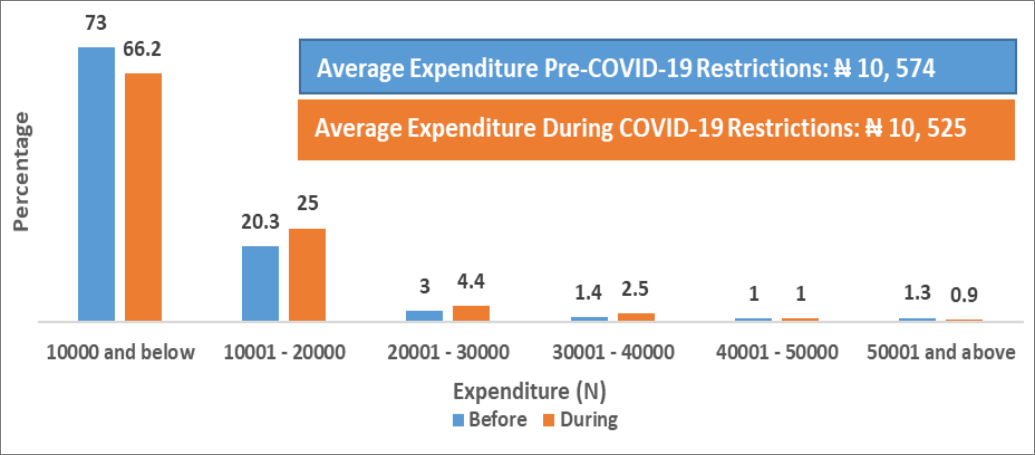 Figure 2
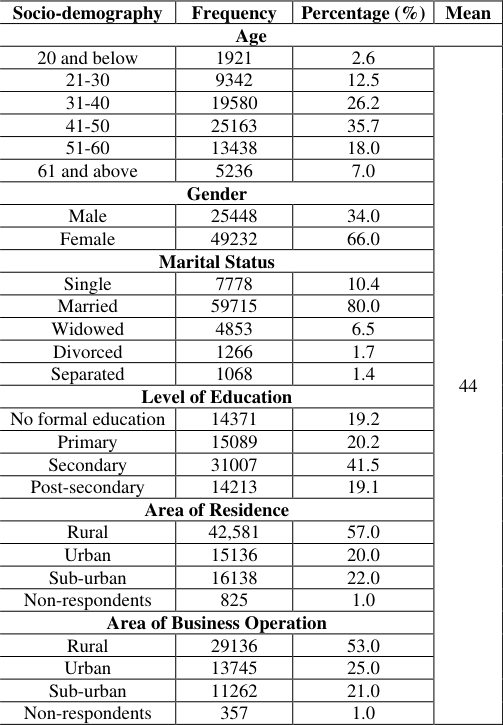 Table 1A
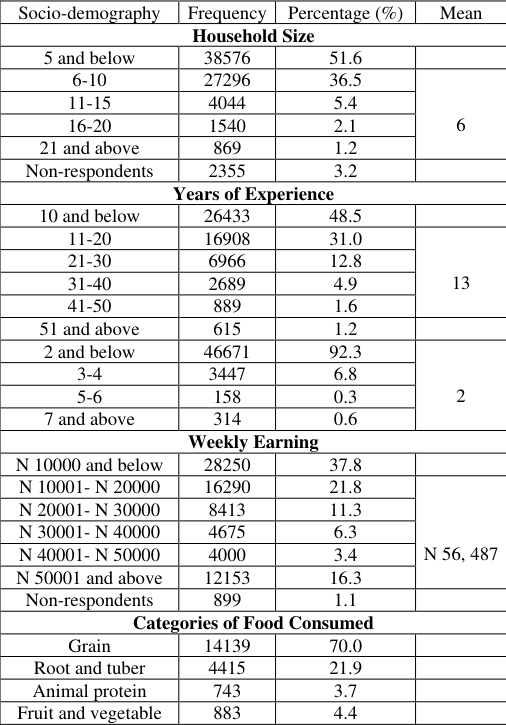 Table 1B
 Table 2
 Table 3
Introduction
The novel human coronavirus disease 2019 (COVID-19) a highly contagious and lethal virus was first reported in Wuhan, China in December 2019 and subsequently spread globally to become the fifth documented pandemic since the Spanish Flu of 1918-1920 (World Health Organization [WHO], 2021) [14] . COVID-19, was officially recorded in Nigeria in February, 2020. At the time, no vaccines or specific treatment therapies existed (McCeary and Pogue, 2020; Rothan and Byrareddy, 2020) [4,17] , the Federal Government of Nigeria therefore introduced restrictions (movement, time, and large gathering restriction etcetera) as containment measures (Ajibo, 2020) [1] . The growing number of studies on impact of COVID-19 in the agricultural sector is often discussed in context of developed countries highlighting the gap in the understanding of how the pandemic is impacting developing countries, Nigeria inclusive. Furthermore, the pandemic came at a time when Nigeria's food system was already under strain (Samuel et al., 2021) [9] due to insecurity, drought and flooding. Thus, the outbreak exacerbated the challenges of the country's agricultural sector, impacting activities and actors (Farmers, Processors, Marketers, Transporters, and Consumers) along the postharvest value chain in ways that are yet to be critically and empirically assessed. Fundamentally, this investigation is borne out of a priori knowledge that actors experienced several disruptions in their postharvest activities and consequently their livelihood as a fall out of restrictions. Thus, this study investigated the effect of the COVID-19 restrictions on postharvest activities and livelihood of farmers, processors, marketers, transporters, and consumers. It further examined the effects of the restrictions on labor, access to market, food supply, commodity sales and prices, food demand, and access to agricultural credits. The fallouts of this study would lead to a better understanding of the potential assortment of impacts of COVID-19 restrictions. Most importantly, it would aid in establishing a post COVID-19 data driven order of operation in the postharvest sector, and guide response to key value chain actors' needs during difficult crisis periods, especially future pandemics.
Methodology 2.1 Research design
The research design is cross sectional and employed the micro approach as its estimation methodology in 16 states (Kano, Sokoto, Jigawa, Taraba, Bauchi, Gombe, Benue, Kwara, Ebonyi, Imo, Anambra, Lagos, Osun, Ondo, Delta, and Rivers States) across the 6 geopolitical zones of the country. The selection of postharvest value chain actors from diverse geographical zones and states is predicated on the fact that they experienced the effects of restrictions in ways peculiar to their situation and location. www.extensionjournal.com
Sample size and selection
A multi-stage sampling procedure was used to select respondents. Firstly, 16 states with high incidence of COVID-19 as published by the National Centre for Disease Control (NCDC) with formal restriction were purposively selected. Secondly, 6 key agricultural commodities (rice, cassava, fish, cowpea, yam, and fruits & vegetables) in terms of their widespread trade and consumption were selected. Respondents were randomly selected from a predetermined list obtained from Agricultural Development Programmes (ADPs) of the selected states, and relevant associations as appropriate. A total of 96,000 respondents were sampled; 6,000 per state comprising 1,200 each of the value chain actors (farmers, processors, marketers, transporters, and consumers) of interest. Data were obtained through key informant interview, focus group discussions (FGDs), questionnaire and interview guide. The estimation was considered over a 24-month period, that is, 12-months prior to the restrictions (before) and 12-months into the restrictions (during).
Data presentation and analysis
Data presentation was twofold; aggregated data (all states and all actors) and disaggregated data (individual states cum individual actors). Data collected were analyzed using both descriptive (percentages, frequencies and means) and inferential (T-test: Paired Sample and Independent) statistics. The statistical package for data analysis was IBM SPSS Statistics Version 20.0. 1b) is 6 (disaggregated: Farmers; 6, Processors; 6, Marketers; 6, Transporters; 5, Consumers; 5). Household composition revealed equal distribution of the genders (Table 1a). The patriarchal reality of Nigerian society and the agricultural sector is reflected in the distribution of gender (Table 1a) across actors; 66% male, 34% female (disaggregated: Farmers; 68.5% male, 31.5% female, Processors; 56.4% male, 43.6% female, Marketers; 56.7% male, 43.3% female, Transporters; 91.7% male, 8.3% female, Consumers; 63.5% male, 36.5% female). As shown in Table 1b, actors belong to an average of 2 associations. Table 1b revealed the mean years of experience of actors to be 13 (disaggregated: Farmers; 15, Processors; 11, Marketers; 13, Transporters; 13). Furthermore, 10.4, 80, 6.5, 1.7, and 1.4% of actors were single, married, widowed, divorced, and separated in that order (Table 1a). Again, Table 1a revealed that 19.24, 20.21, 41.52, and 19.03% of the actors have no formal education, primary education, secondary education, and post-secondary education respectively. More than half (57%) of the actors (excluding consumers) are ruralites (Table 1a). Also 53% have their businesses in rural areas (Table 1a). Again, 70, 22, 4, and 4% consume majorly grains, root and tubers, animal protein, fruit and vegetable respectively (Table 1b). As shown in [2,3] , and low consumption of animal protein, fruit and vegetable is closely associated to incidence of household poverty (WHO Technical report series 916, 2003; Simone, Christy, Melissa, Yamin & Bradley, 2019) [11] .
Results and Discussion
Results and Discussion
Socioeconomic characteristics of respondents
Socioeconomic characteristics of respondents
As shown in
As shown in
Effect of the Restrictions on Postharvest Value Chain Actors 3.2.1 Effects of the restriction on availability of labour
Farmers: Prior to the restrictions, 20.1% used family labour while 56.1% relied on both family and hired labour, which morphed to 47.1% and 35.9% respectively during the restrictions. Only 1.1% had a workforce of above 20 before the restriction while a sizable proportion (63.8%) had a prerestriction workforce of 5 and below. This finding echoes the nature of the Nigerian agricultural sector where about 70% of farmers are smallholders. During the restrictions, as shown in Tables 2 &3, the former reduced to 0.1% even as the latter increased to an even greater number (90%). A drop in number of farmhands is a pointer that farming activities and output were not optimal during the restrictions. This change created unemployment in the sector and is similar to the poor performance of other sectors in the economy during the pandemic. This finding corroborates report by the United Nations Development Programme (2021) [12] that Nigeria lost about 20% of her work force at the peak of the pandemic. Processors: Before the restrictions, 33.9% used family labour while 40.4% relied on both family and workhands, which changed to 48.1 and 30.4% respectively during the restrictions. Only 2.2% had a pre-restriction workforce of above 20 while a considerable proportion (66.9%) had workforce of 5 and below which changed to 0.5%, and 75.1% respectively during the restrictions (Tables 2 &3). This change represents a drop in number of workhands and signposts reduced processing activities and output during the restrictions. This is in line with submissions by Vatta et al., (2022) [13] that restrictions significantly disrupted labour supply availability for processing and input supply patterns. Marketers: Hitherto the restrictions, 40.2% used family labour while 32.9% relied on both family and workhands, which changed to 47.4 and 21.7% respectively during the restrictions. About 0.4% had pre-restriction workforce of above 20 and a sizable proportion (71.7%) of marketers had a pre-restriction workforce of 5 and below which changed to 0.1% 89.8% during the restrictions (Tables 2 &3). The decrease in number of workhands is a pointer to reduced marketing activities during the restrictions. This finding is comparable to National Bank for Agriculture and Rural Development (2020) that restrictions adversely affected marketing of produce and likely led to distress sales and depressed prices. Transporters: Before the restrictions 16.8% used family labour while 23.4% relied on both family and workhands which changed to 23.4 and 21.2% during the restrictions. 0.5% had a pre-restriction workforce of above 20 and majority (78.2%) had a workforce of 5 and below. This however changed to 0.2 and respectively 91.0% during the restrictions (Tables 2 &3). The dip in number of workhands www.extensionjournal.com caused decreased freighting of agricultural commodities owing to the restrictions. In a related study, FAO (2020) [10] asserted that restrictions triggered reduced freighting, higher labour, and transport costs. Nominally, there was a difference in number of workhands employed by farmers, processors, marketers, and transporters (disaggregated) before and during restrictions. These actors reported a reduction in the number of workhands employed during this period. Additionally, inferential analysis for farmers, marketers, and processors show that there was a significant difference (T-test; p≤0.05) in the number of workhands employed before and during restrictions. Nonetheless, there was no significant difference (T-test; p≤0.05) in the number of workhands employed by transporters before and during restrictions. This may not be unconnected to the fact that at some point during the restrictions, transporters of agricultural commodities in Nigeria received government waiver to move these commodities intra and interstate. However, for all actors combined (aggregated) there was significant difference (T-test; p≤0.05) in the number of workhands employed before and during restrictions. The above implies that restriction probably had a negative effect on the scale of operation and wage employment in the postharvest sub-sector. This is akin to findings in India where restrictions led to increased production cost and reduced scope of agricultural operation (Rawal, Kumar, Verma & Pais, 2020).
Effect of restriction on access to farm/market, food demand and supply, and food prices.
Access to market/farm, food demand, food supply, and food prices at the height of the pandemic in Nigeria was impacted by several restrictions put in place to prevent, mitigate, and respond to its spread. Farmers: Data suggest that a sizable proportion (73%) of farmers did not have easy access to their farms, while 60% had a reduction in customers' patronage during the restrictions of which majority (76%) could not meet customers' demand. The restriction of movement adversely affected the prices of commodities for 64.7%. This implies that access to farm, food demand and supply, and food prices were negatively impacted during the restrictions. Processors: Approximately 86% of processors did not have easy access to commodity market/warehouse, and transportation of commodities while prices of commodities were unfavorable for 78.3% of those that have full access during the restriction. The foregoing suggests that access to market, transportation of commodities, and food prices were negatively affected for processors during this period.
Marketers:
Access to customers was not easy for 87.4% of marketers, 86.6% found it difficult accessing warehouses/depot/processing locations during the restrictions. Furthermore, 80.5% sold less, while the prices of commodities were unfavorable for 84.1%. It is also worthy to know that 78.0% and 79.3% of marketers sold less and made less profit respectively during this epoch.
Transporters:
Access to market/warehouses/depot was difficult for a whopping 90.3% of transporters, while freighting of commodities was not easy for 80.5% during the restrictions. Major cost incurred on freighting activities increased for 87.4% of transporters. Majority (83.7%) experienced increased harassment by security agents on the highways.
Furthermore, 84.1% transported less commodities, whereas transportation charges were unfavorable for 77% during this period. These data suggest that access to market, demand and supply, and freighting prices for transporters were negatively impacted during this period.
Consumers:
Accessing market to buy food commodities was difficult for 88.4% of consumers while, 80% of the consumers with easy access bought less food commodities and 89.1% did so at higher prices during the restrictions. These data suggest that access to market was hindered, quantity of food commodities purchased dropped, and prices for food commodities spiked during this epoch. Hitherto the restrictions, 83.7% procured commodities in the open-air market, while 9.0% bought from shops/outlets in their neighborhood. This changed to 40.4% and 52.6% respectively during the restrictions. The fact that more consumers bought commodities in the open-air market prior to the restrictions but are now compelled to buy from neighborhood shops and sales outlets that are often considered expensive suggests that their purchasing power dipped during this period. The challenges faced by farmers during the restrictions include, but are not limited to unavailability of labour, insect infestation and spoilage of inputs. For processors, theft, spoilage, unavailability of labour, shortage of raw materials, and difficulty in transporting the commodities were recorded. Marketers had issues with theft, spoilage, shortage of transport vehicle, unavailability of labour, low patronage and high cost of commodities. Transporters encountered reduced patronage, and unavailability of labour. Finally, consumers were face with high cost of commodities and inability to preserve leftovers.
Access to finance
Fundamentally, farmers (88.4%), processors (90.1%), marketers (91.0%), transporters (84%), and consumers (87.5%) could not access loans for their businesses or personal use during the restrictions. Among those who accessed loans, farmers (82%), processors (84.3%), marketers (83.4%), transporters (82.9%), and consumers (73.7%) obtained them similar to or at rates higher than what was obtained prior to the restrictions. By the same token, 77.7% of farmers, 80.1% of processors, 84.3% of marketers, 79.6% of transporters, and 77.7% of consumers did not receive assistance from family and friends during this epoch. These data suggest that the restriction environment was detrimental to postharvest value chain actors in terms of access to finance. Dip in revenue occasioned by containment measures resulted in liquidity deficiencies, threatening the viability of otherwise sustainable enterprises. These measures have deeply impacted access to finance (Organization for Economic Cooperation and Development, 2020).
Sources of inputs/commodities
Hitherto the restrictions, 67.8, 17.8, and 14.4% of farmers sourced inputs within their local government, outside their www.extensionjournal.com local government, and outside their state respectively which morphed to 73.4, 16.3, and 8.3% respectively during the restrictions. 67.1, 21.3, and 11.6% of processors obtained inputs within their local government, outside their local government, and outside their state respectively which changed to 76.1, 16.7, and 7.2% respectively during the restrictions. 58.1, 22.4, and 19.5% of marketers sourced for commodities within their local government, outside their local government, and outside their state which morphed to 75.3, 13.4, and 11.3% respectively during the restrictions. 47.1, 31.4, and 21.5% of transporters operated within their local government, outside their local government, and outside their state respectively which changed to 74, 18, and 7.8% respectively during the restrictions. As well, results showed that 60.1% of farmers, 52.5% of processors, 64.6% of marketers, and 60% of transporters operated at a low capacity during restrictions. This data suggests that actors' movement became more restricted to locations closer to their area of operation or residence. As such, their choices became increasingly limited with respect to sourcing for quality and low-priced input(s), and rendering premium services.
Work hours
During the restrictions, farmers (70.5%), processors (74.9%), and marketers (77.9%) experienced reduction in time spent by workhands and overall productivity. However, 80.8% of transporters did not experience change in the time spent by manual handlers on activities. 78.9% of farmers spent more time moving commodities from farms to aggregation centres/point of sale during this period. The reduced man hour by workhands on farming, processing, and marketing activities led to low productivity.
Livelihood 3.3.1 Income:
Farmers: As shown in Figure 1, 81.5% of farmers experienced a change in their livelihood, with 55.8 making less money, 32.1 on borderline, while 12% made more money during the restrictions. Only one in two (50%) farmers could make do with augmented earnings from other sources of income for family upkeep. These suggest that standard of living for farmers plummeted, adversely impacting both on-farm and off-farm income.
Processors:
A large percentage (85.0%) of processors observed a change in their livelihood (Figure 1). That 33 made less money, 42 on borderline, and 25% making more money is an indication of the severity of their circumstance with respect to earning during this period. Nonetheless, 42.5% did not rely on other sources of income.
On the whole, these data suggest that the economic fallout of the restrictions was milder on processors compared to farmers. Marketers: About 79% of agro-commodity marketers had a change in their livelihood during the restrictions (Figure 1), with 45.8 making less money, 37.4 on borderline, and 16.8% making more money. Furthermore, only one in two (50.8%) marketers could make do with augmented earnings from other sources of income. Reduced income for about half of marketers suggests that the restriction milieu had adverse effect on livelihood of marketers of agricultural commodities.
Transporters:
During the restrictions, 84.8% of transporters had a change in their livelihood (Figure 1); 52.2 made less, 33.3 on borderline, while 14.5% made more money. About one in two (54.4%) transporters could make do with augmented earnings from other sources of income. This data is a pointer that the restrictions situation had untoward consequence on livelihood of transporters.
Consumers:
Consumers include farmers, processors, marketers, transporters, students, civil servants, artisan, among others. Categorically, 72.4% had a decline in their livelihood during the restrictions (Figure 1). 42.1% consumed same quality food pre and during restrictions, while 64.9% lacked the wherewithal to procure food commodities during this period. Majority (75.5%) adopted mechanisms to cope with the negative fallout emanating from the restriction. These strategies may have included: removing vegetable, and animal protein from their meals, rationing meals, skipping meals etcetera. A cursory look at the results shows that postharvest value chain actors had a downturn in their earnings during the restrictions as more fell into weekly earnings of N 10,000 and below category. However, T-test (p≤0.05) for each of the actors' earnings shows that there was a significant difference between their individual earnings before and during restrictions. In the same vein, analysis for all the actors combined also shows that there was a significant difference between their earnings before and during restrictions. Result of the T-test for aggregated and disaggregated data is in sync and confirms that the restrictions had an adverse effect on actors' income.
Expenditure on food
As shown in Figure 2, 73% of consumers/households spent N 10, 000 and below on food on weekly basis prerestrictions, this is against 66.2% recorded during the restrictions. That a smaller percentage of persons spent N 10,000 and below on food as compared to pre-restrictions should not be confused for increase in quantity and quality of food purchased during the restrictions; prices of food went up during this period and consumers bought same or lesser quantity of food at higher prices; hence the increased expenditure on food. Additionally, low income people majorly consume "giffen goods" and must buy them no matter what their prices are. The number of households in categories N 10, 001 -N 20,000, N 20, 001 -N 30,000, and N 30, 001 -N 40,000 increased during the restrictions. This is contrary to what was observed for N 10, 000 and below category in the same period. On the whole, data show a negligible difference of 0.5% dip in consumers' expenditure on food during restrictions. Be that as it may, further analysis (T-test; p≤0.05) shows that the difference in expenditure on food before and during restrictions was not significant. This non-significance could be attributed to coping mechanism adopted by subjects to mitigate the effect of dwindling income, lower purchasing power, inflation, and unemployment during restrictions.
Postharvest activities
During the restrictions, 70% of farmers had their harvesting activities interrupted; 73.2% could not get readily available labour for harvesting, while those who got (81.3%) had them expensive. On the whole, 71.5% of farmers could not keep up with the level of postharvest handling as it was prerestrictions. Similarly, 66.8% of processors had storage challenges. 60.8% stored products longer than what was obtainable pre-restrictions. Majority (82.9%) faced difficulties in procuring commodities, and 73.5% experienced disruption in processing. Furthermore, 78.1, 62.6, and 76.6% had reduction in quantity of commodities processed, reduced quality of products, and worsened power supply respectively. Additionally, 82.6% had to battle with spiraling increase in the cost of packaging materials; this increase could lead to higher production cost for processors and most often than not higher prices for consumers. A preponderance of marketers (80.7%) had disruption in the movement of commodities during the restrictions. The implication is that customers might not get needed commodities as and when due, and prices of highly perishable commodities may skyrocket. Furthermore, 90.1, 85.5, and 81% of transporters encountered increased number of checkpoints, regular harassment and delay at checkpoints, and difficulty/bottleneck in securing permit to transport commodities respectively. In the same vein, 86.1% of consumers experienced scarcity of food commodities, while 84.1% bought fewer of it than they would during this epoch.
Perceived Benefit Associated with the Covid-19 Restrictions
This study did not only investigate the untoward consequences of the restrictions, but also delved into associated benefits. The results of this inquiry revealed that increased intimacy between family members is the leading benefit associated with the restriction. Other top ranked perceived benefits include; increase in household labour, diversification of income sources, increased profit, and food/money palliative from government. www.extensionjournal.com
Conclusion
The restriction was detrimental to postharvest activities in general. It affected output, access to market, food demand and supply, food prices, finance, labour demand and supply, sources of inputs and the standard of living of persons and households negatively. The findings of this investigation showed that postharvest value chain actors had a reduction in earnings and number of workhands employed during the restriction. With respect to expenditure on food, these actors had a negligible decrease. Finally, the restrictions had several negative impacts on the life of Nigerians, it however brought about increased intimacy among family members among others.
Figures and tables from the paper
| Socio-demography | Frequency | Percentage (%) | Mean |
|---|---|---|---|
| Age | |||
| 20 and below | 1921 | 2.6 | 44 |
| 21-30 | 9342 | 12.5 | |
| 31-40 | 19580 | 26.2 | |
| 41-50 | 25163 | 35.7 | |
| 51-60 | 13438 | 18.0 | |
| 61 and above | 5236 | 7.0 | |
| Gender | |||
| Male | 25448 | 34.0 | |
| Female | 49232 | 66.0 | |
| Marital Status | |||
| Single | 7778 | 10.4 | |
| Married | 59715 | 80.0 | |
| Widowed | 4853 | 6.5 | |
| Divorced | 1266 | 1.7 | |
| Separated | 1068 | 1.4 | |
| Level of Education | |||
| No formal education | 14371 | 19.2 | |
| Primary | 15089 | 20.2 | |
| Secondary | 31007 | 41.5 | |
| Post-secondary | 14213 | 19.1 | |
| Area of Residence | |||
| Rural | 42,581 | 57.0 | |
| Urban | 15136 | 20.0 | |
| Sub-urban | 16138 | 22.0 | |
| Non-respondents | 825 | 1.0 | |
| Area of Business Operation | |||
| Rural | 29136 | 53.0 | |
| Urban | 13745 | 25.0 | |
| Sub-urban | 11262 | 21.0 | |
| Non-respondents | 357 | 1.0 |
Table text extracted from the original PDF; superscript letters are shown inline. The original table image is below.
View original table image
| Socio-demography | Frequency | Percentage (%) | Mean |
|---|---|---|---|
| Household Size | |||
| 5 and below | 38576 | 51.6 | |
| 6-10 | 27296 | 36.5 | 6 |
| 11-15 | 4044 | 5.4 | |
| 16-20 | 1540 | 2.1 | |
| 21 and above | 869 | 1.2 | |
| Non-respondents | 2355 | 3.2 | |
| Years of Experience | |||
| 10 and below | 26433 | 48.5 | |
| 11-20 | 16908 | 31.0 | 13 |
| 21-30 | 6966 | 12.8 | |
| 31-40 | 2689 | 4.9 | |
| 41-50 | 889 | 1.6 | |
| 51 and above | 615 | 1.2 | |
| 2 and below | 46671 | 92.3 | 2 |
| 3-4 | 3447 | 6.8 | |
| 5-6 | 158 | 0.3 | |
| 7 and above | 314 | 0.6 | |
| Weekly Earning | |||
| N 10000 and below | 28250 | 37.8 | |
| N 10001- N 20000 | 16290 | 21.8 | N 56, 487 |
| N 20001- N 30000 | 8413 | 11.3 | |
| N 30001- N 40000 | 4675 | 6.3 | |
| N 40001- N 50000 | 4000 | 3.4 | |
| N 50001 and above | 12153 | 16.3 | |
| Non-respondents | 899 | 1.1 | |
| Categories of Food Consumed | |||
| Grain | 14139 | 70.0 | |
| Root and tuber | 4415 | 21.9 | |
| Animal protein | 743 | 3.7 | |
| Fruit and vegetable | 883 | 4.4 |
Table text extracted from the original PDF; superscript letters are shown inline. The original table image is below.
View original table image
| — | Farmers (%) | — | Processors (%) | — | Marketers (%) | — | Transporters (%) | — |
|---|---|---|---|---|---|---|---|---|
| Before | During | Before | During | Before | During | Before | During | |
| 5 and below | 63.8 | 90.0 | 66.9 | 75.1 | 71.7 | 89.8 | 78.2 | 91.0 |
| 6-10 | 27.4 | 8.1 | 20.1 | 16.3 | 22.9 | 8.4 | 16.8 | 7.3 |
| 11-15 | 4.7 | 1.4 | 6.9 | 5.3 | 3.2 | 1.2 | 3.1 | 0.8 |
| 16-20 | 3.0 | 0.5 | 3.9 | 2.8 | 1.8 | 0.5 | 1.4 | 0.7 |
| 20 and above | 1.1 | 0.0 | 2.2 | 0.5 | 0.4 | 0.1 | 0.5 | 0.2 |
Table text extracted from the original PDF; superscript letters are shown inline. The original table image is below.
View original table image
| — | Farmers (%) | — | Processors (%) | — | Marketers (%) | — | Transporters (%) | — |
|---|---|---|---|---|---|---|---|---|
| Before | During | Before | During | Before | During | Before | During | |
| Family labour | 20.1 | 47.1 | 33.9 | 48.1 | 40.2 | 47.4 | 16.8 | 23.4 |
| Casual hands | 23.8 | 17.0 | 25.7 | 21.5 | 26.9 | 22.1 | 58.0 | 43.0 |
| Family and Casual hands | 56.1 | 35.9 | 40.4 | 30.4 | 32.9 | 21.7 | 23.4 | 21.2 |
Table text extracted from the original PDF; superscript letters are shown inline. The original table image is below.
View original table image
References
8 in the original paper- McCeary EK, Pogue JM. Coronavirus Disease 2019 Treatment: A Review of Early and Emerging Options. Open Forum Infectious Disease. 2020;7(4):1-19.
- NABARD. Impact Assessment of COVID-19 on Indian Agriculture and Rural Economy; Department of Economic Analysis & Research, National Bank for Agriculture and Rural Development: Mumbai, India, Available Online; c2020. Accessed on 25 July 2022 https://www.nabard.org/auth/writereaddata/tender/1211 203145Impact%20Assessment%20of%20COVID.pdf
- Dr. Rajiv Nehra, Dr. Dwijendar Nath. Hepatic response in COVID-19. International Journal of Advanced Biochemistry Research. 2021;5(2):01-04.
- Rawal V, Kumar M, Verma A, Pais J. COVID-19 Lockdown: Impact on Agriculture and Rural Economy; Society for Social and Economic Research: New Delhi, India; c2020. Accessed on 11 July 2022. ISBN: 978-81937148-7-4. Available Online: https://www.networkideas.org/wpcontent/uploads/2020/ 06/ sserwp2003.pdf
- Samuel FO, Eyinla TE, Oluwaseun A, Leshi OO, Brai BIC, Afolabi WAO. Food Access and Experience of Food Insecurity in Nigerian Households during the COVID-19 Lockdown. Food and Nutrition Sciences. 2021;12(11):1062-1072. DOI: https://doi.org/10.4236/fns.2021.1211078
- French SA, Tangney CC, Crane MM, Wang Y, Appelhans BM. Nutrition quality of food varies by household income: The Shopper study. BMC Public Health. 2019;19(1):231.
- Vatta K, Bhogal S, Green AS, Sharma H, Petrie CA, Dixit S. COVID-19 Pandemic-Induced Disruptions and Implications for National Food Security and Farm Incomes: Farm-Level Evidence from Indian Punjab. Sustainability. 2022;14(8):4452. https://doi.org/10.3390/ su14084452
- Rothan HA, Byrareddy SN. The epidemiology and pathogenesis of coronavirus disease (COVID-19) outbreak. Journal of Autoimmunity. 2020;109:102433. https://doi.org/10.1016/j.jaut.2020.102433. 1-4