
Research article · 2023 · Full text
International Journal of Agriculture Extension and Social DevelopmentProfile characteristics of farmer innovators in generation of innovations and re-inventions
Volume 6(1) · Pages 15–22 · DOI: 10.33545/26180723.2023.v6.i1a.164 ↗
Research areasInnovation and Socioeconomic DevelopmentAgricultural Systems and PracticesAgricultural Innovations and Practices
Abstract
Author-writtenThe generation of farmer innovations and re-inventions is not a new phenomenon in the farming community. Farmer innovations and re-inventions are a subject that is increasingly making people sit up and think. At the very least it underpins a refreshing new approach to indigenous environmental knowledge that goes further than just passive admiration. At the most, it is a potentially important new direction for research and extension wherever else the conventional approaches have failed to deliver. The findings of the study revealed that profile characters of the majority of the farmer innovators were middle to young aged, educated from under graduation to high schooling, possessing larger land holdings, found to have medium farming experience, annual family income, research and extension contact, mass media consumption, achievement motivation, scientiscism vs fatalism and progressivism have high creativity, risk bearing ability, and high research orientation. Farmers have been recognised as one of the key sources of innovation generation and there are calls for strengthening their innovation capacities. Based on profile characteristics of the farmer innovators this study analyses the innovation generation activities of farmers in the selected sample area. And the results suggest that a participatory extension approach by considering these profile characteristics of the farmer's innovation systems perspective, is a key determinant of innovation capacity in farmers. This is possible because participants are likely to be empowered and also gain problem-solving and analytical skills which are essential for generation of innovations and re-inventions.
Summary
Source-checkedPlain-language reading of the full paper, prepared with AI and checked against the text. Each point links to the authors' own words.
Why it matters
- Building on creative experiments by common people at village or semi-urban levels is necessary for a more inclusive development process in India. View evidence ↗
- Local experiments can lead to innovations that increase productivity and create employment opportunities. View evidence ↗
- A lack of mechanisms to share knowledge means that many farmer innovations remain localized and solve only individual problems. View evidence ↗
The question
- The study aimed to document farmer innovations and re-inventions across various farming situations and evaluate their rationality and effectiveness. View evidence ↗
What they did
- The research was conducted in the East Godavari, Khammam, and Kurnool districts of Andhra Pradesh and Telangana, covering wetland, dryland, gardenland, and hill areas. View evidence ↗
- A total of 240 farmers were initially selected using stratified random sampling, with 20 farmers from each of the four farming situations in each of the three districts. View evidence ↗
- The final analysis focused on 164 farmers who were identified as having innovative thinking. View evidence ↗
What they found
- The majority of farmer innovators were middle-aged (57.31%), followed by young (24.40%) and old (18.29%) farmers. View evidence ↗
- Education levels were varied, with the highest percentages of innovators having completed high school (24.40%) and under graduation (24.40%). View evidence ↗
- A vast majority of the innovators (87.80%) possessed large land holdings of above 5.0 acres. View evidence ↗
- Most innovators had medium farming experience (43.90%), ranging from 24 to 42 years. View evidence ↗
- The majority of innovators (58.53%) had a medium annual income between 4,50,000 and 8,00,000 rupees. View evidence ↗
- Most innovators (77.45%) maintained a medium level of contact with research and extension personnel. View evidence ↗
- Over half of the respondents (51.83%) were categorized as having high creativity. View evidence ↗
- The study found that a majority of farmers had high risk-bearing ability, though the table data specifically lists high risk bearing ability at 39.03%. View evidence ↗
- A majority of the innovators exhibited high research orientation, with table data showing 66.45% in this category. View evidence ↗
What it means
- The authors conclude that a participatory extension approach that considers the profile characteristics of farmers is essential for enhancing innovation capacity. View evidence ↗
- The authors recommend recognizing farmer innovations to increase farmer participation and make agriculture more diversified and remunerative. View evidence ↗
Visual summary
3 visualsIllustrations explain the paper; charts are replotted from the paper's own table values.
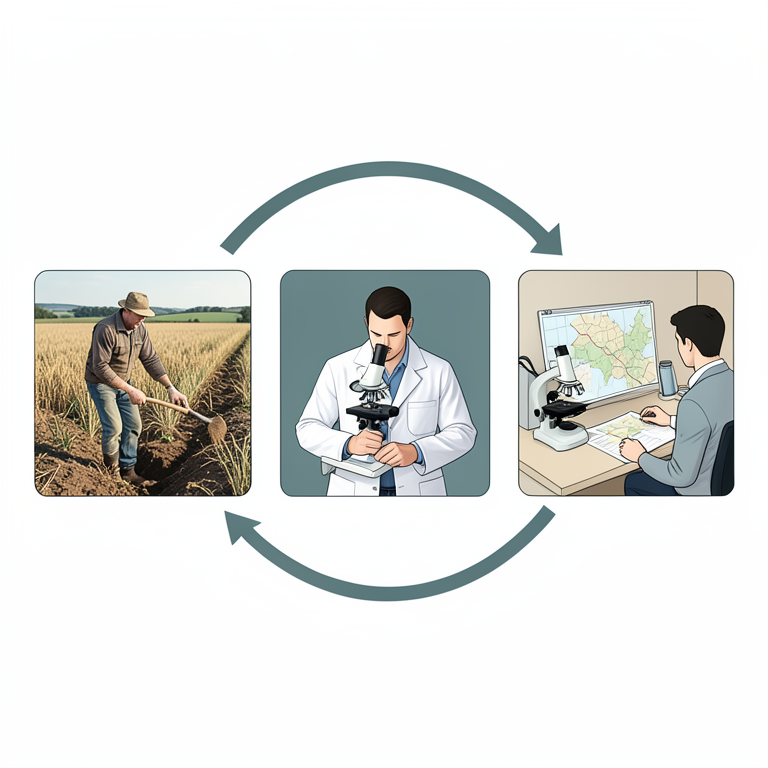
Participatory Extension Model
AI-generated conceptual illustration (Small-scale farmers, agricultural scientists in a laboratory, and government planners in an office). It explains the idea and does not show study data.
View source evidence ↗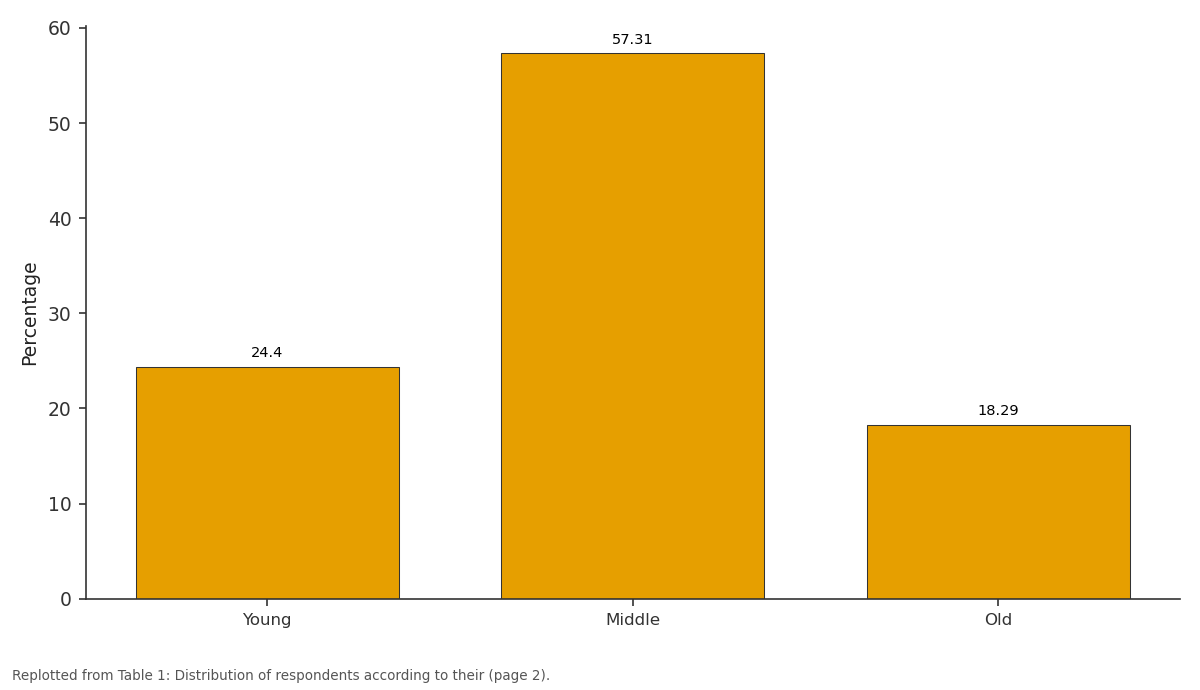
Percentage: Young vs Middle vs Old
Replotted from Table 1 (page 2) of the original paper. Every bar is the paper's own table value.
View source evidence ↗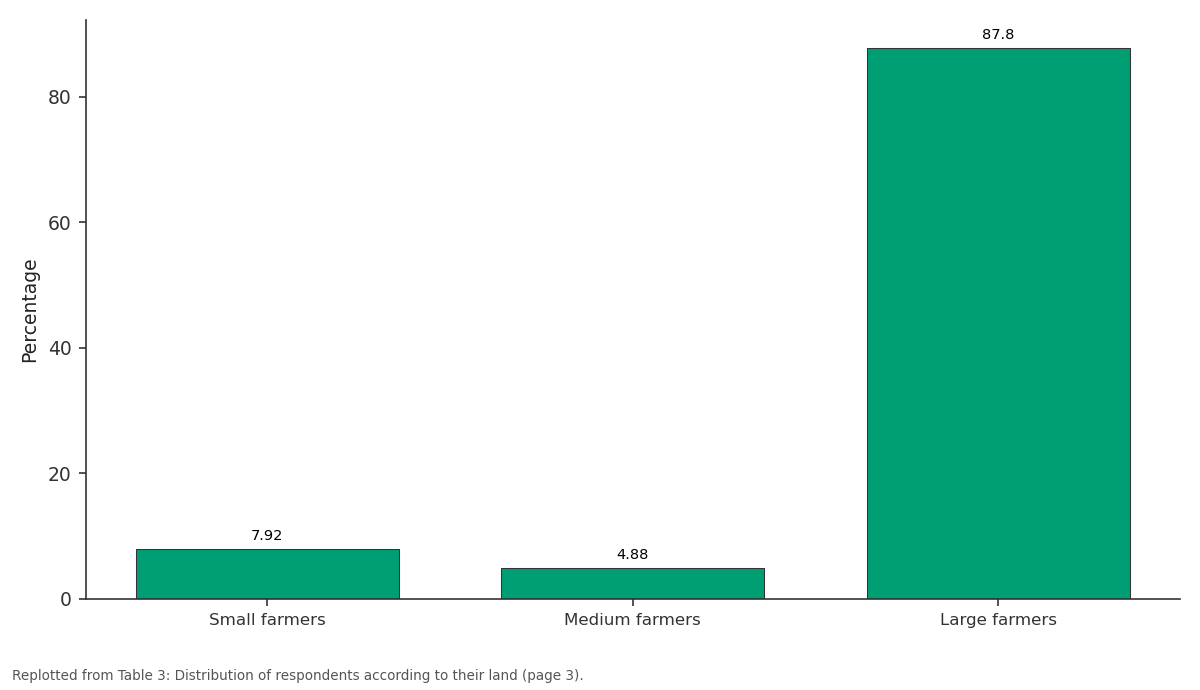
Percentage: Small farmers vs Medium farmers vs Large farmers
Replotted from Table 3 (page 3) of the original paper. Every bar is the paper's own table value.
View source evidence ↗Figures & tables
From the original paper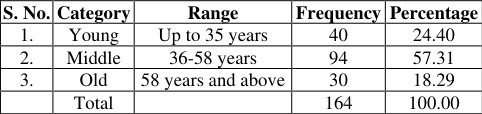 Table 1Page 2
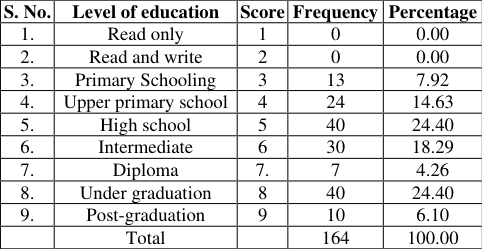 Table 2Page 2
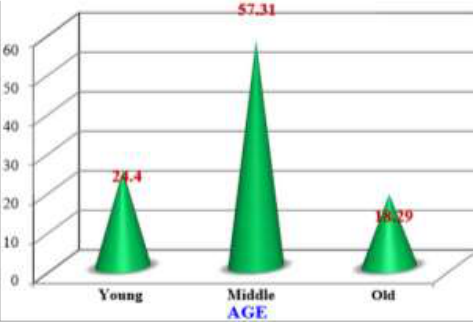 Figure 1Page 2
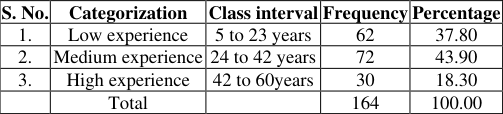 Table 4Page 3
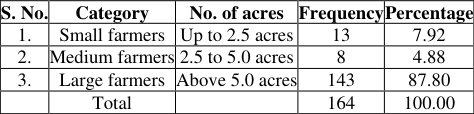 Table 3Page 3
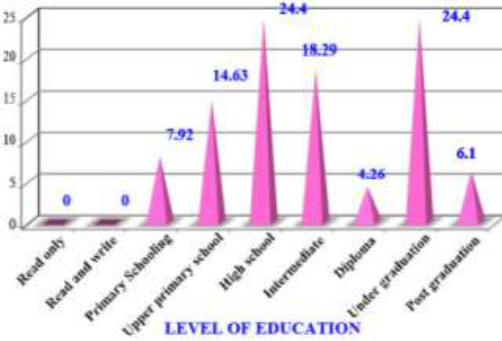 Figure 2Page 3
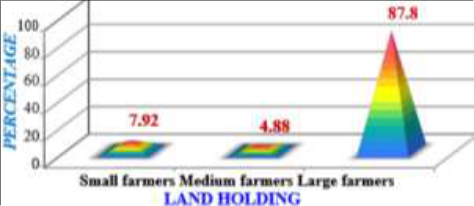 Figure 3Page 3
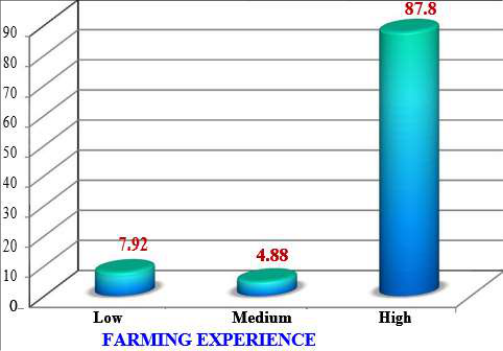 Figure 4Page 3
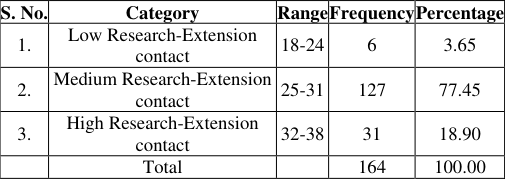 Table 6Page 4
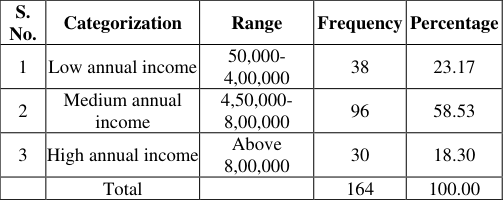 Table 5Page 4
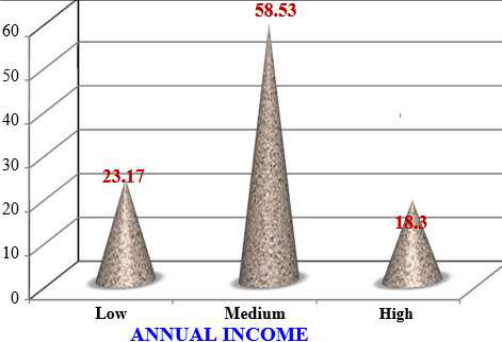 Figure 5Page 4
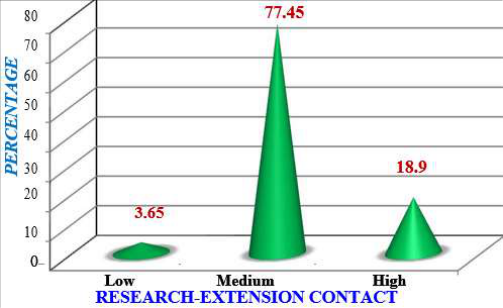 Figure 6Page 4
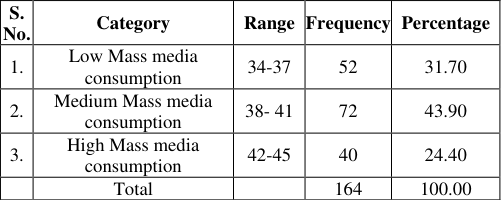 Table 7Page 5
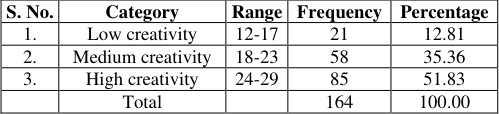 Table 9Page 5
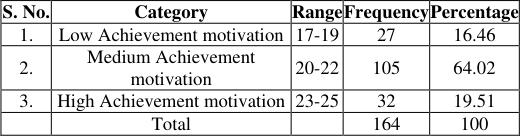 Table 8Page 5
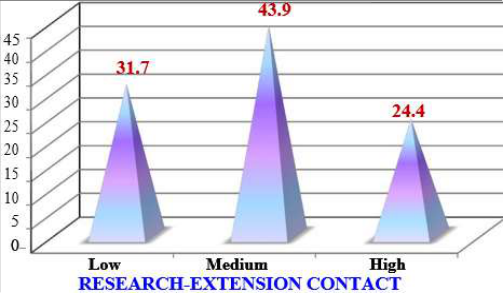 Figure 7Page 5
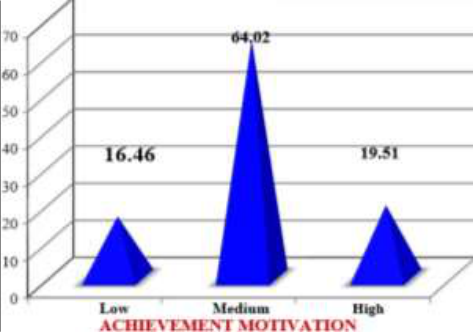 Figure 8Page 5
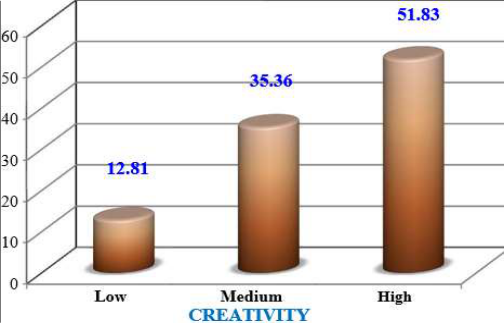 Figure 9Page 5
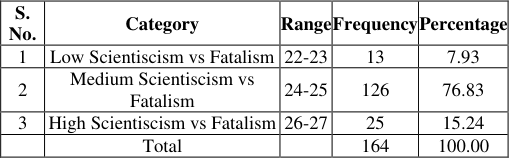 Table 11Page 6
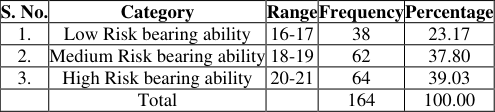 Table 10Page 6
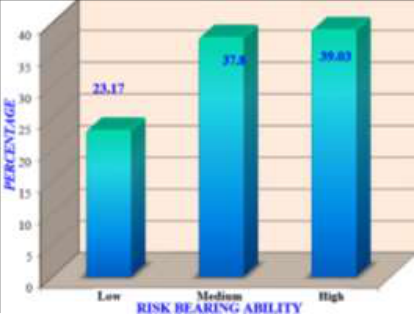 Figure 10Page 6
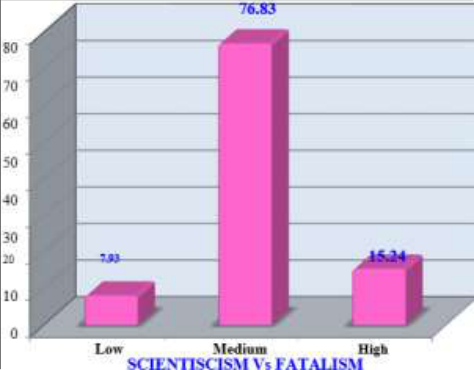 Figure 11Page 6
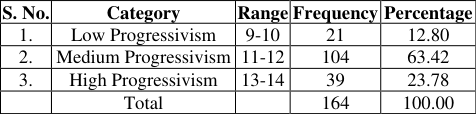 Table 12Page 7
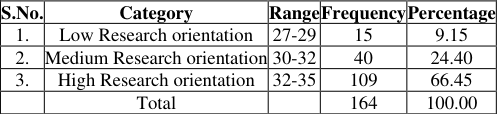 Table 13Page 7
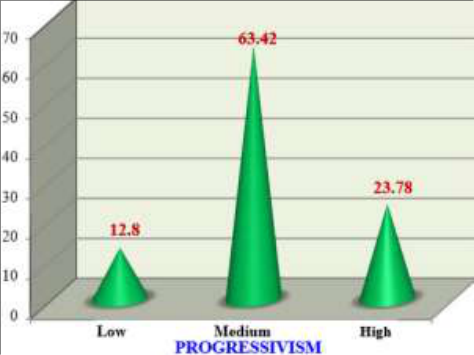 Figure 12Page 7
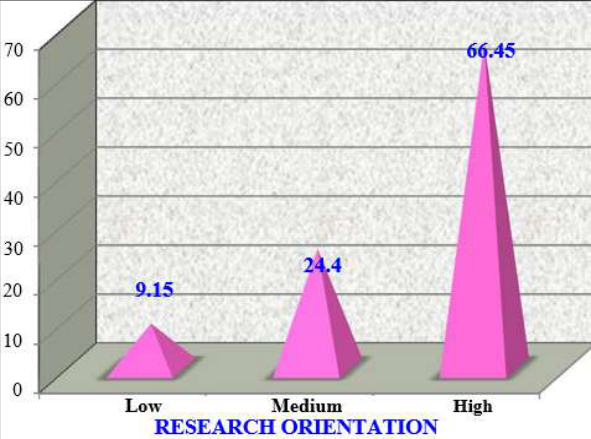 Figure 13Page 7
Introduction
To make the Indian development process more inclusive, there is no escape from building upon creative and innovative experiments pursued by common people at the village or semi-urban level. Many of these experiments lead to the development of innovations, which can improve productivity and generate employment. However, the purpose of a particular innovator may often be to solve just his/her problem. There is no mechanism available for him to share knowledge, innovation or practice with other people in different regions. Sometimes, ideas and innovations get diffused through word of mouth. But many times, these ideas remain localized. In the process, potential growth and social development get constrained. To overcome this constraint the present investigation was undertaken to scout, document and study the unaided innovations from the informal sector of our country. Innovation is defined as the application of knowledge in production and consists of the process by which firms master and implement the design and production of goods and services that are new to them, irrespective of whether they are new to their competitors, their countries or the world. Throughout the ages inventions and innovations, driven by the application of science and technology, have underpinned human development scientifically, socially and economically. Nevertheless, some level of innovations occurs at different levels of society. Re-invention is the degree to which an innovation is changed or modified by a user in the process of its adoption and implementation. When an invention is designed with the concept of reinvention in mind, a certain degree of re-invention often occurs as the innovation diffuses. The problem, though, has been the lack of systematic documentation of such occurrences. This study highlights some farmer innovations and re-inventions, principally in Andhra Pradesh and Telangana states. The innovative farmers are strategically important to design, develop and implement any research and development programme of Indian Agricultural Research (Ayyappan, 2010) [2] . The technological and institutional innovations are not two different departments of the same system. But it is often very common to see instances where technological innovations causing institutional changes or institutional innovation stimulating technological innovations. Institutional innovation in this case is not necessarily referring to organisational changes but to the changes in the behavioral patterns of people, rules of the game and changes in routine practices, new community consensus, changes in value systems etc (Amanuel et al. 2012) [1] . Farmers are a rich source of indigenous knowledge and practice. However, the www.extensionjournal.com knowledge and expertise of farmers has historically been undervalued, and there has been little convergence between informal innovation and formal research and development systems (Olivia, 2012) [6] .
Methodology
An exploratory research design was followed to unearth farmers knowledge in the form of farmer innovations and re-inventions with an objective to unearth and document as many farmer innovations and re-inventions as possible in different farming situations and to study the rationality and perceived effectiveness of them. Andhra Pradesh and Telangana states were selected purposively for the study since the researcher hails from the same State, familiarize with local language, which facilitates establishing quick rapport and carryout in depth study coupled with personal observation. Three (3) districts East Godavari, Khammam and Kurnool which comprises all the four farming situations viz., wetland, dryland, gardenland and hill area, of Andhra Pradesh and Telangana State were selected purposively for the study.
First phase
The list of farmer innovators under each farming situation was prepared in consultation with the officials of Department of Agriculture, Department of Horticulture, Scientists of District Agricultural Advisory and Transfer of Technology Centre (DAATTC) and Krishi Vigyan Kendras (KVK) in the selected districts for the identification and documentation of farmer innovations and re-inventions from the entire states of Andhra Pradesh and Telanagana.
Second phase
A sample of 20 farmers was selected from each selected farming situation i.e., wetland, dry land, garden land and hill area etc., thus a total of 80 farmers from each district were selected by using stratified random method of sampling. Thus a total sample of 240 farmers was selected for the present study.
Final selection of farmer innovators
Out of the 240 selected farmers from the sample area only 164 farmers were found to have innovative thinking and thus 164 farmer innovations and re-inventions were identified and documented by the researcher. The remaining 77 farmers are practising the indigenous technologies which they have acquired from their parental generations rather than developed by them (or) duplication of other farmers innovations and re-inventions and hence not considered for the study. Therefore a final sample of 164 farmers was considered for the further study and analysis.
Results and Discussion
Results and Discussion
Profile characteristics of farmer innovators 3.1.1 Age
As per the chronological age of the respondents they were grouped into these categories namely young, middle and old age. The distribution of the respondents according to the age was given in the table 1. 1 revealed that majority of the respondents were middle aged (57.31%) followed by young age (24.40%) and old aged (18.29%) farmers. This is because of the fact that the medium to younger farmers are more likely to generate innovations/re-inventions early in their life cycle because they are more exposed to the modern science and technologies due to their increased level of education compared to the old age farmers. Whereas older ones will rely less on external information and therefore do not get in touch with knowledge regarding the changes in farming practices compared to younger colleagues. It was also clear that meagre per cent of innovators were relatively old in this study indicates it takes time and experience to see, think through and test new ideas in the farming practices by them with their own perception of the changing circumstances.
| S. No. | Category | Range | Frequency | Percentage |
|---|---|---|---|---|
| 1. | Young | Up to 35 years | 40 | 24.40 |
| 2. | Middle | 36-58 years | 94 | 57.31 |
| 3. | Old | 58 years and above | 30 | 18.29 |
| Total | 164 | 100.00 |
Table text extracted from the original PDF; superscript letters are shown inline. The original table image is below.
View original table image
Education
Based on the formal education possessed by the farmer innovators during the time of inquiry were grouped into nine categories and the distribution is presented in the table 2. From the table and figure 2 it could be observed that 24.40 per cent each of the respondents studied up to under graduation and high school respectively. Whereas 18.29, 14.63, 7.92, 6.10 and 4.26 per cent of the respondents having education up to intermediate, upper primary schooling, primary schooling, post-graduation and diploma respectively. Education is not only useful in adopting new technologies, the greater the education, the farmer will have more ability to understand and evaluate the information on new products and processes. The better educated farmer is quicker to adopt profitable new processes and products since, for him, the expected payoff from innovation/reinvention is likely to be greater and the risk likely to be smaller. Education not only help the farmer in the generation of a new technology or innovation and also helps to determine whether a farmer decides to what extent the generated innovation/re-invention will be used. Incidentally in this study majority of the farmer innovators were having education level from under graduation to high school level.
| S. No. | Level of education | Score | Frequency | Percentage |
|---|---|---|---|---|
| 1. | Read only | 1 | 0 | 0.00 |
| 2. | Read and write | 2 | 0 | 0.00 |
| 3. | Primary Schooling | 3 | 13 | 7.92 |
| 4. | Upper primary school | 4 | 24 | 14.63 |
| 5. | High school | 5 | 40 | 24.40 |
| 6. | Intermediate | 6 | 30 | 18.29 |
| 7. | Diploma | 7. | 7 | 4.26 |
| 8. | Under graduation | 8 | 40 | 24.40 |
| 9. | Post-graduation | 9 | 10 | 6.10 |
| Total | 164 | 100.00 |
Table text extracted from the original PDF; superscript letters are shown inline. The original table image is below.
View original table image
Land holding
Based on the size of the land holding the farmer innovators were grouped in to three categories small, medium and large farmers and the distribution is given in the following table 3. From the table and figure 3 it was evident that 87.80 per cent of the respondents had larger land holding followed by medium (4.88%) and small (7.92%) land holding. Farm size is one of the first and most widely used factors on which famers capacity towards generation of innovations and reinventions has focused. Most large land holders have several plots, hence have the leverage to carry out trials or experiments in small scale on some of them and also they may cooperate or are more willing to take risks and costs associated with generation of innovation/re-invention and are looking for new niches and opportunities. Less majority of the innovators are small and marginal farmers. This results suggest that both resource rich and resource poor households generate innovation/re-invention but in this study majority of innovations and re-inventions were related to large farmers.
| S. No. | Category | No. of acres | Frequency | Percentage |
|---|---|---|---|---|
| 1. | Small farmers | Up to 2.5 acres | 13 | 7.92 |
| 2. | Medium farmers | 2.5 to 5.0 acres | 8 | 4.88 |
| 3. | Large farmers | Above 5.0 acres | 143 | 87.80 |
| Total | 164 | 100.00 |
Table text extracted from the original PDF; superscript letters are shown inline. The original table image is below.
View original table image
Farming experience
Based on the farming experience of the farmer innovators at the time of inquiry they were categorised into three groups and the distribution of the farmer innovators were presented in the table 4 From the table and figure 4 it was evident that 43.90 per cent of the respondents had medium farming experience followed by low (37.80%) and high (18.30%) farming experience. This is because majority of the respondents belonged to middle and young age group possess medium farming experience. Hence it is revealed that farmers with the farming experience will become more aware of their own agro-ecological system and they will understand how an agricultural environment could be tinkered with in order to obtain a healthier crop or more profits thus resulting in the generation of innovations and re-inventions (Chinnam Naidu. 2012) [3] .
| S. No. | Categorization | Class interval | Frequency | Percentage |
|---|---|---|---|---|
| 1. | Low experience | 5 to 23 years | 62 | 37.80 |
| 2. | Medium experience | 24 to 42 years | 72 | 43.90 |
| 3. | High experience | 42 to 60years | 30 | 18.30 |
| Total | 164 | 100.00 |
Table text extracted from the original PDF; superscript letters are shown inline. The original table image is below.
View original table image
Annual income
Based on the total annual income obtained in rupees from farming, animal husbandry, off-farm employment, subsidiary occupation etc. The farmer innovators were categorized into following three groups and the distribution of them was depicted in table 5. annual income. This is because farmers with medium and low annual income are more likely to innovate or to experiment to increase their annual income. And the less majority of the farmer innovators belonged to high annual income this might be due to the reason that farmers with good financial background can easily cope up with loss faced by them during the generation of innovation/reinvention, because of this reason it is therefore suggested that wealthier and risk preferring farmers are more likely to generate innovations/re-inventions
| S. No. | Categorization | Range | Frequency | Percentage |
|---|---|---|---|---|
| 1 | Low annual income | 50,000- 4,00,000 | 38 | 23.17 |
| 2 | Medium annual income | 4,50,000- 8,00,000 | 96 | 58.53 |
| 3 | High annual income | Above 8,00,000 | 30 | 18.30 |
| Total | 164 | 100.00 |
Table text extracted from the original PDF; superscript letters are shown inline. The original table image is below.
View original table image
Research-Extension contact
Based on the degree to which farmer innovators maintained contact with the researchers and extension personnel of agriculture and allied sectors they were categorised into following three categories and the distribution was presented in the table 6. It was observed from the table 6 that majority (77.45%) of the farmers had medium research-extension contact followed by high (18.90%) and low (3.65%) research and extension contact. Majority of the respondents belonged to medium research and extension contact reveals that they could be able to utilize the services of the extension personnels and researchers to some extent only and has occasional contact with them. To generate effective innovations and re-inventions, the farmers requires improvement in the ability to remain competitive with in an uncertain condition by utilizing the knowledge on problems and opportunities as they emerge from extension centres and research stations. Hence the results emphasize the need for strengthening the extension systems in the villages so as to make the farmers aware of the suitable practices for improving their farming practices. Therefore efforts of extension units and the research stations must be augmented in order to reach the majority of the farmers. This could be done by conducting more trainings, exposure visits, rythusadassu's, field days and farmer scientist interaction meetings etc.
| S. No. | Category | Range | Frequency | Percentage |
|---|---|---|---|---|
| 1. | Low Research-Extension contact | 18-24 | 6 | 3.65 |
| 2. | Medium Research-Extension contact | 25-31 | 127 | 77.45 |
| 3. | High Research-Extension contact | 32-38 | 31 | 18.90 |
| Total | 164 | 100.00 |
Table text extracted from the original PDF; superscript letters are shown inline. The original table image is below.
View original table image
Mass media consumption
Based on the utilization of different sources of mass media by the farmer innovators they were grouped into three categories. www.extensionjournal.com The table and figure 7 clearly indicated that majority (38.75%) of the respondents had medium mass media consumption followed by low (37.92%) and high (23.33%) mass media consumption. The results point out that majority of the respondents had medium mass media consumption this is perhaps due to the medium farming experience and medium research extension contact. So the respondents had less access to get information from different information sources and the majority of the respondents are with under graduation and high school education and they get the information mostly by listening to farm broadcasts, by viewing farm telecast, reading farm magazines and agricultural news articles. Due to their medium research and extension contact, the respondents had less exposure to kisan melas, rythusadassu's, agricultural exhibitions, tours and field trips. Therefore the result implies that the extension functionaries in the village level must be strengthened and make the communication channels to be exposed by the farmers.
Achievement motivation
Based on the farmer innovators achievement motivation for the generation of innovations and re-inventions they were categorised into following three categories and the distribution was presented in the table 8. From the table and figure 8 it was observed that majority of the respondents 64.02 per cent had medium achievement motivation followed by high (25.00%) and low (21.67%) achievement motivation. It was evident from the results that majority of the respondents had medium to high achievement motivation. This might be due to the fact that majority of respondents are middle-age grouped, literate and large farmers with medium farming experience had desire to try out new experiments to generate innovations and reinventions in their farming practices to gain more yields than conventional practices. Thus the respondents have high determination and ambition to achieve certain things in life, and the respondents feels that what they know is not enough and there is need for learning new skills for better management of farm and home.
| S. No. | Category | Range | Frequency | Percentage |
|---|---|---|---|---|
| 1. | Low Achievement motivation | 17-19 | 27 | 16.46 |
| 2. | Medium Achievement motivation | 20-22 | 105 | 64.02 |
| 3. | High Achievement motivation | 23-25 | 32 | 19.51 |
| Total | 164 | 100 |
Table text extracted from the original PDF; superscript letters are shown inline. The original table image is below.
View original table image
Creativity
Depending on the creativity possessed by the farmer innovators they were categorized into low, medium and high creativity categories and their distribution was depicted in the table 9. 9 reveals that majority (51.83%) of the respondents had high creativity followed by medium (35.36%) and low (12.81%) (Neelima. 2005) [5] . Majority of the respondents had high to medium creativity this is due to the fact that creativity is more for the younger generations when compared to the older ones and the results suggests that majority of the respondents are middle age grouped with medium farming experience. It can be concluded that mostly middle aged group farmers are involved in the profession of Agriculture rather than younger ones whose focus is on education and has high creativity in the generation of innovations and re-inventions. Majority of the farmers are literate with medium to high achievement motivation and to cope up with todays markets and economy farmers are coming up with creative solutions to their problems. Ability to innovate increases generally with urbanisation of the individuals, but the results indicates that majority of the respondents were living in the native and surrounding villages and few were living in mandal and district headquarters. This might be due to the reason that urbanisation of the individuals makes them to change their profession from agriculture to other sectors. Thus it could be concluded that farmers through their repeated experience and experiments in their own farms has more creativity compared to others. Majority of the respondents possess creative traits because possession of the creative traits helped the farmers to think in more logical and creative way. Thus these traits helped the respondents for the generation of innovations and re-inventions providing a leverage to conduct many experiments in their farms. And it was revealed from the results that farmers are generating innovations/re-inventions that suit their emerging needs and needs of their community in a creative manner.
| S. No. | Category | Range | Frequency | Percentage |
|---|---|---|---|---|
| 1. | Low creativity | 12-17 | 21 | 12.81 |
| 2. | Medium creativity | 18-23 | 58 | 35.36 |
| 3. | High creativity | 24-29 | 85 | 51.83 |
| Total | 164 | 100.00 |
Table text extracted from the original PDF; superscript letters are shown inline. The original table image is below.
View original table image
Risk bearing ability
Based on the ability of the farmer innovators in facing the risk during the generation of innovations and re-inventions they were categorized into low, medium and high risk bearing ability and the distribution of them was given in the table 10. It could be seen from the table and figure 10 that majority (60.83%) of the farmers had high risk bearing ability followed by medium (39.17%) and low (23.17%) risk bearing ability. This is due to the fact that farmers were with medium to high achievement motivation and enthusiasm with high creativity and this helped them to cope up with the risks faced during the generation of innovation/re-invention. Thus it is concluded from the study that risk preferring farmers are more likely to innovate.
| S. No. | Category | Range | Frequency | Percentage |
|---|---|---|---|---|
| 1. | Low Risk bearing ability | 16-17 | 38 | 23.17 |
| 2. | Medium Risk bearing ability | 18-19 | 62 | 37.80 |
| 3. | High Risk bearing ability | 20-21 | 64 | 39.03 |
| Total | 164 | 100.00 |
Table text extracted from the original PDF; superscript letters are shown inline. The original table image is below.
View original table image
Scientiscism Vs Fatalism
Based on the scientiscism vs fatalism of the farmer innovators they were grouped into low, medium and high categories and the distribution was given in the table 11. From the table and figure 11 it could be observed that majority (76.83%) of the respondents had medium scientiscism vs fatalism followed by high (15.24%) and low (7.93%). This is because majority of the farmers were middle age grouped, literate with medium farming experience and medium research and extension contact. It is difficult for them to exaggerate the achievements of modern science and technology with the conventional practices in agriculture but to tackle persisting pest, disease and ecological imbalance farmers are coming up with other routes of investigation or experimentation, i.e., generation of innovation/ reinvention in particular.
| S. No. | Category | Range | Frequency | Percentage |
|---|---|---|---|---|
| 1 | Low Scientiscism vs Fatalism | 22-23 | 13 | 7.93 |
| 2 | Medium Scientiscism vs Fatalism | 24-25 | 126 | 76.83 |
| 3 | High Scientiscism vs Fatalism | 26-27 | 25 | 15.24 |
| Total | 164 | 100.00 |
Table text extracted from the original PDF; superscript letters are shown inline. The original table image is below.
View original table image
Progressivism
Depending on the progressive nature of the farmer innovators for generating innovations and re-invention they were classified in to low, medium and high progressivism and their distribution was presented in the table 12. www.extensionjournal.com From the table and figure 12 it was evident that majority (63.42%) of the respondents had medium progressivism followed by high (23.78) and low (12.80) progressivism. Majority of the respondents belonged to the medium progressivism, this might be due to the reason that many of the farmers belonged to middle age group with medium farming experience and medium scientisicm vs fatalism.
| S. No. | Category | Range | Frequency | Percentage |
|---|---|---|---|---|
| 1. | Low Progressivism | 9-10 | 21 | 12.80 |
| 2. | Medium Progressivism | 11-12 | 104 | 63.42 |
| 3. | High Progressivism | 13-14 | 39 | 23.78 |
| Total | 164 | 100.00 |
Table text extracted from the original PDF; superscript letters are shown inline. The original table image is below.
View original table image
Because of this reason farmers are receptive to modern values and practices to some extent only and are more interested in trying out different new experiments to meet their needs or problems.
Research orientation
Based on the research orientation of the farmer innovators for generation innovations and re-inventions they were categorized in to three categories low, medium and high and the distribution of the respondents was presented in the table 13. The data in the table and figure 13 revealed that majority (56.25%) of the respondents had high research orientation followed by medium (28.33%) and low (15.42%) research orientation. The probable reason might be that majority of them were large and literate farmers with high creativity which could have led them to gain more knowledge on the identified needs and problems and their level of knowledge has helped them to do more research for generating solution to the identified problems (Ingrid 2014) [4] .
| S.No. | Category | Range | Frequency | Percentage |
|---|---|---|---|---|
| 1. | Low Research orientation | 27-29 | 15 | 9.15 |
| 2. | Medium Research orientation | 30-32 | 40 | 24.40 |
| 3. | High Research orientation | 32-35 | 109 | 66.45 |
| Total | 164 | 100.00 |
Table text extracted from the original PDF; superscript letters are shown inline. The original table image is below.
View original table image
Conclusion
From the above findings of the study it could be concluded that majority of the respondents were middle to young aged, educated from under graduation to high schooling, possessing larger land holdings, found to have medium farming experience, medium annual family income, having medium research and extension contact and mass media consumption, having medium achievement motivation, have high creativity and risk bearing ability, having low to medium scientiscism vs fatalism, medium progressivism and high research orientation.
There is no doubt that farmer innovations and re-inventions are essential in this rapidly changing economic environment. The innovations and re-inventions by the farmers range from experimenting with new ideas, modifying or adding value to existing or external practices www.extensionjournal.com to complete discovery of better farming practices. Farmers have been recognised as one of the key sources of innovation generation and there are calls for strengthening their innovation capacities. Based on profile characteristics of the farmer innovators this study analyses the innovation generation activities of farmers in the selected sample area.
And the results suggest that a participatory extension approach by considering these profile characteristics of the farmers innovation systems perspective, is a key determinant of innovation capacity in farmers. This is possible because participants are likely to be empowered and also gain problem-solving and analytical skills which are essential for generation of innovations and re-inventions. Farmer innovations and re-inventions are, in fact, a way of life for the farmers to fight and adjust against natural resource degradation, declining factor productivity, increase in cost of inputs and emerging climate change which all take heavy toll. Despite this, their contribution in the development of farm sector has not properly been recognized for verification, refinement and large scale adoption. Therefore, it is time now to recognize farmer innovations and re-inventions to ensure much greater participation of farmers for making farming more remunerative and diversified. To ensure this, a platform has to be provided to the farm innovators to interact with the scientists and planners for better understanding and appreciate their efforts.
Reference
Reference
Figures and tables from the paper
| S. No. | Category | Range | Frequency | Percentage |
|---|---|---|---|---|
| 1. | Low Mass media consumption | 34-37 | 52 | 31.70 |
| 2. | Medium Mass media consumption | 38- 41 | 72 | 43.90 |
| 3. | High Mass media consumption | 42-45 | 40 | 24.40 |
| Total | 164 | 100.00 |
Table text extracted from the original PDF; superscript letters are shown inline. The original table image is below.