
Research article · 2023 · Full text
International Journal of Agriculture Extension and Social DevelopmentA study on price behaviour of reeling cocoons in Karnataka
Volume 6(1) · Pages 101–106 · DOI: 10.33545/26180723.2023.v6.i1b.182 ↗
Research areasSilkworms and Sericulture ResearchAgricultural Economics and Practices
Abstract
Author-writtenIn recent years many of the sericulture farmers were afraid because of not stabilized cocoon price. In this concern we selected Ramanagara cocoons market and reelers to study the reasons behind the cocoon price crisis. As per our study the price of cocoons has been influencing by many factors. Such as, prices of international (Chinese) and domestic silk, demand for silk products of particular season/period, quantum of the arrival of a cocoon, weather conditions, Government policies etc. To overwhelm these problems it is necessary to strengthen the Government marketing agencies in the cocoon and the raw silk buying. It is better to use the technologies to inform the forecasting prices to farmers as well as reelers in advance. Try to establish cocoon banks and providing minimum support price to farmers. Reelers should not be allowed to procure more than their requirement. These solutions will help to save the sericulture farmers from severe cocoon price crises.
Summary
Source-checkedPlain-language reading of the full paper, prepared with AI and checked against the text. Each point links to the authors' own words.
Why it matters
- India is a major global player in the silk industry, accounting for 36.80% of the world's silk production. View evidence ↗
- The sericulture enterprise is a critical livelihood source for over 9.2 million people, primarily in rural areas. View evidence ↗
- Cocoon price crashes can lead farmers to uproot perennial mulberry crops, making it difficult to return to sericulture even after prices stabilize. View evidence ↗
What they did
- The researchers used primary data collected from reelers via personal contact and secondary monthly data from the Central Silk Board, state sericulture department, and Ramanagaram markets. View evidence ↗
- A survey was conducted using a predefined questionnaire with 60 reelers. View evidence ↗
- A multiplicative model was used to calculate monthly seasonal indices for cocoons and silk transacted at the Ramanagaram markets. View evidence ↗
What they found
- There is a consistent negative correlation between cocoon arrivals and prices for both Bivoltine (r = -0.30 to -0.64) and Cross breed (r = -0.75 to -0.83) cocoons. View evidence ↗
- A sharp price drop occurred in 2018-19: only 28.68% of Bivoltine and 8.09% of Cross breed lots were priced above 300 Rs, compared to 98% and 89.50% respectively in 2017-18. View evidence ↗
- In 2018-19, raw silk imports reached a peak of 1383 Cr while exports dropped to 1650 Cr, contributing to reduced domestic demand and lower cocoon prices. View evidence ↗
- The majority of reelers (80-85%) transact raw silk outside the government-run KSMB, allowing non-governmental organizations to influence price fluctuations. View evidence ↗
- Although medium-scale reelers are the most common (40-45%), large-scale reelers often dictate prices by over-purchasing when market prices are low. View evidence ↗
What it means
- The authors conclude that government marketing agencies must be strengthened to actively participate in the market and set reference prices to stabilize cocoon costs. View evidence ↗
- The authors recommend establishing cocoon banks to procure cocoons during distress periods and providing a minimum support price to farmers. View evidence ↗
Visual summary
1 visualsIllustrations explain the paper; they do not show study data.
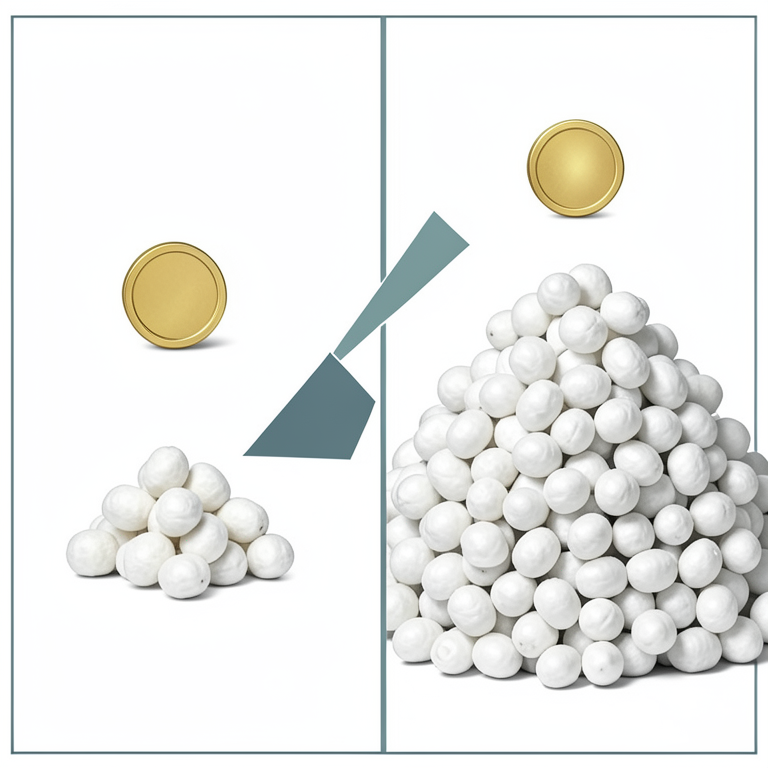
Supply-Price Relationship
AI-generated conceptual illustration (silkworm cocoons). It explains the idea and does not show study data.
View source evidence ↗Figures & tables
From the original paper Table 1
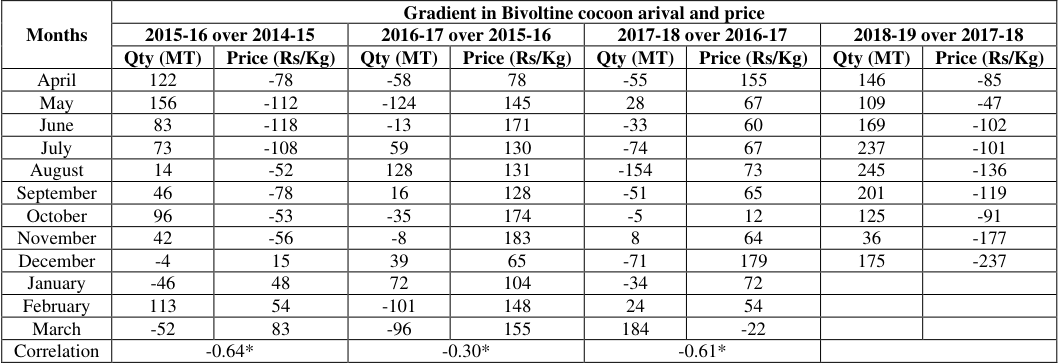 Table 2
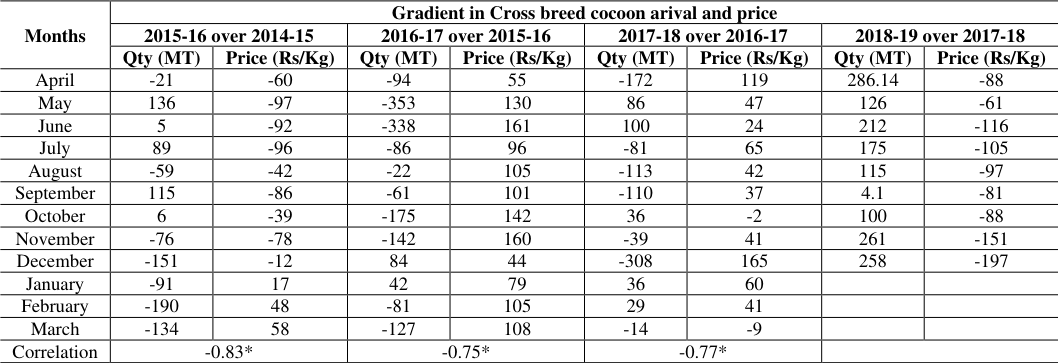 Table 3
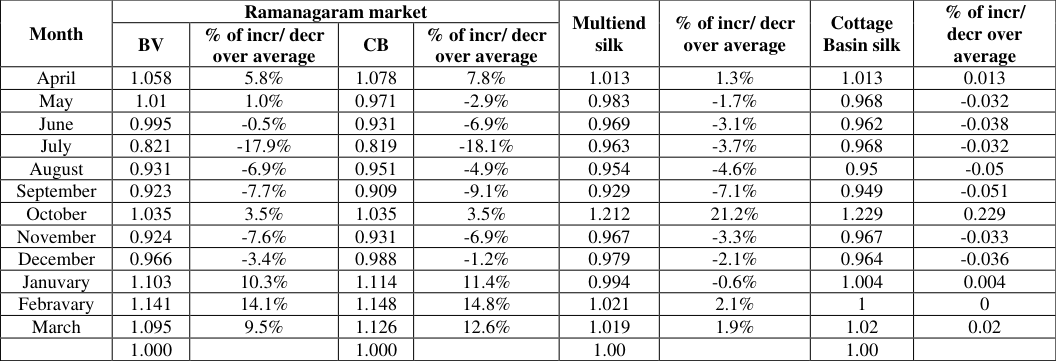 Table 4
 Table 5
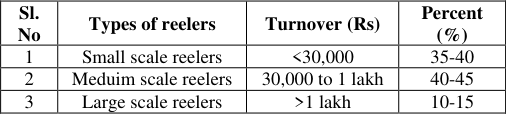 Table 6
Introduction
The Indian silk industry plays a leading role in the global silk market, by contributing 36.80% of global silk production (International Sericulture Commission 2020). It is considered as the epitome of distinctiveness in silk production for producing all types of silk, i.e., Mulberry and Vanya (Eri, Muga, and Tasar). The industry produces around 23,896 MT of mulberry, 2,689 MT of tasar, 6,946 MT of eri, and 239 MT of muga silk to meet the domestic requirement. India's silk export worth are approximately US$ 360 million, of which 70% are natural silk yarn and fabrics, 13% are made-ups, and 26% are garments (Anonymous, 2022) [5] . With all these attributes serienterprise holds the interests of over 9.2 million people, mostly from rural areas, dependent on the sector for their livelihoods and earnings. But the profitability of serienterprise depends on the production of quality mulberry leaves and their conversion into quality cocoons at an economic cost (Ganga and Chetty, 1991) [6] . And also the growth and expansion of any enterprise depends on the profit and pricing of their industrial products marketed. As a result, farm product pricing is an essential instrument that influences the farmer's decision to select an enterprise and allocate land and resources to those operations. Since the silk business is a 'commercial industry,' the gross value of silk fabrics flows as follows: 56.8% to the cocoon grower, 6.8% to the reeler, 9.1% to the twister, 10.7% to the weaver, and 16.6% to the trade (Mahanta and Komal, 2022) [4] . Because cocoon growers are the key stakeholders in the seri-enterprise, the price of cocoon has a significant impact on their output. Recent research has also found a link between sericulture producers' reactions to price swings (Roopa and Murthy, 2015) [2] . But, cocoon prices crash once every three or four years for a brief period, causing farmer unrest. Because of the price drop, producers are confronted with the decision of whether to continue or discontinue sericulture. Since mulberry is a perennial crop, once uprooted by the farmers due to the crash in cocoon prices, it is very difficult to bring the farmers back into sericulture after the stabilization of prices. It is therefore necessary to understand the price behavior of cocoons and the factors influencing wide fluctuations in cocoon prices in order to take the necessary measures to stabilize the cocoon price. In this context, the present study was undertaken to analyze the price behavior of cocoon by keeping the following objectives. 1. to identify the factors influencing the fluctuation of prices, 2. to analyze the trend in arrivals and prices of cocoon in the Ramanagaram market of Karnataka.
Materials and Methods
Materials and Methods
Methodology
The primary data for the study was collected directly from reelers by personal/ individual contact method.
Cocoon production and transaction effect on reeling cocoons market arrival in the Ramanagaram market
The table-1 depicts the percentage of arrival of reeling cocoons both BV and CB cocoons into the Ramanagaram market against production was correlated. The both the parameters for Bivoltine cocoon of positively correlated with the correlation coefficient value r = 0.402. Similarly there is also existence of positive correlation r = 0.602 between total transaction of cocoon to its arrival percentage for cross breed cocoon. Therefore, in order to ascertain how the arrival influence the cocoon price, cocoon arrival and cocoon price in the month of the year compared to the same months of the previous year. Arrival of bivoltine and cross breed cocoons at Ramanagaram in the various months of the year compared to the same months of the previous year. The correlation between gradient in cocoon arrival and price for Bivoltine during 2015-16 over 2014-15 was r =-0.64, similarly for during 2016-17over 2015-16 was r = -0.30 and during 2017-18 over 2016-17 was r = -0.61. The correlation between gradient in cocoon arrival and price for Cross breed during 2015-16 over 2014-15 was r =-0.83, similarly for during 2016-17 over 2015-16 was r= -0.75 and during 2017-18 over2016-17 was r= -0.77. It is clear that there was an increase in the arrival of both bivoltine and cross-breed cocoons during all the months of 2018-19 compared to the corresponding months of 2017-18, has reduce the cocoon price drastically during 2018-19. And also, the study reveals that there is a negative relationship between the price increase of cocoons and their arrival on the markets each year (Table 2 &3). Therefore, it is clear that cocoon supplies decreases in the market, the price of cocoon in the market increases, and vice versa. Similar report was made that the price of cocoon is totally determined by the arrival of cocoon and demand for the product in the market (& Vijaysanthi, 2011). [1] Lot size and price band at Ramanagaram cocoon market 2 and3). The graph-4 depicts that year wise raw silk import and export trend from 2014-15 to 2018-19. Importing of raw silk is increasing gradually and in the year 2018-19 is 1383(Cr), it is the highest when compare to previous years. Surprisingly, the graph shows the exporting of silk goods is also decreasing by year on year. And in in the year 2018-19 exporting of silk goods only 1650(Cr) which was very less when compare to previous years. Hence, increasing in domestic production, increasing in import of raw silk and decreasing in export of silk goods in the year 2018-19 decrease demand in market. Therefore the cocoon price reduction happens in the domestic market in 2018-19. As a consequence, government should take step-up in reducing the import of international (Chinese) silk for price stabilization in the domestic markets. Similar suggestion was given for price stabilization in cocoon markets of Tamil Nadu by Selvaraj & Vijaysanthi, (2011) [1] . The present survey was conducted for 60 reelers by interview method using a predefined questionnaire with reelers. According to this survey, only 15-20% of the reelers will transact the raw silk through KSMB, remaining 80-85% of the reelers will transact the raw silk without involvement of government and it means the transacting the raw silk outside the KSMB (Graph 5). This will leads to fixing and controlling of price for raw silk by non-governmental organization. Therefore, raw silk transaction by other than government become one of the factor which has influence in price fluctuation. According to the survey maximum of reelers are medium scale reelers (40-45%), but the price is fixed/ decided by large scale reelers, because they purchase more than their requirement when the prices are very low in the cocoon market. Therefore, each reeler should be allowed to bid any lot with unique price only. He should not be allowed to change the price to downsize for a lot which prevent price fluctuation to certain extent.
| Months | Gradient in Bivoltine cocoon arival and price | — | — | — | — | — | — | — |
|---|---|---|---|---|---|---|---|---|
| 2015-16 over 2014-15 | 2016-17 over 2015-16 | 2017-18 over 2016-17 | 2018-19 over 2017-18 | |||||
| Qty (MT) | Price (Rs/Kg) | Qty (MT) | Price (Rs/Kg) | Qty (MT) | Price (Rs/Kg) | Qty (MT) | Price (Rs/Kg) | |
| April | 122 | -78 | -58 | 78 | -55 | 155 | 146 | -85 |
| May | 156 | -112 | -124 | 145 | 28 | 67 | 109 | -47 |
| June | 83 | -118 | -13 | 171 | -33 | 60 | 169 | -102 |
| July | 73 | -108 | 59 | 130 | -74 | 67 | 237 | -101 |
| August | 14 | -52 | 128 | 131 | -154 | 73 | 245 | -136 |
| September | 46 | -78 | 16 | 128 | -51 | 65 | 201 | -119 |
| October | 96 | -53 | -35 | 174 | -5 | 12 | 125 | -91 |
| November | 42 | -56 | -8 | 183 | 8 | 64 | 36 | -177 |
| December | -4 | 15 | 39 | 65 | -71 | 179 | 175 | -237 |
| January | -46 | 48 | 72 | 104 | -34 | 72 | ||
| February | 113 | 54 | -101 | 148 | 24 | 54 | ||
| March | -52 | 83 | -96 | 155 | 184 | -22 | ||
| Correlation | -0.64* | -0.30* | -0.61* |
Table text extracted from the original PDF; superscript letters are shown inline. The original table image is below.
View original table image
Gradient (Incresing/Decreasing) in bivoltine and cross breed reeling cocoon month-wise between current and previous year transacted at Ramanagaram
Gradient (Incresing/Decreasing) in bivoltine and cross breed reeling cocoon month-wise between current and previous year transacted at Ramanagaram
Seasonal indices of reeling cocoons and raw silk
Seasonal indices of reeling cocoons and raw silk
Raw silk Import and Export in India
Raw silk Import and Export in India
Raw silk transaction by reelers of Ramanagaram District
Raw silk transaction by reelers of Ramanagaram District
Reelers turnover of Ramanagaram District
Reelers turnover of Ramanagaram District
Conclusion
The study reveles that the price fluctuation of cocoons has been influencing by many factors. Such as, prices of international (Chinese) and domestic silk, demand for silk products of particular season/period, quantum of the arrival of a cocoon weather conditions, Government policies etc. Therefore, strengthening Government marketing agencies for more active participation in the raw silk market is mandatory. Moreover, the purchase prices of these agencies should fix the reference or basic price in the market, leading in price stabilization. Furthermore, Marketing information/intelligence/forecasting of prices and arrivals is very essential for the reeling units as well as farmers as this will assist them in planning production and marketing of their produce (Halagundegowda et al., 2019) [3] . Establishment of cocoon banks and procure cocoons from the farmers during distress time and providing minimum support price. If all these factor consider and rectified the farmers may show positive attitude towards sericulture.
Figures and tables from the paper
| Years | Bivoltine and Cross breed cocoons | — | — | — |
|---|---|---|---|---|
| Total production | Total Arrival % | Total transaction* | Total Arrival % | |
| 2014-15 | 68298 | 77.5 | 53535 | 77.5 |
| 2015-16 | 70436 | 76.3 | 53542 | 76.3 |
| 2016-17 | 67509 | 74.1 | 47030 | 74.1 |
| 2017-18 | 66017 | 66.4 | 43536 | 66.4 |
| 2018-19(Apr -Dec) | 46170 | 70.7 | 34198 | 70.7 |
| r value | 0.402 | 0.602 | ||
| Correlation type | positive | Positive |
Table text extracted from the original PDF; superscript letters are shown inline. The original table image is below.
View original table image
| Months | Gradient in Cross breed cocoon arival and price | — | — | — | — | — | — | — |
|---|---|---|---|---|---|---|---|---|
| 2015-16 over 2014-15 | 2016-17 over 2015-16 | 2017-18 over 2016-17 | 2018-19 over 2017-18 | |||||
| Qty (MT) | Price (Rs/Kg) | Qty (MT) | Price (Rs/Kg) | Qty (MT) | Price (Rs/Kg) | Qty (MT) | Price (Rs/Kg) | |
| April | -21 | -60 | -94 | 55 | -172 | 119 | 286.14 | -88 |
| May | 136 | -97 | -353 | 130 | 86 | 47 | 126 | -61 |
| June | 5 | -92 | -338 | 161 | 100 | 24 | 212 | -116 |
| July | 89 | -96 | -86 | 96 | -81 | 65 | 175 | -105 |
| August | -59 | -42 | -22 | 105 | -113 | 42 | 115 | -97 |
| September | 115 | -86 | -61 | 101 | -110 | 37 | 4.1 | -81 |
| October | 6 | -39 | -175 | 142 | 36 | -2 | 100 | -88 |
| November | -76 | -78 | -142 | 160 | -39 | 41 | 261 | -151 |
| December | -151 | -12 | 84 | 44 | -308 | 165 | 258 | -197 |
| January | -91 | 17 | 42 | 79 | 36 | 60 | ||
| February | -190 | 48 | -81 | 105 | 29 | 41 | ||
| March | -134 | 58 | -127 | 108 | -14 | -9 | ||
| Correlation | -0.83* | -0.75* | -0.77* |
Table text extracted from the original PDF; superscript letters are shown inline. The original table image is below.
View original table image
| Month | Ramanagaram market | — | — | — | Multiend silk | % of incr/ decr over average | Cottage Basin silk | % of incr/ decr over average |
|---|---|---|---|---|---|---|---|---|
| BV | % of incr/ decr over average | CB | % of incr/ decr over average | |||||
| April | 1.058 | 5.8% | 1.078 | 7.8% | 1.013 | 1.3% | 1.013 | 0.013 |
| May | 1.01 | 1.0% | 0.971 | -2.9% | 0.983 | -1.7% | 0.968 | -0.032 |
| June | 0.995 | -0.5% | 0.931 | -6.9% | 0.969 | -3.1% | 0.962 | -0.038 |
| July | 0.821 | -17.9% | 0.819 | -18.1% | 0.963 | -3.7% | 0.968 | -0.032 |
| August | 0.931 | -6.9% | 0.951 | -4.9% | 0.954 | -4.6% | 0.95 | -0.05 |
| September | 0.923 | -7.7% | 0.909 | -9.1% | 0.929 | -7.1% | 0.949 | -0.051 |
| October | 1.035 | 3.5% | 1.035 | 3.5% | 1.212 | 21.2% | 1.229 | 0.229 |
| November | 0.924 | -7.6% | 0.931 | -6.9% | 0.967 | -3.3% | 0.967 | -0.033 |
| December | 0.966 | -3.4% | 0.988 | -1.2% | 0.979 | -2.1% | 0.964 | -0.036 |
| Januvary | 1.103 | 10.3% | 1.114 | 11.4% | 0.994 | -0.6% | 1.004 | 0.004 |
| Febravary | 1.141 | 14.1% | 1.148 | 14.8% | 1.021 | 2.1% | 1 | 0 |
| March | 1.095 | 9.5% | 1.126 | 12.6% | 1.019 | 1.9% | 1.02 | 0.02 |
| 1.000 | 1.000 | 1.00 | 1.00 |
Table text extracted from the original PDF; superscript letters are shown inline. The original table image is below.
View original table image
| Seasonal Index | Seasonal month | — | — |
|---|---|---|---|
| Bivoltine reeling coccons | Cross breed reeling cocoon | Raw silk | |
| Less than 0.9 (low season) | July | July | - |
| 0.9-1.0 (moderate season) | June, Aug, Sep, Nov, Dec | May, Jun, Aug, Sep, Nov, Dec | May, Jun, Aug, Sep, Nov, Dec, Jan |
| More than 1 (high season) | Apr, May, Oct, Jan, Feb, Mar | Apr, Oct, Jan, Feb, Mar | Mar, Apr, Oct, Feb |
Table text extracted from the original PDF; superscript letters are shown inline. The original table image is below.
View original table image
| Sl. No | Types of reelers | Turnover (Rs) | Percent (%) |
|---|---|---|---|
| 1 | Small scale reelers | <30,000 | 35-40 |
| 2 | Meduim scale reelers | 30,000 to 1 lakh | 40-45 |
| 3 | Large scale reelers | >1 lakh | 10-15 |
Table text extracted from the original PDF; superscript letters are shown inline. The original table image is below.
View original table image
References
4 in the original paper- Selvaraj A, Vijaysanthi KR. A Study on the Price Behavior of Cocoon and Raw Silk in Tamil Nadu. IUP Journal of Agricultural Economics. 2011;8(1):28.
- Roopa H, Murthy C. Trends in arrivals and prices of cocoons in Shirahatti market at Haveri District. International Journal of Commerce and Business Management. 2015;8(1):131-134.
- Halagundegowda GR, Kantharaju BM, Kumaresan P. Modeling and Forecasting of Mulberry Cocoon Prices in Ramanagaram and Siddlaghatta Markets of Karnataka, International Journal of Pure and Applied Bioscience. 2019;7(5):531-541. DOI: http://dx.doi.org/10.18782/2320-7051.774
- Mahanta DK, Komal J. Sericulture and its Salient Features. Vigyan Varta. 2022;3(10):105-110.