
Research article · 2022 · Full text
International Journal of Research in AgronomyEstimation of Genotype X Environmental Interaction and Grain Yield Stability in Small Red Common bean (Phaseolus vulgaris L.) Genotypes at West and Kellem Wallaga Zones of Western Oromia, Ethiopia
Volume 5(2) · Pages 183–189 · DOI: 10.33545/2618060x.2022.v5.i2c.164 ↗
Research areasGenetics and Plant BreedingAgricultural pest management studiesPlant pathogens and resistance mechanisms
Abstract
Author-writtenTwelve small red common bean (Phaseolus vulgaris L.) genotypes were evaluated for grain yield and yield stability at seven environments of Haro Sabu Agricultural Research Center in 2015-2017. The objectives of the study were to identify and select high-yielding and stable genotypes. Randomized Complete Block Design (RCBD) with three replications, consisting of a net plot area of 1.6mx3m was used. Based on analysis of variance, all observed traits except for days to maturity, branches/ plant, and seed/ pod showed significant differences in genotypes. The main effect of environment exerted a significant effect on all traits. The interaction effect of genotype x environment significantly influenced all traits except for plant height, branch/plant, and seed/pod. Moreover, the results of this study indicated the existence of genetic variation among genotypes for most of the observed traits. The stability of genotypes was confirmed by AMMI stability value (ASV), Genotype Selection Index (GSI), and GGE biplot. From the total variation; 17.48%, 43.68%, 17.31%, 3.13%, and 18.39% were obtained due to genotype, environment, G×E, block, and error, respectively. The higher mean of 2.01 tons/ha (G3), 1.99 tons/ha (G2), 1.94 tons/ha (G1), and 1.94 tons/ha (G7) were recorded for grain yield. The grain yield advantage of 24.07(G3), 22.84 (G2), 19.75 (G1), and 19.75 (G7) were estimated over the standard check, SER 119 which had a mean of 1.62 tons/ha. ASV, GSI, and GGE Biplot confirmed that G3, G2, G1, and G7 were high yielders, more adapted, stable, and suggested for release in West and Kellem Wallaga Zones.
Summary
Source-checkedPlain-language reading of the full paper, prepared with AI and checked against the text. Each point links to the authors' own words.
Why it matters
- Common bean is a critical crop for food security and a vital source of income for resource-poor small-scale farmers in Ethiopia. View evidence ↗
- While management practices help, genetic improvement is considered the primary way to significantly increase common bean yields in marginal areas. View evidence ↗
What they did
- Twelve small red common bean genotypes were tested across seven environments at the Haro Sabu Agricultural Research Center between 2015 and 2017. View evidence ↗
- The experiment used a Randomized Complete Block Design (RCBD) with three replications and a net plot size of 4.8 square meters. View evidence ↗
- Stability and adaptability were analyzed using the AMMI model, GGE biplots, and the Genotype Selection Index (GSI). View evidence ↗
What they found
- Significant genetic variation existed among the genotypes for most traits, except for days to maturity, branches per plant, and seeds per pod. View evidence ↗
- Genotypes G3, G2, G1, and G7 achieved the highest mean grain yields, with G3 leading at 2.01 tons/ha. View evidence ↗
- Compared to the standard check SER 119 (1.62 tons/ha), G3 showed the highest yield advantage at 24.07%, followed by G2 (22.84%), and G1 and G7 (both 19.75%). View evidence ↗
- The environment had the largest impact on grain yield variation (43.68%), followed by error (18.39%), genotype x environment interaction (17.31%), and genotype (17.48%). View evidence ↗
- Based on the AMMI stability value (ASV), G11 was identified as the most stable genotype, though it did not necessarily have the highest yield. View evidence ↗
- GGE biplot analysis showed that G3 performed best in the HS-2017, HS-2016, and GL-2017 environments, while G7 was superior in KU-2017, SG-2015, and SH-2017. View evidence ↗
- G2 and G4, followed by G3, G1, and G7, were identified as ideal genotypes because they balanced both high mean grain yield and yield stability. View evidence ↗
What it means
- The authors recommend genotypes G1, G2, G3, and G7 for release as new varieties in the West and Kellem Wallaga Zones of Western Oromia and similar agro-ecological areas. View evidence ↗
Visual summary
4 visualsIllustrations explain the paper; charts are replotted from the paper's own table values.
Sources of Yield Variation
AI-generated conceptual illustration (Small red common bean plants (Phaseolus vulgaris L.)). It explains the idea and does not show study data.
View source evidence ↗
The Ideal Genotype Balance
AI-generated conceptual illustration (Small red common bean plants (Phaseolus vulgaris L.)). It explains the idea and does not show study data.
View source evidence ↗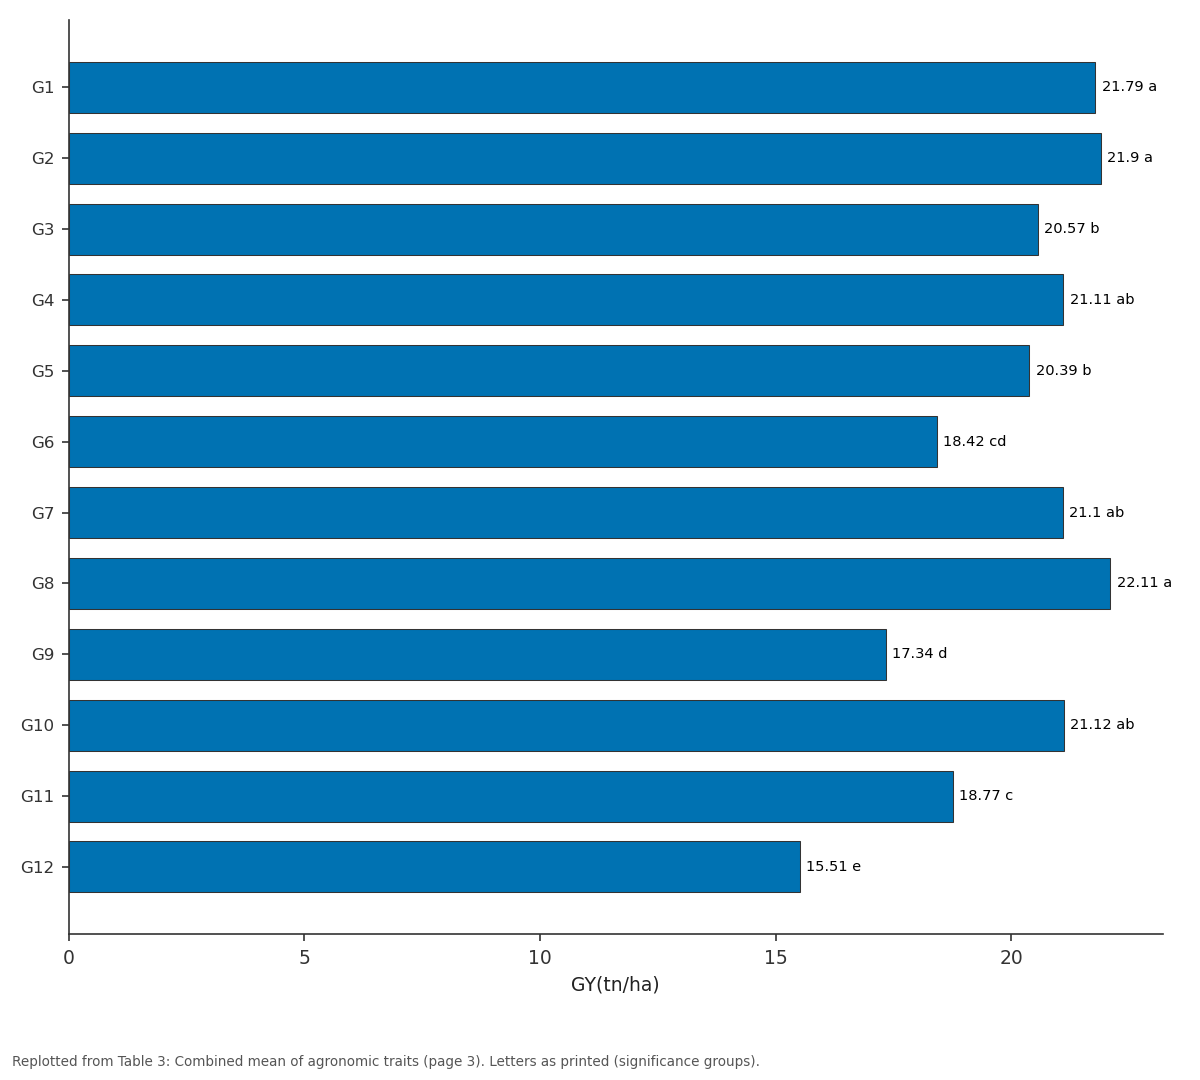
HSW: G1 vs G2 vs G3 vs G4 vs G5
Replotted from Table 3 (page 3) of the original paper. Every bar is the paper's own table value.
View source evidence ↗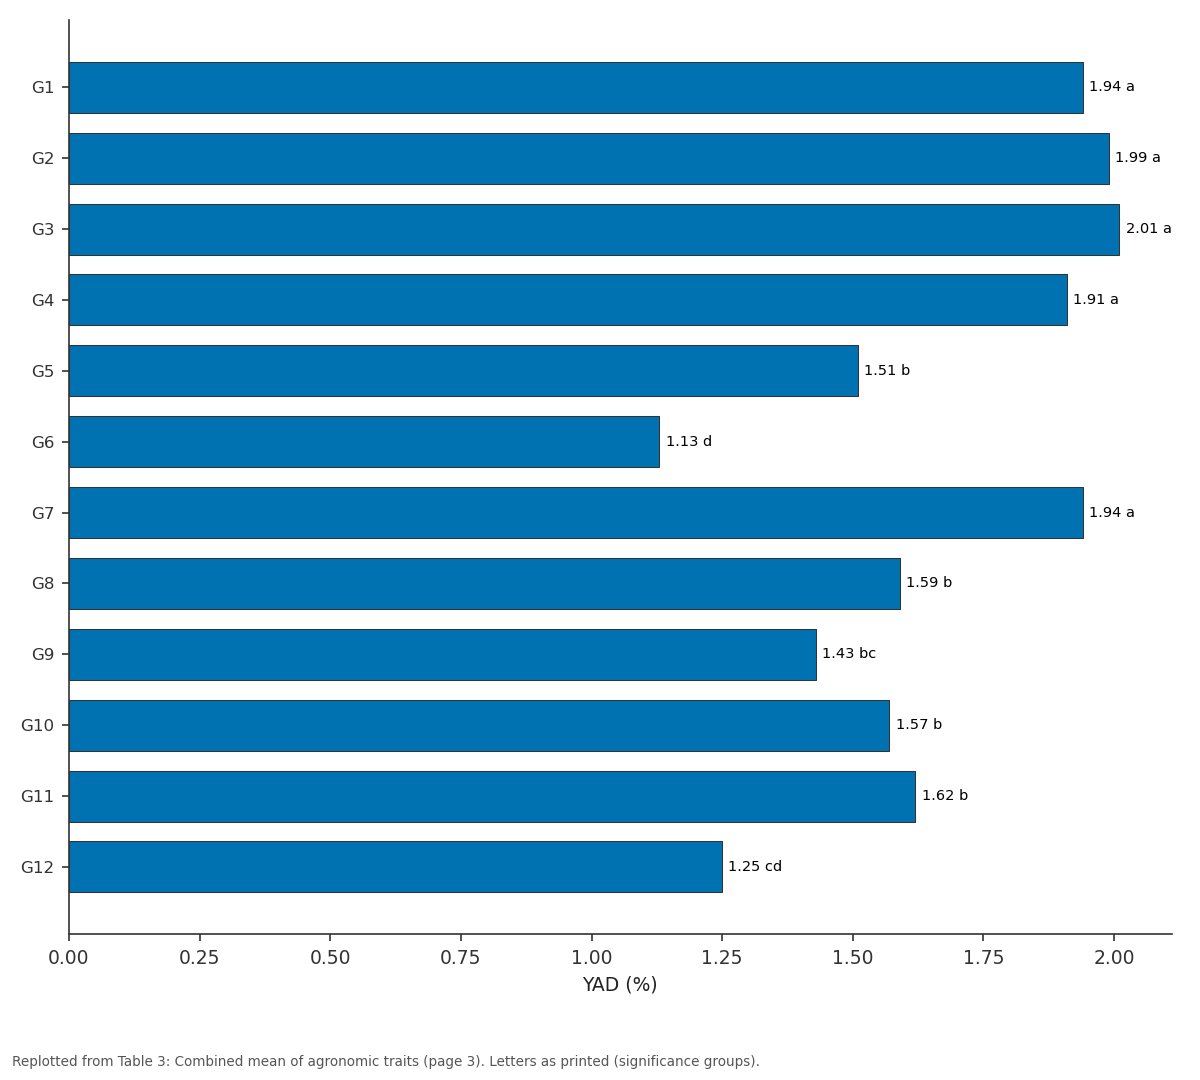
GY(tn/ha): G1 vs G2 vs G3 vs G4 vs G5
Replotted from Table 3 (page 3) of the original paper. Every bar is the paper's own table value.
View source evidence ↗Figures & tables
From the original paper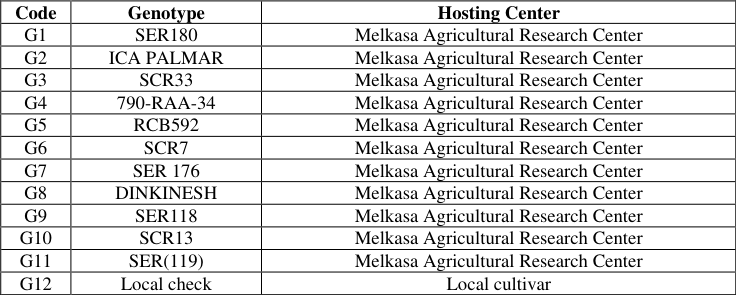 Table 1
 Table 2
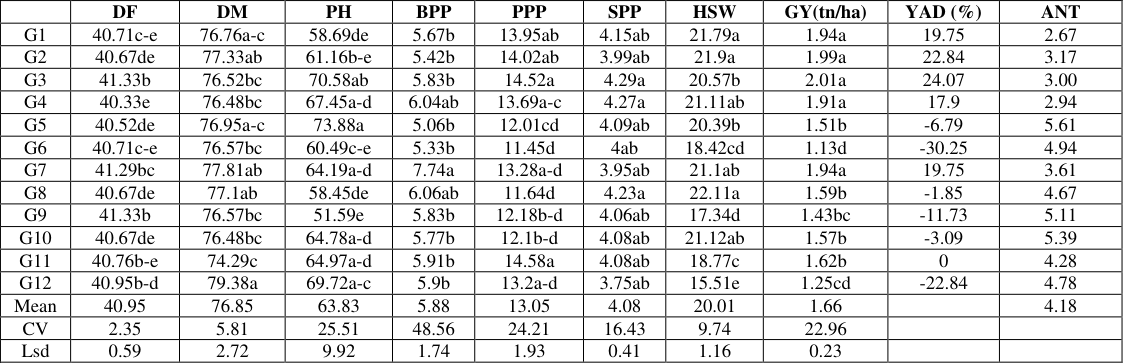 Table 3
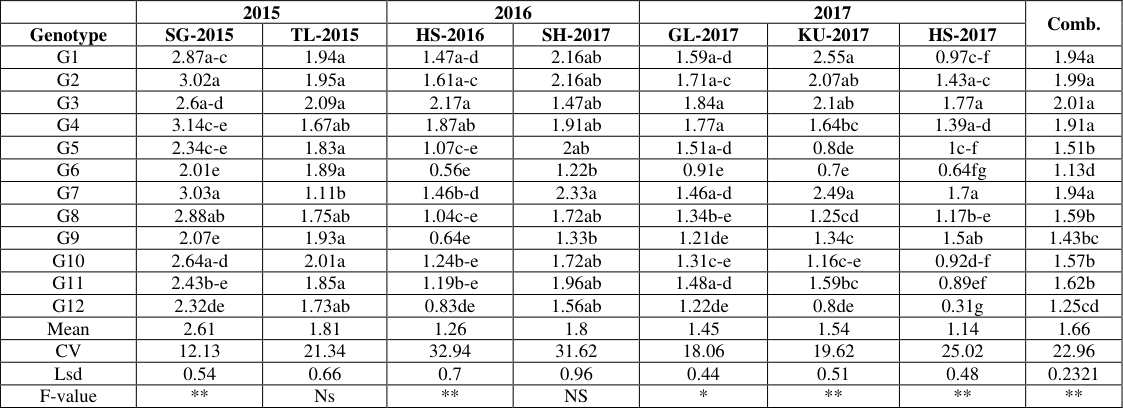 Table 4
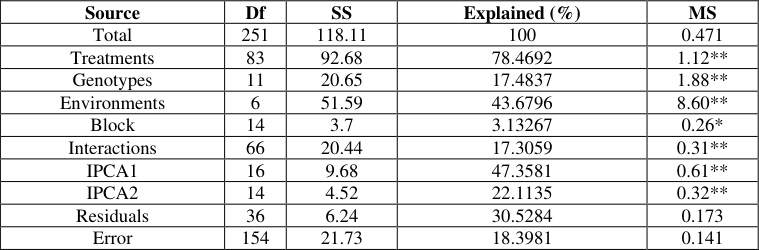 Table 5
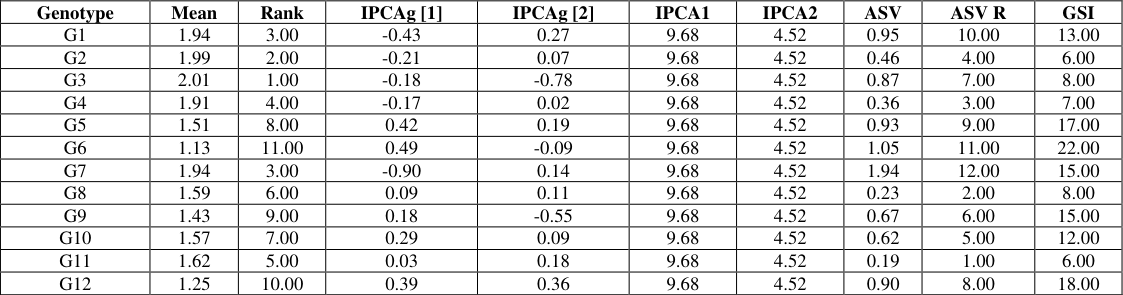 Table 6
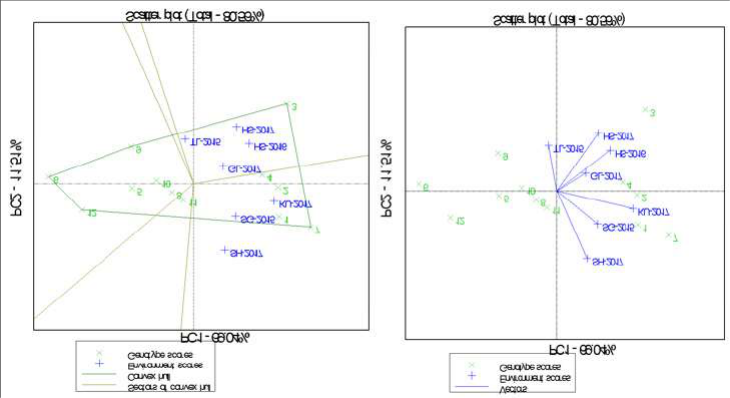 Figure 1
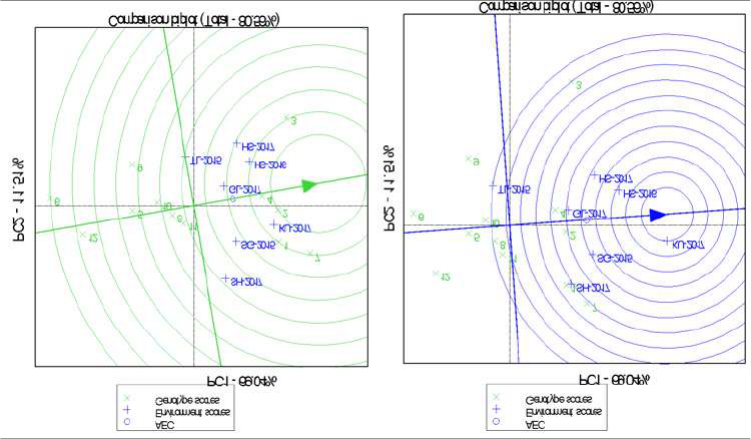 Figure 2
Introduction
Common bean (Phaseolus vulgaris L.) is an annual crop that belongs to the Fabaceae family, and it thrives in a warm climate and grows well between 1400 and 2000 meters above sea level (Vakali, 2009) [13] . In Ethiopia, it has been one of the most important crops grown by small-scale farmers in different parts of the region, and it is also one of the important cash crops for resource-poor farmers (Yitayal et al., 2015) [15] . The crop has a significant role in food security due to fast maturing characteristics and it realizes small-scale farmers to get the cash required to purchase other items and needs when others have not yet matured (Legesse et al., 2016). Common bean comprises numerous cultivars with a wide range of morphological and agronomic characteristics because of extensive plant-breeding efforts. One of the most commonly selected traits is determinate growth, which is associated with reduced branching, shorter and fewer internodes, reduced twining, insensitivity to day length and an increased allocation of biomass to reproductive growth (Kwak et al., 2012). Common bean is one of the cash crops next to faba beans, accounting for the greatest portion of production in the world. In Ethiopia, the national average yield of 1.762 tons/ha was reported during the 2020/21 main cropping seasons, with a productivity increment of 4.88% over the 2019/20 cropping season for red common bean types. As compared to 1.792 tons/ha (Oromia), the average grain yield of 1.973 tons/ha (Kellem Wallaga) was reported in the 2020/21 main cropping season and this displays the better productivity of red common bean at the western Oromia compared to the regional and national average productivity (CSA, 2020/21) [2] .
Although the area has a potential for common bean production, the crop is not well distributed in the western part of Ethiopia for a decade. However, the production and area coverage has been increasing recently. This is due to the fact that the crop is one of the cash crop commodities that have a place in the Ethiopian commodity exchange floor for export and also for risk aversion in hot humid areas. It is also most probably due to the increasing awareness of the expansion of promising common bean verities which can better perform in the prevailing biotic and a biotic factors of this production zones. Although management practice can further enhance the productivity of common beans in such marginal areas; more progress in improving yield will be realized through genetic improvement. According to Belachew et al. (2022) [1] , the increase in annual production (yield per ha) of common bean was 56.0 kg/ha in Ethiopia. However, its annual production area has been shrinking by 0.7%, and the sole reason for the observed increase in production of common bean was thus the increase in per hectare yield by 4.0%. The genetic improvement of common bean productivity is desirable in different farming systems including small-scale farmers and commercial farms. In this view, the introduction and evaluation of common bean genotypes thereby evaluating their performance, adaptability, and grain yield stability was essential. Therefore, the current study was carried out to identify highyielding, stable, and major disease-tolerant small red common bean genotype/s, and to suggest the promising candidate genotype/s for further release in the study area and areas with similar agro ecology.
Materials and methods
Materials and methods
Description of Study Area
A field experiment was conducted at Haro Sabu Agricultural Research Center main station and Farmer Training Center (FTC) of Tole, Sago, Kure Gayib, Shebel and Gulliso during the 2015-2017 main cropping seasons. Haro Sabu Agricultural Research Center is located at 550 kilometers west of Addis Ababa, the capital city of Ethiopia. It lies between latitude of 8 0 52'51''N and longitude of 35 0 13'18''E with altitude that ranges from 1450-1700m.a.s.l. The study areas were characterized by Nitosol soil type and sandy loam soil textural class. The rain periods of the study area covers from April to November. The averaged annual rainfall of the study areas during the 2015-2017 was 1481mm with uni-modal distribution pattern and the monthly mean minimum and maximum temperatures was 12.65 o C and 28.93 0 C, respectively.
Testing Genotypes
Twelve (12) small red common bean genotypes originally introduced from Melkasa Agricultural Research Center, Ethiopia Agricultural Research Institute. These genotypes were evaluated with the local and the standard check for grain yield, yield components and major foliar disease; Anthracnose reaction.
Data collection
Agronomic data were collected on a plot and plant basis. Some of the data collected were the number of pods per plant (PPP), number of seeds per pod (SPP), plant height in centimeters (PH), branch per plant (BPP), days to 50% flowering (DF), days to 90% physiological maturity (DM), a thousand seed weight (TSW), grain yield (GY) and anthracnose reaction based on common bean descriptor (IBPR, 1982) [6] .
Data Analysis:
All the collected data were organized and analyzed using SAS statistical package (SAS, 2006 version 9.03). The homogeneity of residual variance (MSE) was verified according to Cruz et al. (2004), in which the ratio between the highest and the lowest residual mean square was less than 7. The significance of genotype, environment and interaction of genotype by environmental effect was determined by F-test. Combined analysis of grain yield and other yield-contributing morphological traits was done using the general linear model (Proc GLM) procedure. Thus, the contribution of genotype, environment and their interaction towards the total variation was estimated. Mean separation was done using least significant difference (LSD) employing the procedure developed by Gomez and Gomez (1984). AMMI model was used to analyze adaptability and phenotypic stability using a statistical model suggested by Zobel et al. (1988). GGE biplot and AMMI stability analysis were performed using GenStat computer software (2012). Furthermore, AMMI stability value, GGE biplot and genotype selection index were further used to confirm stability of identified genotypes (Table 6).
| Genotype | Mean | Rank | IPCAg [1] | IPCAg [2] | IPCA1 | IPCA2 | ASV | ASV R | GSI |
|---|---|---|---|---|---|---|---|---|---|
| G1 | 1.94 | 3.00 | -0.43 | 0.27 | 9.68 | 4.52 | 0.95 | 10.00 | 13.00 |
| G2 | 1.99 | 2.00 | -0.21 | 0.07 | 9.68 | 4.52 | 0.46 | 4.00 | 6.00 |
| G3 | 2.01 | 1.00 | -0.18 | -0.78 | 9.68 | 4.52 | 0.87 | 7.00 | 8.00 |
| G4 | 1.91 | 4.00 | -0.17 | 0.02 | 9.68 | 4.52 | 0.36 | 3.00 | 7.00 |
| G5 | 1.51 | 8.00 | 0.42 | 0.19 | 9.68 | 4.52 | 0.93 | 9.00 | 17.00 |
| G6 | 1.13 | 11.00 | 0.49 | -0.09 | 9.68 | 4.52 | 1.05 | 11.00 | 22.00 |
| G7 | 1.94 | 3.00 | -0.90 | 0.14 | 9.68 | 4.52 | 1.94 | 12.00 | 15.00 |
| G8 | 1.59 | 6.00 | 0.09 | 0.11 | 9.68 | 4.52 | 0.23 | 2.00 | 8.00 |
| G9 | 1.43 | 9.00 | 0.18 | -0.55 | 9.68 | 4.52 | 0.67 | 6.00 | 15.00 |
| G10 | 1.57 | 7.00 | 0.29 | 0.09 | 9.68 | 4.52 | 0.62 | 5.00 | 12.00 |
| G11 | 1.62 | 5.00 | 0.03 | 0.18 | 9.68 | 4.52 | 0.19 | 1.00 | 6.00 |
| G12 | 1.25 | 10.00 | 0.39 | 0.36 | 9.68 | 4.52 | 0.90 | 8.00 | 18.00 |
Table text extracted from the original PDF; superscript letters are shown inline. The original table image is below.
View original table image
Results and Discussions 3.1 Analysis of Variance
Analysis of variance (ANOVA) was done for grain yield and the other eight yield-contributing traits mentioned above. Highly significant variation of small red common bean genotypes were estimated for all traits except for days to maturity, number of branches per plant and number of seed per pod as shown in table 2, indicating existence of inherent genetic variability among genotypes. Present result was in agreement with Girum et al.
| SV | DF | Mean square | — | — | — | — | — | — | — | — |
|---|---|---|---|---|---|---|---|---|---|---|
| DF | DM | PH | BPP | PPP | SPP | HSW | GY | ANT | ||
| Environment | 6.00 | 8.79** | 316.61** | 7207.60** | 157.38** | 633.05** | 10.50** | 62.00** | 8.60** | 9.26** |
| Rep | 2.00 | 10.01 | 4.22 | 885.15* | 7.99 | 0.05 | 0.24 | 19.26* | 0.66 | 0.78 |
| Genotype | 11.00 | 5.69** | 28.17 | 800.95** | 9.11 | 26.76** | 0.46 | 89.25** | 1.88** | 23.39** |
| G×E | 66.00 | 2.06** | 29.05* | 309.52 | 9.55 | 18.50** | 0.58 | 6.63** | 0.31** | 2.18 |
Table text extracted from the original PDF; superscript letters are shown inline. The original table image is below.
View original table image
(2022) [5] , who reported highly significant (p< 0.01) difference of common bean genotypes per individual locations and declared that the variation was due to their genetic variation.
On the other hands, the test environments exerted highly significant (p<0.01) effect on all traits, illustrating the importance of fluctuation of whether condition on performance of these traits. The interaction of genotype x environment imposed significant effect on all traits excluding plant height, number of branches per plant, and number of seed per pod as presented in table 2. This also explain that grain yield and yield attributing traits were strongly influenced by the interaction of genotype x environment. The occurrence of significant GxE necessities identifying genotypes that has yield stability and/or depict genotype better cope with each environmental condition.
The study was in accordance with, Mashamba et al. (2021) [9] report which declared highly significant differences of test environments, genotypes, and genotypes by environmental interaction effect for grain yield and most of yield related traits.
Combined Mean Performance
Combined analysis of variance showed significantly shorter mean of days to 50% flowering for G4, G10, G2, G5 and G8 compared to G3, G7 and G9 which had significantly longer days to flowering. Unlikely, only G11 and G12 displayed significantly earlier and late days to 90% maturity than the remaining genotypes, respectively (Table 3). In present study, no single genotype displayed shorter and/or longer days to flowering and maturity consistently. The result was confirmed by Girum et al. (2022) [5] , who reported variation of phonological traits as it may be attributed by inherent genetic variability of genotypes, environments, and their interaction effect. Significantly shorter mean value of plant height (PH) was recorded from G9, G8, G1 and G6 compared to G5 and G3 which were significantly taller. Plant height was reduced by 19.18%, 8.43%, 8.05% and 5.23% over the grand mean for G9, G8, G1 and G6, respectively (Table 3). Significantly higher mean was detected from G3 and G11 for pod per plant (PPP), from G3 and G8 for seed/pod (SPP), G1, G2 and G8 for hundred seed weight (HSW) based on combined analysis (Table 3). The finding of this study depicted no genotype displaying significantly different performance in desirable direction for all traits consistently, most probably due to genetic variability, environmental and their interaction effect on individual traits and/or genotypes. The result of this study was in correspondence with Lemma et al. (2022), who reported no single common bean genotype better for all traits consistently. The combined analysis (Table 3) revealed significantly higher mean grain yield (GY) for G3 (2.01 tons/ha) followed by G2 (1.99 tons/ha), G1 (1.94 tons/ha) and G7 (1.94 tons/ha). Conversely, the lowest mean grain yield was recorded from G6 (1.13 tons/ha) and followed by a local check (1.25 tons/ha) and G9 (1.43 tons/ha) in present study (Table 3). The yield advantage of 24.07, 22.84, 19.75, and 19.75 were estimated for G3, G2, G1, and G7, respectively over standard check SER (119) which had the mean value of 1.62 tons/ha (Table 3). The highest mean value of grain yield was obtained from SG-2015 (2.61 tons/ha) and followed by SG-2015 (2.61tons/ha), TL-2015 (1.81 tons/ha) and SH-2017 (1.80 tons/ha). However, the lowest mean value was recorded at HS-2017 (1.14 tons/ha) and GL-2017 (1.45 tons/ha) as presented in Table 4. This indicates high differential response of grain yield in common bean genotypes towards environmental variation. Fortunately, this most probably express the existence of yield potential which could be exploited across different common bean-producing regions. In line with the present study, Mashamba et al. (2021) [9] ; Girum et al. (2022) [5] reported different ranges of common bean grain yield across potential common bean growing agro ecological zones. , G2= ICA PALMAR,G3= SCR33,G4=790-RAA-34,G5= RCB592,G6= SCR7,G7= SER 176,G8= Dinkinesh,G9= SER118,G10= SCR13,G11= SER 119,G12=Local check SG, TL, HS, SH, GL and KU represent Sago, Tole, HaroSabu, Shebel, Gulliso and Kure gayib, respectively
| — | 2015 | — | 2016 | — | 2017 | — | — | Comb. |
|---|---|---|---|---|---|---|---|---|
| Genotype | SG-2015 | TL-2015 | HS-2016 | SH-2017 | GL-2017 | KU-2017 | HS-2017 | |
| G1 | 2.87a-c | 1.94a | 1.47a-d | 2.16ab | 1.59a-d | 2.55a | 0.97c-f | 1.94a |
| G2 | 3.02a | 1.95a | 1.61a-c | 2.16ab | 1.71a-c | 2.07ab | 1.43a-c | 1.99a |
| G3 | 2.6a-d | 2.09a | 2.17a | 1.47ab | 1.84a | 2.1ab | 1.77a | 2.01a |
| G4 | 3.14c-e | 1.67ab | 1.87ab | 1.91ab | 1.77a | 1.64bc | 1.39a-d | 1.91a |
| G5 | 2.34c-e | 1.83a | 1.07c-e | 2ab | 1.51a-d | 0.8de | 1c-f | 1.51b |
| G6 | 2.01e | 1.89a | 0.56e | 1.22b | 0.91e | 0.7e | 0.64fg | 1.13d |
| G7 | 3.03a | 1.11b | 1.46b-d | 2.33a | 1.46a-d | 2.49a | 1.7a | 1.94a |
| G8 | 2.88ab | 1.75ab | 1.04c-e | 1.72ab | 1.34b-e | 1.25cd | 1.17b-e | 1.59b |
| G9 | 2.07e | 1.93a | 0.64e | 1.33b | 1.21de | 1.34c | 1.5ab | 1.43bc |
| G10 | 2.64a-d | 2.01a | 1.24b-e | 1.72ab | 1.31c-e | 1.16c-e | 0.92d-f | 1.57b |
| G11 | 2.43b-e | 1.85a | 1.19b-e | 1.96ab | 1.48a-d | 1.59bc | 0.89ef | 1.62b |
| G12 | 2.32de | 1.73ab | 0.83de | 1.56ab | 1.22de | 0.8de | 0.31g | 1.25cd |
| Mean | 2.61 | 1.81 | 1.26 | 1.8 | 1.45 | 1.54 | 1.14 | 1.66 |
| CV | 12.13 | 21.34 | 32.94 | 31.62 | 18.06 | 19.62 | 25.02 | 22.96 |
| Lsd | 0.54 | 0.66 | 0.7 | 0.96 | 0.44 | 0.51 | 0.48 | 0.2321 |
| F-value | ** | Ns | ** | NS | * | ** | ** | ** |
Table text extracted from the original PDF; superscript letters are shown inline. The original table image is below.
View original table image
| — | DF | DM | PH | BPP | PPP | SPP | HSW | GY(tn/ha) | YAD (%) | ANT |
|---|---|---|---|---|---|---|---|---|---|---|
| G1 | 40.71c-e | 76.76a-c | 58.69de | 5.67b | 13.95ab | 4.15ab | 21.79a | 1.94a | 19.75 | 2.67 |
| G2 | 40.67de | 77.33ab | 61.16b-e | 5.42b | 14.02ab | 3.99ab | 21.9a | 1.99a | 22.84 | 3.17 |
| G3 | 41.33b | 76.52bc | 70.58ab | 5.83b | 14.52a | 4.29a | 20.57b | 2.01a | 24.07 | 3.00 |
| G4 | 40.33e | 76.48bc | 67.45a-d | 6.04ab | 13.69a-c | 4.27a | 21.11ab | 1.91a | 17.9 | 2.94 |
| G5 | 40.52de | 76.95a-c | 73.88a | 5.06b | 12.01cd | 4.09ab | 20.39b | 1.51b | -6.79 | 5.61 |
| G6 | 40.71c-e | 76.57bc | 60.49c-e | 5.33b | 11.45d | 4ab | 18.42cd | 1.13d | -30.25 | 4.94 |
| G7 | 41.29bc | 77.81ab | 64.19a-d | 7.74a | 13.28a-d | 3.95ab | 21.1ab | 1.94a | 19.75 | 3.61 |
| G8 | 40.67de | 77.1ab | 58.45de | 6.06ab | 11.64d | 4.23a | 22.11a | 1.59b | -1.85 | 4.67 |
| G9 | 41.33b | 76.57bc | 51.59e | 5.83b | 12.18b-d | 4.06ab | 17.34d | 1.43bc | -11.73 | 5.11 |
| G10 | 40.67de | 76.48bc | 64.78a-d | 5.77b | 12.1b-d | 4.08ab | 21.12ab | 1.57b | -3.09 | 5.39 |
| G11 | 40.76b-e | 74.29c | 64.97a-d | 5.91b | 14.58a | 4.08ab | 18.77c | 1.62b | 0 | 4.28 |
| G12 | 40.95b-d | 79.38a | 69.72a-c | 5.9b | 13.2a-d | 3.75ab | 15.51e | 1.25cd | -22.84 | 4.78 |
| Mean | 40.95 | 76.85 | 63.83 | 5.88 | 13.05 | 4.08 | 20.01 | 1.66 | 4.18 | |
| CV | 2.35 | 5.81 | 25.51 | 48.56 | 24.21 | 16.43 | 9.74 | 22.96 | ||
| Lsd | 0.59 | 2.72 | 9.92 | 1.74 | 1.93 | 0.41 | 1.16 | 0.23 |
Table text extracted from the original PDF; superscript letters are shown inline. The original table image is below.
View original table image
Additive Main Effect and Multiplicative Interaction Effect (AMMI) Analysis
Additive main effect and multiplicative interaction (AMMI) effect analysis is one of the stability parameters used to investigate GEI and is particularly effective for depicting adaptive responses (Gauch, 1992; Cross, 1990) [4,3] . AMMI analysis showed a significant main effect of genotype, environment and GXE for grain yield. From the total variation of grain yield; 17.48%, 43.68% and 17.31%, 3.13%, and 18.39% were estimated due to genotype, environment, GXE, block, and error, respectively (Table 5). Significant GXE revealed the unstable response of genotypes to cope up with environmental fluctuation. IPCA1 and IPCA2 had 47.36% and 22.11% interaction sum squares and contributed a total of 69.47% of the total variation, where the remaining 30.53% was due to residual effect. The finding of the present study was in correspondence with Mashamba et al. (2021) [9] , who reported AMMI analysis of grain yield that showed the main effects of genotype and environment accounted for 39.3 % and 31.4 %, respectively. The same author found 26.8 % of total seed yield variation due to GXE which was higher than the GXE contribution estimated at 17.31% in the present study. The first two interactions principal component axis of the AMMI model was the best predictive model that explains the GXE interaction sum of squares (Kempton, 1984), corresponding with the finding of the current study.
| Source | Df | SS | Explained (%) | MS |
|---|---|---|---|---|
| Total | 251 | 118.11 | 100 | 0.471 |
| Treatments | 83 | 92.68 | 78.4692 | 1.12** |
| Genotypes | 11 | 20.65 | 17.4837 | 1.88** |
| Environments | 6 | 51.59 | 43.6796 | 8.60** |
| Block | 14 | 3.7 | 3.13267 | 0.26* |
| Interactions | 66 | 20.44 | 17.3059 | 0.31** |
| IPCA1 | 16 | 9.68 | 47.3581 | 0.61** |
| IPCA2 | 14 | 4.52 | 22.1135 | 0.32** |
| Residuals | 36 | 6.24 | 30.5284 | 0.173 |
| Error | 154 | 21.73 | 18.3981 | 0.141 |
Table text extracted from the original PDF; superscript letters are shown inline. The original table image is below.
View original table image
AMMI Stability Value (ASV) and Genotype Selection Index (GSI)
AMMI stability value (ASV) was used to quantify and rank genotypes based on their yield stability (Purchase et al., 2000). The genotype with the lowest AMMI stability value (ASV) was the most stable. With this view, G11 was the most stable and followed by G8, G4, G2, G10, and G9 (Table 6). Most of the genotypes identified for their better stability had a lower mean value of grain yield; however, the stability of the genotype is not the only selection criterion. Hence, evaluation of the average performance of grain yield with ASV is tremendously important and comparison of genotypes based on the genotype selection index (GSI) expresses the mean value of grain yield and ASV. Therefore, G11, G2, G4, G3, G8, G10 and G1 had better mean values of grain yield and were relatively stable genotypes over test environments (Table 6). The result of this study was in agreement with Tadele et al. (2017) [12] .
Genotypes and Genotypes by Environment Interaction (GGE) Bi-plot Analysis
Graphic analysis of GGE biplot analysis for small red common bean genotypes evaluated at seven test environments was done, and the polygon dictated that G3, G7, G12, and G8 were vertex genotypes, where the remaining genotypes lie inside the polygon. The vertex cultivar is the highest-yielding in all test environments that share the sector with it and the sector with vertex genotype may be referred to as the sector of identified genotype. With this, the sector of G3 had three environments (HS-2016, HS-2017, and GL-2017), the sector of G7 had three environments (SG-2015, KU-2017 and SH-2017) and the sector of G8 had one environment (TL-2015) and had a higher mean value of grain yield (Figure 1). Stable genotypes and environments located near the origin of the biplot with two IPCA scores of almost zero. G11, G8 and G10 were slightly close to the origin, illustrating medium stability and below grand mean (1.66 tons/ha) grain yield, which was undesired. Besides, G3, G7, G12, G8 and G9 were far from the origin of the polygon, exhibiting more responsiveness to environmental change and specific environment adaptation (Fig 1). The line from the origin of the biplot to the genotype indicates the difference in yield from the grand mean, and genotypes with long vectors could be of good or poor performance (Yan and Tinker, 2006) [14] . G3 and G7 had the best performance for grain yield and had a high contribution to GXE. Conversely, these genotypes were identified for specific adaptability because of their farness from the origin of the biplot (Fig 1). No environment fell in the sectors with G12, indicating that this vertex genotype was not the best in any of the test environments, and its poor performance in some or all test environments. G8 and G12 were located far from the origin, revealing the poor yield performance and their much contribution to the GXE. Away from this, the genotype located at the origin rank the same in all environments and is not at all responsive to the test environments. As "which won where pattern'' of biplot concerned; the lines from the origin of the biplot perpendicular to the sides of the polygon divided the polygon into 4 sectors (fig 1). The test locations fell into 3 of the 4 sectors. With this, HS-2017, HS-2016, and GL-2017 fell in one sector and the vertex genotype for this sector was G3, indicating a higher mean grain yield of G3 at these three locations. KU-2017, SG-2015, and SH-2017 fell in another sector and the vertex genotype was G7. (2017), who evaluated Which-won where in common bean genotypes that showed higher mean value of grain yield and its stability in multiple environment in their separate study.
GGE Bi-plot Analysis for Comparison of Genotype for
Grain Yield and Stability Environments and genotypes located in the central circle are considered as ideal in the GGE biplot (Yan (2002) [14] . GGE biplot assumes that stability and mean yield are equally important (Farshadfar et al., 2011). With this perception, genotypes designated as G2 and G4 followed by G3, G1, and G7 lay near the center of concentric circles, and they were found to be ideal genotypes in terms of mean grain yield value and yield stability (Figure 2). [12] reported superior and stable genotypes for grain yield in their study of common bean grain yield stability. Among the seven test environments, Ku-2016 (1.54 tons/ha) was more stable and followed by HS-2016 (1.26 tons/ha) and HS-2017 (1.14 tons/ha), and SG-2016 (2.61tons/ha). Conversely, TL-2015 and SH-2017 were found to be the most unstable environment (Figure 2).
Conclusions and Recommendations
Combined analysis of variance showed a significant main effect of genotype, environment, and GXE on grain yield and most of the yield-attributing traits considered in the study. Significant GXE indicates a difficult selection of superior genotype (s) for all environments as their response becomes unstable with the fluctuation of environmental conditions. Stability parameters; IPCA1, AMMI stability value, genotype selection index and GGE biplot further confirmed the presence of high-yielding and relatively stable genotypes. Small red common bean genotypes designated as G2, G3, G1, and G7 were identified and selected as candidates and suggested for release as a new variety in West and Kellem Wallaga Zones of Western Oromia, Ethiopia and areas with similar agro-ecology.
Acknowledgement
AcknowledgementsThe authors are grateful to the Oromia Agricultural Research Institute for sponsoring this study. The staff of Haro Sabu Agricultural Research Center, and Pulse and Oil Crops Researchers and technical assistance was deeply acknowledged for their efforts and assistance during the study period. Conflicts of InterestThe authors declare no conflicts of interest regarding the publication of this paper.
Figures and tables from the paper
| Code | Genotype | Hosting Center |
|---|---|---|
| G1 | SER180 | Melkasa Agricultural Research Center |
| G2 | ICA PALMAR | Melkasa Agricultural Research Center |
| G3 | SCR33 | Melkasa Agricultural Research Center |
| G4 | 790-RAA-34 | Melkasa Agricultural Research Center |
| G5 | RCB592 | Melkasa Agricultural Research Center |
| G6 | SCR7 | Melkasa Agricultural Research Center |
| G7 | SER 176 | Melkasa Agricultural Research Center |
| G8 | DINKINESH | Melkasa Agricultural Research Center |
| G9 | SER118 | Melkasa Agricultural Research Center |
| G10 | SCR13 | Melkasa Agricultural Research Center |
| G11 | SER(119) | Melkasa Agricultural Research Center |
| G12 | Local check | Local cultivar |
Table text extracted from the original PDF; superscript letters are shown inline. The original table image is below.
View original table image
References
12 in the original paper- Belachew KY, Maina NH, Dersseh WM, Zeleke B, Stoddard FL. Yield Gaps of Major Cereal and Grain Legume Crops in Ethiopia: A Review. Agronomy. 2022;12:2528. https://doi.org/10.3390/ agronomy12102528.
- CSA (Central Statistical Agency). 2020/21. Report on area and production of major crops. CSA, Addis Ababa, Ethiopia.
- Cross J. Statistical analysis of multiple location trial. Advance in agronomy. 1990;44:55-85.
- Gauch G. Statistical analysis of regional yield trials. AMMI analysis of factorial design. 1 st edn, Elsevier, New York, 1992. ISBN:0-444-89240-0.
- Girum K, Hussein M, Berhanu A. Yield stability analysis of large-seeded Common bean varieties in major bean growing areas of Ethiopia. Ethiop. J Crop Sci. 2022;9(2):202.
- IBPR (International board for plant Genetic resource). Discriptores for phaselous vulgaris, Rome. 1982.
- Legese D, Gure K, Teshale A. Production and marketing of white pea Beans in rift valley Ethiopia. A sub-sector analysis CRS Ethiopia program, Addis Ababa, 2016.
- Mashamba P, Patrick A, Ernest R. Environmentally stable common bean genotypes for production in different agroecological zones of Tanzania. Heliyon. 2021;7(1):e05973.
- Shitaye H. Genotype by Environment Interaction and Stability Analysis for Grain Yield of Durum Wheat Genotypes Evaluated in Ethiopia. Ethiopian Journal of Crop Science. 2017;15:1.
- Tadele Z. Raising crop productivity in Africa through the intensification. Agronomy. 2017;7:22.
- Yan W, Tinker NA. Biplot analysis of multi-environment trial data: Principles and applications. Can. J Plant Sci. 2006;86:623-645.
- Yitayal A, Adam B. Analysis of adoption spell of improved common bean varieties in the central rift valley of Ethiopia: A duration model approach. Journal of Agricultural Economics and Development. 2015;4(3):037-043.
Cited by 1
From OpenAlex, OpenCitations and reference lists read by Scinovex
- GGE biplot analysis for yield performance and stability of faba bean (Vicia faba L.) genotypes under multi environmental condition ↗
Gizachew Yilma, Kedir Yimam, Aliyi Robsa Shuro · Ecological Genetics and Genomics · 2025
❝ 1