
Research article · 2023 · Full text
International Journal of Geography Geology and EnvironmentLong-term climatic trends in rainfall pattern analysis over Madhya Pradesh
Volume 5(1) · Pages 32–43 · DOI: 10.22271/27067483.2023.v5.i1a.139 ↗
Research areasClimate variability and modelsClimate change impacts on agricultureHydrology and Drought Analysis
Abstract
Author-writtenClimate change is a long-term process and main issue of research now a days. The rainfall, it’s trends and variability are also affected by climate change and hence the study of rainfall, variability and future predictions are very much important for planning and management. MP is the second largest state, in India and the fifth largest state in population. Its total area is 308,252 km2 and occupies 9.38% area of the country comprises of two meteorological subdivisions viz. East MP & West MP and ten agro-meteorological zones. The varying climatic conditions along with various geographical features have been responsible for drought and flood conditions in different parts of the state. Increasing population and urbanization of the state are causing adverse impacts on the natural environment. The long- term trends of rainfall are required for the planning of optimum adaptation strategies for sustainable use of water. The rainfall trends, its changes and variability are very important for understanding the impact of climate change at regional scale. The study focuses on temporal variation in rainfall at annual, seasonal & monthly scale over East & West MP meteorological subdivisions and MP state as a whole during the period 1871-2016. The long-term changes in rainfall are examined by Man Kendall and Sen’s slope estimates and also analysed the nature relationship with Southern Oscillation Index (SOI) and North Atlantic Ocean (NAO) index. In monthly trends the rainfall over West MP has shown a significant decrease during June while a significant increase during August, whereas the seasonal and annual trends of rainfall are not significant in West MP. In East MP, annual as well as seasonal rainfall during monsoon season have shown significantly decreasing trend which is most prominent in June and July months. Monsoon rainfall is showing significant decreasing trend at 0.1 level of significance along with significant decrease in June month at 0.05 level over the MP state as a whole. The winter and pre-monsoon rainfall showed almost constant (non-significant) trends for the East as well as West MP and for MP state as a whole; however the post monsoon rainfall showed a significantly decreasing trend over West MP at 0.1 level and over all MP state as a whole at 0.05 level of significance during past 50 years. The state receives major rainfall during monsoon season only and rests of the season contribute only 10% to its annual average rainfall. The decreasing tendency in monsoon rainfall and hence annual rainfall, the urban and semi urban areas of the state are facing problems of water scarcity. The changing rainfall trends during monsoon season are affecting kharif crops productivity. The significantly decreasing monsoon and post monsoon rainfall pattern are causing more dependency of farmers on ground water resources.
Summary
Source-checkedPlain-language reading of the full paper, prepared with AI and checked against the text. Each point links to the authors' own words.
Why it matters
- Studying rainfall trends and variability is essential for planning and management because these patterns are affected by climate change. View evidence ↗
- Agriculture is the primary livelihood in Madhya Pradesh (MP), with 85.6% of rural workers depending on it. View evidence ↗
- Long-term rainfall data is necessary to develop adaptation strategies for the sustainable use of water resources. View evidence ↗
The question
- The study aims to analyze temporal variations in rainfall at annual, seasonal, and monthly scales across East MP, West MP, and the state as a whole from 1871 to 2016. View evidence ↗
- The research investigates how the Southern Oscillation Index (SOI) and North Atlantic Oscillation Index (NAO) influence rainfall trends in MP. View evidence ↗
What they did
- Monthly rainfall data for East and West MP from 1871 to 2016 was sourced from the Indian Institute of Tropical Meteorological (IITM). View evidence ↗
- The researchers used the non-parametric Mann-Kendall test and Sen’s slope estimator to detect trends for the full period (1871-2016) and the recent 50 years (1957-2016). View evidence ↗
What they found
- Annual rainfall in East MP showed a significant decreasing trend (p < 0.05), with a decrease of 143 mm in the recent decade compared to the long-term mean. View evidence ↗
- Long-term monsoon rainfall decreased significantly for the whole state (p < 0.1) and specifically for East MP (p < 0.01), while remaining constant in West MP. View evidence ↗
- Rainfall in June showed a significant long-term decrease across East MP, West MP, and the entire state. View evidence ↗
- In contrast to June, August rainfall showed a significant increasing trend in West MP (p < 0.05). View evidence ↗
- Long-term analysis showed significant correlations (p < 0.05) between annual/monsoon rainfall and SOI for West MP and the state, and between monsoon rainfall and NAO for East MP and the state. View evidence ↗
- The relationship between the Southern Oscillation Index (SOI) and annual/monsoon rainfall weakened across all regions during the period 1967-2016. View evidence ↗
What it means
- The authors conclude that the significant decrease in monsoon and post-monsoon rainfall is forcing farmers to rely more heavily on groundwater. View evidence ↗
- The authors state that decreasing rainfall will increase stress on water resources due to higher dependency on ground and surface water for irrigation. View evidence ↗
Visual summary
3 visualsIllustrations explain the paper; charts are replotted from the paper's own table values.
Seasonal Rainfall Trends
AI-generated conceptual illustration (The landscape of Madhya Pradesh, India). It explains the idea and does not show study data.
View source evidence ↗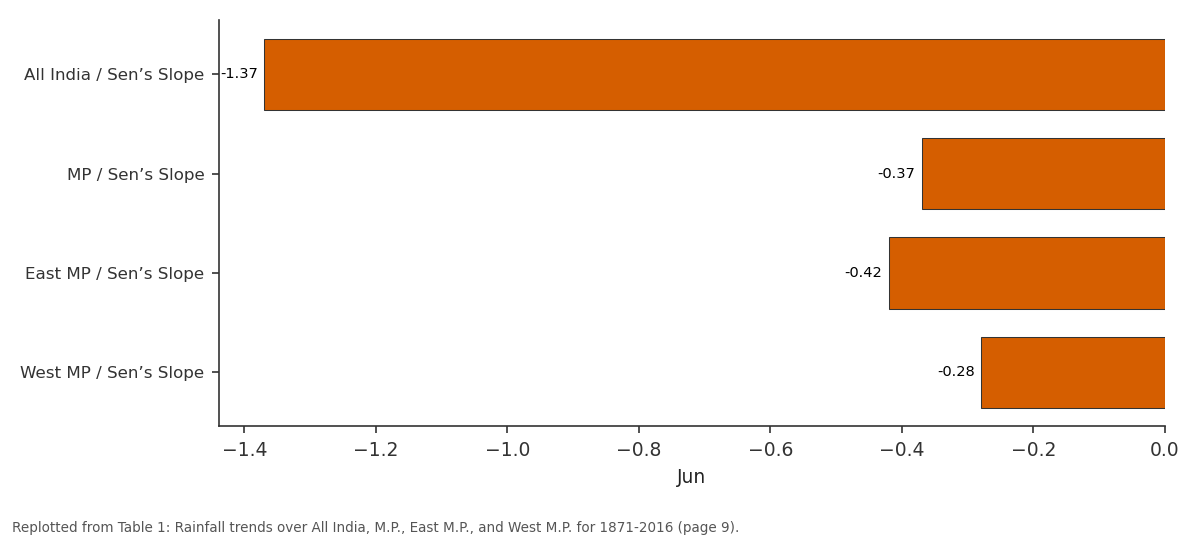
Jun: All India / Sen’s Slope vs MP / Sen’s Slope vs East MP / Sen’s Slope vs West MP / Sen’s Slope
Replotted from Table 1 (page 9) of the original paper. Every bar is the paper's own table value.
View source evidence ↗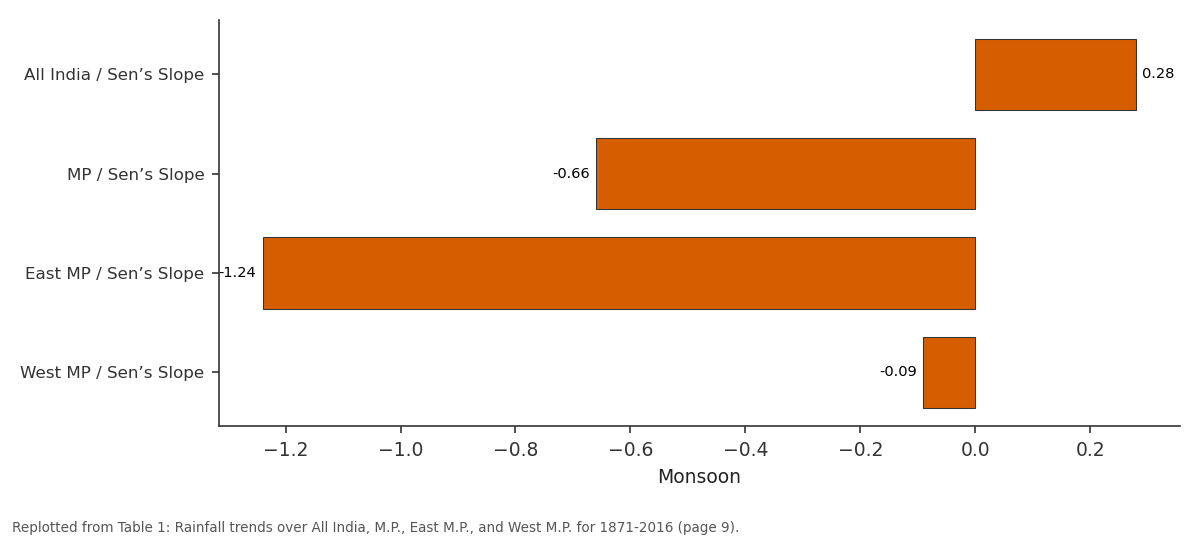
Monsoon: All India / Sen’s Slope vs MP / Sen’s Slope vs East MP / Sen’s Slope vs West MP / Sen’s Slope
Replotted from Table 1 (page 9) of the original paper. Every bar is the paper's own table value.
View source evidence ↗Figures & tables
From the original paper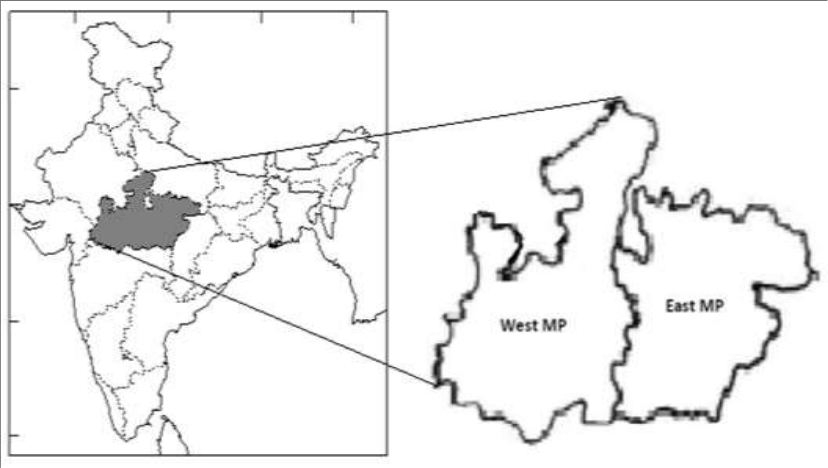 Figure 1A
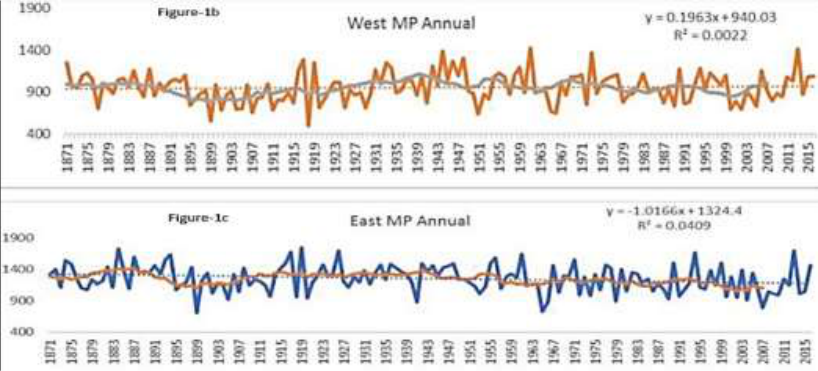 Figure 2A
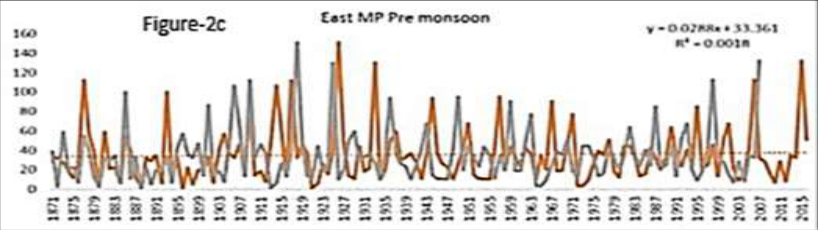 Figure 2
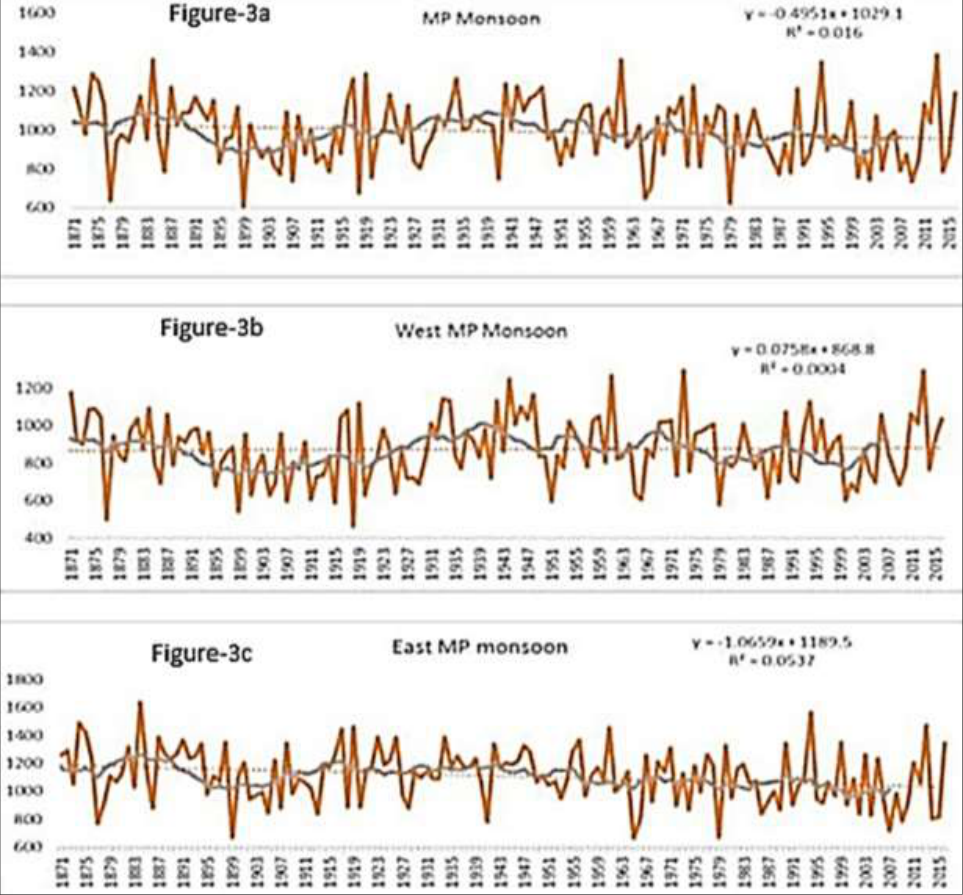 Figure 3
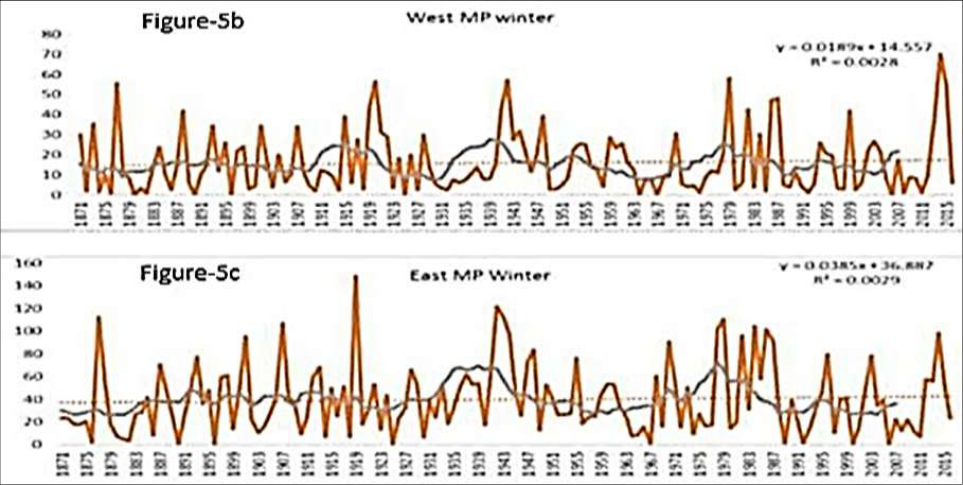 Figure 5
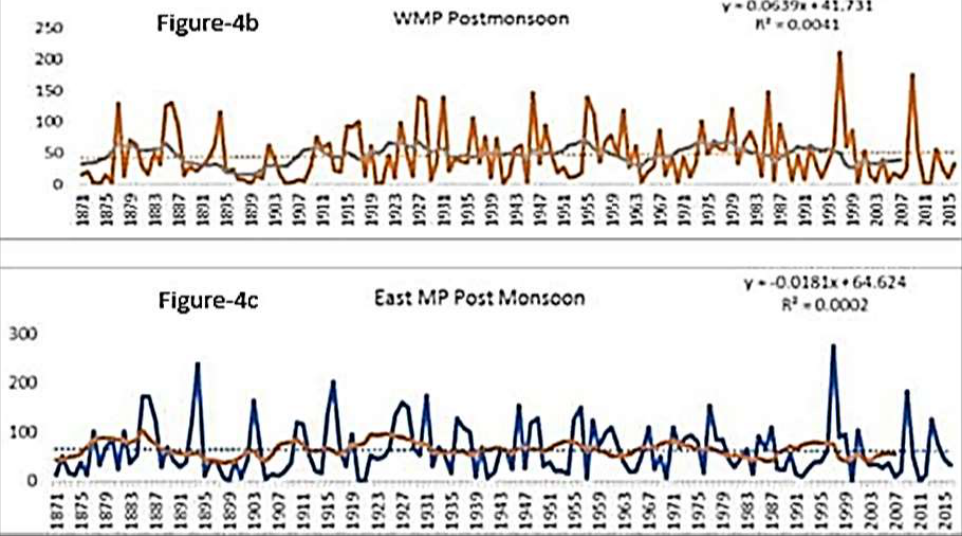 Figure 4
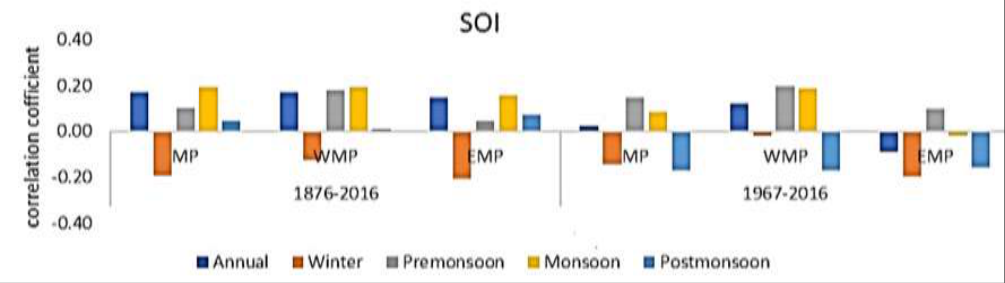 Figure 6
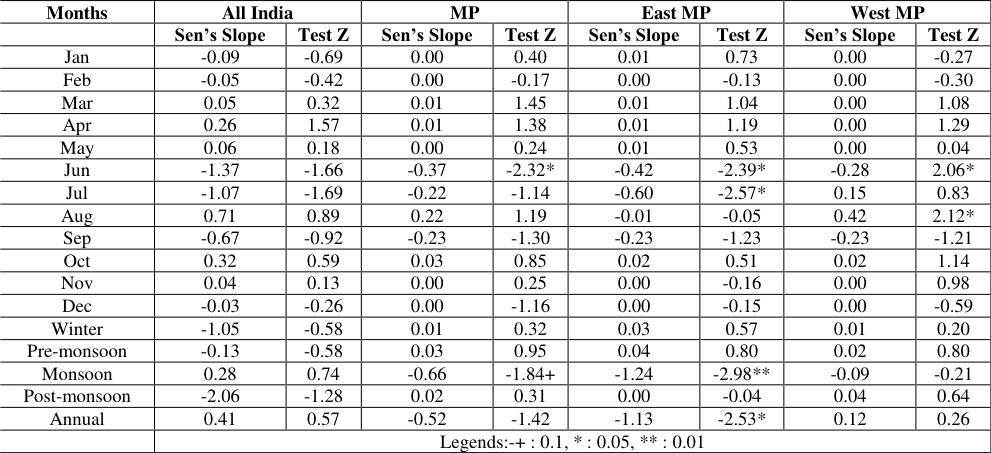 Table 1
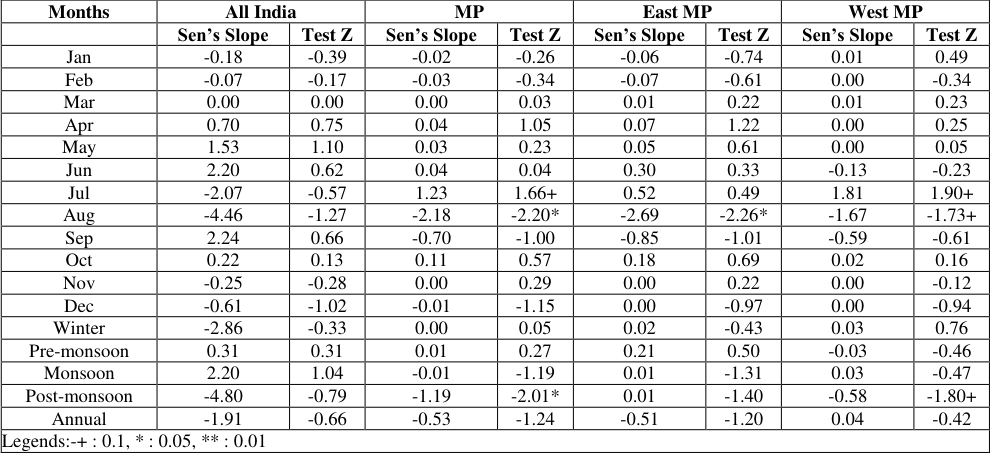 Table 2
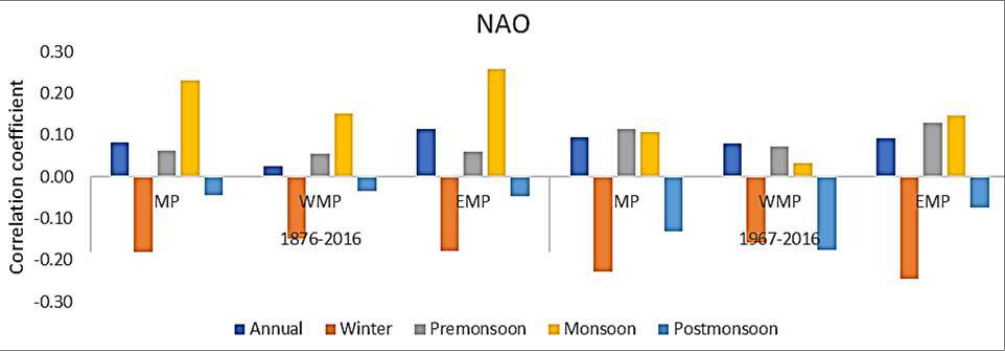 Figure 7
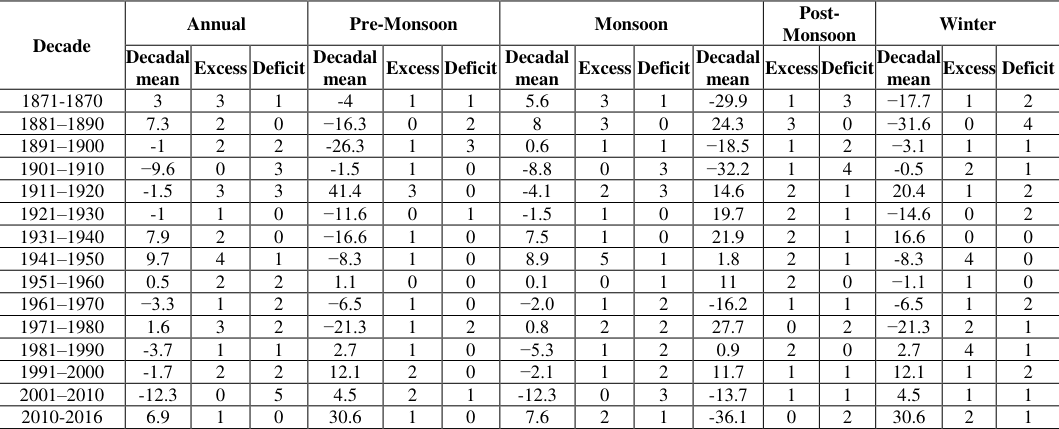 Table 3
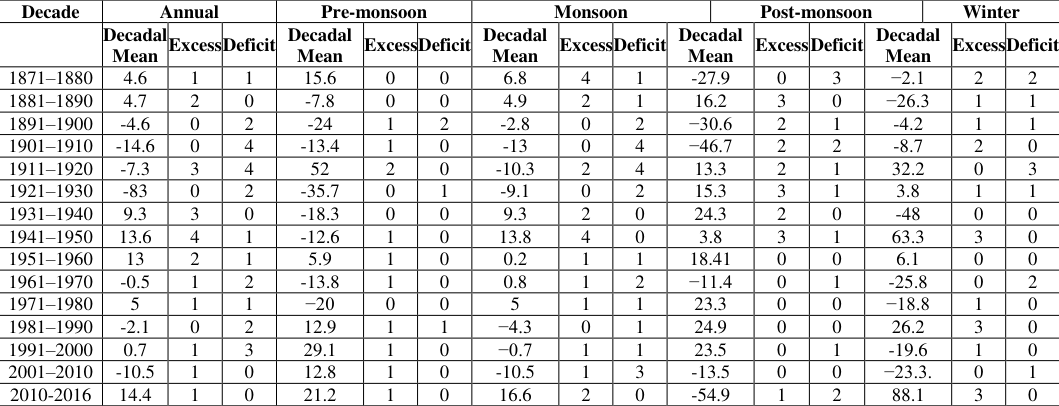 Table 4
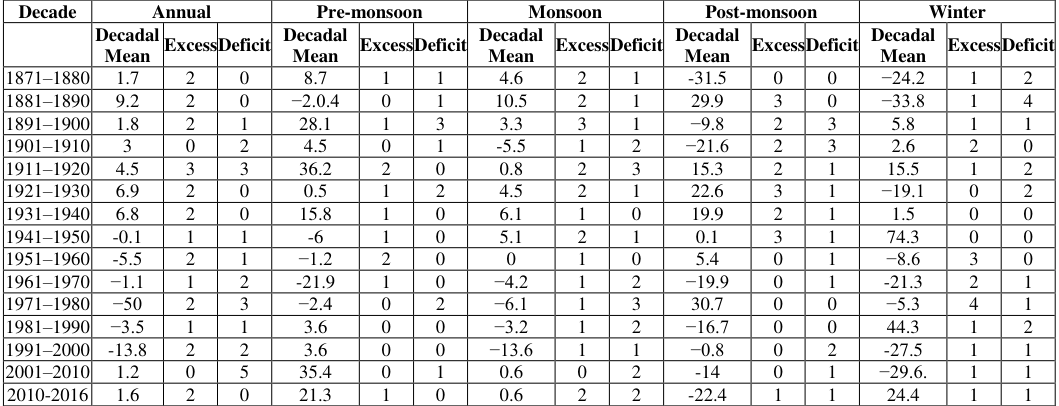 Table 5
Introduction
Rainfall, its variability, long-term trends and prediction of future trends are very crucial for economic and natural resource planning. The location of area with respect to equator and its natural relief features characterize the rainfall and runoff patterns. MP is located in Central India. It is one of the economically fastest growing states in our country. At current prices, the Gross State Domestic Product (GSDP) of MP for 2017-18 was Rs 7, 07,047 cores. The compound annual growth rate is 14.0%. Agriculture is the main source of livelihood for the people of the MP. According to census 2011, 69.8% of total worker (urban and rural) and 85.6% of the total worker in rural areas of MP are dependent on agriculture for their livelihood in the state as compared to 72.3% in rural India. In 2017-18, the state produced 42.14 million metric tons of food grains. The state is one of the major cotton producing states of India. MP is being honored "Krishi Karman Award" for the fifth consecutive year from 2011-12 to 2015-16. Economic survey report of MP (2017-18), state has achieved 18% agriculture growth during the last five years and mainly dependent on rainfall for its water requirements, range from 60-120 cm in different regions of the state. The state is currently exploiting 46% of the available ground water. Among all 51 districts, ground water availability is under semi-critical 23 districts, critical in 7 districts and over-exploited in eight districts. About 99% of the drinking water needs are being fulfilled with ground water and 90% of the ground water is being used for irrigation purposes. The climate of state is predominately moist sub humid to dry sub humid, semi-arid to dry subhumid and semi-arid in east, west and central plateau and hills respectively, according to agro-climatic regions of India. Sharma et al. (2015) [23] , the state of agriculture report of MP, annual rainfall received in the state varies from 800 mm in the northern and western regions to 1200 mm in the eastern districts. In some year's rainfall goes much below to the normal. Most of the rainfall is received in the Monsoon season from June to September and about 10% of the rainfall is received in the remaining part of the year. Favourable soil and climatic conditions helped the state to be a leading producer of coarse cereals, wheat, soybean, gram, sugarcane, rice, maize, cotton, rapeseed, mustard, arhar, pulses, oil seeds in the country. Rainfall is an important meteorological parameter, which has direct application to agricultural production and water resources. Various attempts have been made since last century to study seasonal and annual trends in rainfall of the country, central India and MP state. Long-term changes in the Indian monsoon rainfall on regional and local scales have important social and economic consequences Walker (1910) [27] did not found any trend in monsoon rainfall during 1841-1908 periods. Kumar et al. (1992) [35] done a study on spatial and sub-seasonal patterns of long-term trends of Indian summer monsoon rainfall. The monthly and seasonal rainfall was quantified by linear trends. West coast, North Andhra Pradesh and North West India are the areas where monsoon season rainfall trends were increasing whereas East MP and adjoining areas, North East India and some parts of Gujrat the trends were decreasing. August rainfall contribution is more prominent to monsoon seasonal rainfall mainly over west coast and central India. Naidu et al. (1999) [16] studied annual rainfall trends for (1871-1994) period, the negative trends are seen over west central India, central north India and north-eastern parts of India. The positive trend observed over north-west India, covering Haryana, Punjab, East Rajasthan, West Rajasthan and West MP, an isolated area in the east and the peninsula. Statistical tests show that at the 90% significance level, the negative trend is significant over East MP where the rainfall decreases by 1.09 mm/year. Rajeevan and Guhathakurta (2007) [8] analysed the trends and observed no significant trend for monsoon and monsoon months for the country as a whole with possible large variations on the regional scale. The July rainfall has decreased for most parts of the central and peninsular India but increased significantly in the northeastern parts of the country. August rainfall has increased significantly (at 95% significance level) for the subdivisions Konkan and Goa, Marathwada, Madhya Maharashtra subdivision, Vidarbha, West MP, Telangana and west Uttar Pradesh Rainfall for the subdivisions viz. east Uttar Pradesh, Bihar, east MP where winter rainfall is mostly due to western disturbances is also decreasing significantly. The decreasing pre-monsoon rainfall over most parts of the central India. The study concluded that the convective activity, which is the main cause for the rainfall activities during the pre-monsoon season, is decreasing over the central parts of the country. Rainfall is decreasing significantly for the six subdivisions viz. Gujarat Region, West M.P., East M.P., Vidarbha, Chhattisgarh and Jharkhand. Goswami et al. (2006) [7] visualized the negative impacts of rising global surface temperature and stability of the Indian monsoon rainfall over the past century and investigated the reasons behind this using a daily rainfall data set, and found significant rising trends in the frequency and the magnitude of extreme rain events and a significant decreasing trend in the frequency of moderate events over central India during the monsoon seasons from 1951 to 2000. The seasonal mean rainfall does not show a significant trend because of contribution from heavy events and decreasing moderate events and expected substantial increase in hazards related to heavy rain over central India in the future. Vijay kumar et al. (2010) [11] observed no significant trend for annual, seasonal, and monthly rainfall for the country as a whole. Annual and monsoon rainfall decreased, while pre-monsoon, post-monsoon and winter rainfall increased at national scale. Rainfall in June, July and September decreased, whereas August rainfall increased, at the national scale. Singh and Mal (2014) [25] studied rainfall trends and variability over western Himalaya and found declining trend in annual and monsoon rainfall over high altitudes and increasing over low altitude. Agarwal (1952) [1] investigated the trends in rainfall over central India and found a steady change which was not significant during 1908-1940. Kothyari et al. (1997) [10] , analysed for evaluation of changes in rainfall and temperature regimes in the upper and middle parts of the Ganga basin in northern India. The analysis shows that the total monsoon rainfall and the number of rainy days during the monsoon season are on the decline whereas the annual maximum temperature is on the rise. These changes are observed to have begun around the second half of the 1960's. The results point towards a possible change in the climatic regime. Parthsarthy and Dhar (1976) [37] observed increasing trend for annual rainfall over East MP and West MP for 1901-1960 periods. Indian summer monsoon rainfall and associated large scale circulation are mainly controlled by global parameter like ENSO and NAO, which are indicative of quantification of ocean atmosphere coupling in which sea surface temperature also plays influential role. Mooley and Parthasarathy (1983) [13] , investigated the relationships of indices of dryness and wetness over India with SOI and SST anomalies are expected to be useful in understanding implications of large-scale anomalies in performance of Indian summer monsoon. Rasmusson and Carpenter (1983) [21] and Shukla (1987) [36] studied the link between the interannual variability (IAV) in the Indian summer monsoon rainfall (ISMR) and the El Nino-Southern Oscillation (ENSO) phenomenon. Rajeevan et al. (2008) [20] examined variability and long-term trends of extreme rainfall events over central India using 104 years (1901-2004) of high resolution daily gridded rainfall data, variability and longterm trends of extreme rainfall events over central India and found inter-annual and inter-decadal variability of extreme rainfall events over India is influenced by the SST variations over the tropical Indian Ocean. The strong coupling between the equatorial Indian Ocean SST and very high rainfall (VHR) events over the central India suggests that in the present global warming scenario, the frequency of VHR events and risk of floods may increase over the central India. Yadav (2009) [32] studied inter-annual variability of the Indian summer monsoon rainfall (ISMR) in association with the variability surface temperature, the mean sea level pressure (MSLP), the tropospheric geopotential height and wind patterns over the globe for 1949-2005 period and found the El Nino-Southern Oscillation (ENSO) relationship over ISMR has weakened while the northwest (NW) of North Atlantic sea surface temperature (SST) relationship has increased recent decades. Yadav (2008) [33] established link between 2mST over tropical southwest Pacific and intensification of subtropical westerly jet over Indian Ocean and enhancement of monsoon circulation during negative phase of ENSO. While during non ENSO year positive relationship of ISMR with 2mST anomaly over northwest of North Atlantic Ocean. Srivastava et al. (2020) [26] observed ENSO impact on July and August rainfall and found significant changes at multidecadal time scale. The impact of ENSO was significantly strong in August and significantly week in July during 1948-1980 and post 1980s, ENSO monsoon relationship week in August than in July.
The present study investigates possible changing influence of southern Oscillation Index (SOI) and North Atlantic oscillation Index (NAO) on rainfall trends over MP.
Study area
Madhya Pradesh is also known as the "heart of India", owing to its central location is the second largest state in the country. It is surrounded by five states like Rajasthan, Chhattisgarh, Uttar Pradesh, Maharashtra and Gujarat, completely land locked. It is located between latitude 21.2°N-26.87°N and longitude 74°59'-82°06'E (figure 1a*). MP has a highly variable subtropical climate also influenced by presence of tropic of cancer which passing through 14 districts. According to Koppen and Geiger climate classification, the state has three main categories i.e. hot summer Mediterranean climate (Csa), tropical savana climate (Aw) and hot semi-arid climate (Bsh). Hot dry summer, followed by monsoon rains (July-September) and a cool and relatively dry winter are the main features of its climate.
Fig 1a:
Location map of the study area.
Data Used
The data of monthly rainfall (mm) over East MP and West MP meteorological subdivisions from 1871 to 2016 is obtained from Indian Institute of Tropical Meteorological (IITM) Indian regional/sub divisional Monthly Rainfall data set (IITM-IMR). This data series constructed by taking subdivision wise monthly rainfall data of IMD (Primary Data Source). SOI and NAO monthly data obtained from http://www.ncdc.noaa.gov.
Methodology
Rainfall characteristics such as mean, standard deviation (SD), coefficient of variation (CV) and percentage contribution to annual computed for monthly and seasonwise viz., Pre-monsoon (March-May), Monsoon (June-September), Post-monsoon (October-November) and Winter (December-February) for East MP and West MP meteorological subdivision and MP as a whole and compared with all India. The non-parametric Mann-Kendall test along with Sen's slope estimator are used for detection of trends in rainfall time series 1871-2016 and also to understand recent 50 years trend, considered 1957-2016 time series separately. The seasonal values of Southern Oscillation Index (SOI) and North Atlantic Oscillation (NAO) are prepared from monthly values and the correlation with seasonal and annual rainfall has been calculated.
Trend Analysis 3.1.1 Non-Parametric-Mann Kendall test for trend analysis
The parametric techniques generally used for assessing central tendency, linear relationship and change point identification. The parametric techniques are based on assumptions of homogeneity and normality. The parametric methods do not perform satisfactorily when there are outliers in the data sets and also if data sets have observations reported as being "less than" or "greater than" some specific values. Parametric methods require substituting some numerical value for such data points will lead to inexact estimate. Atmospheric variable like precipitation exhibit a marked skewness partly due to the influence of natural phenomena, and hence do not follow a normal distribution, (Mukherjee et al., 2014) [15] . The nonparametric techniques are distribution free and can handle presence of outliers in data series and can be used when data are non-normal (Lanzante, 1996) [12] . The Mann Kendall test derived by use of a rank correlation test for two groups of observations. If there is positive serial correlation in time series it may lead to significant trend detection without any actual trend (Cox and Stuart, 1955) [6] . Mann Kendall test (Mann, 1945) [14] a rank-based nonparametric method that has been used to detect trends in hydrological and meteorological time series such as water quality data in lakes and streams (Zetterqvist, 1991; Bouchard and Haemmerli, 1992) [34,3] , stream flow data (Chiew and McMahon, 1993; Burn, 1994) [5,4] and meteorological parameter like rainfall and temperature data (Shukla et al., 2017) [24] . Detail description or reference list of the Mann-Kendall trend test provided by (Hirsch et al., 1982) [9] . The behaviour of annual, seasonal and monthly time series of rainfall is studied by subjecting them to non-parametric Mann-Kendall test and increasing or decreasing slope of trends in the time series is determined by using Sen's method (Sen, 1968) [22] . The statistically significant trend detected by use of MK test can be complemented with Sen's slope estimation for magnitude of the trend. The test has carried out with the hypothesis (H0) that there is no trend in the rainfall time series but it has an alternative hypothesis (HA) that there is monotonic trend in rainfall time series. For hypothesis testing, the significance levels 0.05(*), 0.01 (* *), and 0.1(+) used for rejecting null hypothesis. The Sen's Slope estimator is a nonparametric, linear slope estimator that works on monotonic data. It is not affected by gross data errors, outliers, or missing data. The Sen's Slope technique is used to determine the magnitude of the trend line. The approach involves computing slopes for all the pairs of ordinal time points using the median of these slopes as an estimate of the overall slope. The calculations are done through the equations used by researchers (Patra et al., 2012) [18] . The positive value of test statistic indicates positive trend and negative value indicates negative trend and Sen"s slope further quantify the trend.
Results and Discussion
Results and Discussion
Characteristics of Rainfall
The rainfall characteristics of East MP, West MP and MP as a whole for the period of 1871-2016 and 1967-2016 are calculated. The mean annual rainfall of MP is 1102.0 mm with a standard deviation of 177.8 mm, coefficient of variance 16.1%, with monsoon contribution 90.1% for the period 1871-2016, whereas all India mean annual rainfall 10859 mm with standard deviation 1010 mm and coefficient of variance 9.3% with monsoon contribution 78.1%. The mean annual rainfall of MP, 1078.3 mm with a standard deviation of 171.1mm, coefficient of variation is 15.9% with monsoon season contribution of 89.7% for the period 1967-2016, whereas all India mean annual rainfall 10700.1 mm with a standard deviation 942.07 mm with monsoon contribution 77.8%. East MP subdivision, the mean annual rainfall is 1249.6 mm having standard deviation of 212.7 mm with coefficient of variance 17% and monsoon contribution 88.9% to annual rainfall for the period 1871-2016 and 1194.6 mm mean annual rainfall with a standard deviation of 214.0 mm, coefficient of variation is 17.9%, monsoon contributes 88.5% to the mean annual rainfall for period 1967-2016. West MP subdivision, the mean annual rainfall is 954.5 mm with a standard deviation of 176.5 mm, coefficient of variance 18.5%, with monsoon contribution 91.2% for the period 1871-2016 and 962.1 mm mean annual rainfall with a standard deviation of 162.9 mm, coefficient of variation is 16.9%, monsoon season contributes 91.3% to the mean annual rainfall for period 1967-2016. July and August month rainfall amount is very crucial for monsoon as about 64 to 66% of seasonal rainfall occur in these months for East MP and West MP subdivisions. However spatial and temporal daily rainfall distribution is very much variable over the state leading to flood and drought situations in different parts of the state, where as for all India, the mean rainfall of June, July, August and September is 163.1, 272.5, 242.2 and 170.3 mm respectively for 1871-2016. The rainfall of July month contributes 25% while August rainfall contributes 22.3% to the annual rainfall. The June and September rainfall contribute 15.1% and 15.7% to the annual rainfall respectively. The mean seasonal rainfall are 23.2 mm, 94.4 mm, 848.1 mm and 120.1 mm respectively.
Annual Trend
The trends are detected using non parametric Mann Kendall test and presented in Table 1 andTable 2. The statistical techniques are the way to generalize the results form a large data set and significance testing assures that the results are not by chance. The mean annual rainfall over MP showed a declining trend (Fig 2a) which is not significant while trends for West MP increasing but not significant (Fig. 2b). There is decrease of 55 mm mean rainfall compared to long-term mean annual rainfall for MP as a whole. The long-term trends for East MP subdivision are decreasing significantly at 0. The pre-monsoon rainfall has an increasing trend for MP state, West MP and East MP subdivision. The ten years moving average showing increasing signature from 1972 for MP (Fig. 2a) from 1960 for West MP subdivision (Fig. 2b) and from 1972 for East MP subdivision (Fig. 2c). There is increase of 2.47 mm in past ten year mean pre-monsoon rainfall for MP as compared to long-term mean rainfall for pre-monsoon. These trends are not significant. The all India pre-monsoon rainfall showing negative trend for whole 1871-2016 period while positive trend for recent fifty years period (1967-2016) but not significant (table 1 andtable 2).
| Months | All India | — | MP | — | East MP | — | West MP | — |
|---|---|---|---|---|---|---|---|---|
| Sen’s Slope | Test Z | Sen’s Slope | Test Z | Sen’s Slope | Test Z | Sen’s Slope | Test Z | |
| Jan | -0.09 | -0.69 | 0.00 | 0.40 | 0.01 | 0.73 | 0.00 | -0.27 |
| Feb | -0.05 | -0.42 | 0.00 | -0.17 | 0.00 | -0.13 | 0.00 | -0.30 |
| Mar | 0.05 | 0.32 | 0.01 | 1.45 | 0.01 | 1.04 | 0.00 | 1.08 |
| Apr | 0.26 | 1.57 | 0.01 | 1.38 | 0.01 | 1.19 | 0.00 | 1.29 |
| May | 0.06 | 0.18 | 0.00 | 0.24 | 0.01 | 0.53 | 0.00 | 0.04 |
| Jun | -1.37 | -1.66 | -0.37 | -2.32* | -0.42 | -2.39* | -0.28 | 2.06* |
| Jul | -1.07 | -1.69 | -0.22 | -1.14 | -0.60 | -2.57* | 0.15 | 0.83 |
| Aug | 0.71 | 0.89 | 0.22 | 1.19 | -0.01 | -0.05 | 0.42 | 2.12* |
| Sep | -0.67 | -0.92 | -0.23 | -1.30 | -0.23 | -1.23 | -0.23 | -1.21 |
| Oct | 0.32 | 0.59 | 0.03 | 0.85 | 0.02 | 0.51 | 0.02 | 1.14 |
| Nov | 0.04 | 0.13 | 0.00 | 0.25 | 0.00 | -0.16 | 0.00 | 0.98 |
| Dec | -0.03 | -0.26 | 0.00 | -1.16 | 0.00 | -0.15 | 0.00 | -0.59 |
| Winter | -1.05 | -0.58 | 0.01 | 0.32 | 0.03 | 0.57 | 0.01 | 0.20 |
| Pre-monsoon | -0.13 | -0.58 | 0.03 | 0.95 | 0.04 | 0.80 | 0.02 | 0.80 |
| Monsoon | 0.28 | 0.74 | -0.66 | -1.84+ | -1.24 | -2.98** | -0.09 | -0.21 |
| Post-monsoon | -2.06 | -1.28 | 0.02 | 0.31 | 0.00 | -0.04 | 0.04 | 0.64 |
| Annual | 0.41 | 0.57 | -0.52 | -1.42 | -1.13 | -2.53* | 0.12 | 0.26 |
| Legends:-+ : 0.1, * : 0.05, ** : 0.01 |
Table text extracted from the original PDF; superscript letters are shown inline. The original table image is below.
View original table image
Monsoon (June-September)
The monsoon is very important phenomena for economy and agriculture of the state. The land lock central state fully depends on monsoon for its water and associated requirements. The long-term monsoon trends are decreasing at 0.1 level of significance for the MP state (Fig. 3a). The observed trends are more or less constant over west MP subdivision (Fig. 3b) while the trends are significantly decreasing for East MP at 0.01 level (Fig. 3c). There is decrease of 99.147 mm and 196.15 mm in past ten year mean monsoon rainfall for EMP and MP as a whole compared to long-term mean rainfall for monsoon. The uneven spatial distribution of rainfall in monsoon and year to year variability are precursors of climate change over the state. The all India monsoon rainfall showing nonsignificant positive trends for 1871-2016 and 1967-2016 period (Table 1 andTable 2). 4a), 0.1 level over West MP (Fig. 4b) and no significant trend in East MP (Fig. 4c). The all India post-monsoon trends are negative for the whole 1871-2016 period.
Winter (January-February)
The long-term trends for winter season for West MP, East MP and MP state are nearly constant (Fig. 5a,5b,5c). The winter season contributes 2.5 to annual rainfall for the state and it is mainly due to influencing western disturbances.
The frequency of western disturbances and penetration of trough to lower latitude contributes good rainfall during the season. The all India winter rainfall trends are negative for 1871-2016 and 1967-2016 period but not significant.
Monthly rainfall trends
Monthly rainfall trends for all months have been observed by Mann-Kendall test and time series also fragmented into two parts to identify recent monthly trends. The results are shown in Table 1 andTable 2 September and December rainfall trends are decreasing over the state. The trends are not significant in rest months for the state while monthly trends are not significant for all India in recent fifty years.
Decadal variations in annual and seasonal rainfall
The decadal mean and its departure from normal for annual, seasonal rainfall and frequency of excess and deficient years are presented in (Table 3, Table 4, and Table 5). The rainfall greater than one standard deviation from mean is termed as excess rainfall and less than one standard deviation from mean is termed as deficit rainfall. West MP subdivision sharing boundaries with Rajasthan, Gujarat and Maharashtra decadal mean rainfall during (1871-1880) in monsoon season, four excess and one deficient and during six decades (1951-2010) five excess and nine deficient years observed. Annual rainfall over West MP during (1871-1900), three excess and three deficient and during (1901-1930), three excess and ten deficient years were observed. During 1871-2016, excess rainfall years are greater than deficient rainfall years for winter, pre-monsoon and post monsoon while deficient years are greater than excess rainfall years for monsoon season and also on annual basis. East MP subdivision touching boundaries of Uttar Pradesh, Chhattisgarh and Vidarbh region, the decadal mean monsoon rainfall during three decades (1871-1900), seven excess and three deficient and during recent six decades (1951-2010) only five excess and nine deficient years were observed. Trend of excess monsoon rainfall years are decreasing. No excess year was observed for post-monsoon season during (1951-2010). No deficient and no excess years for winter season during (1931-1960). During (1871-2016), twenty-four excess and twenty-one deficient years are there on annual basis. Over the MP state as a whole during initial five decades (1911-1960), twelve excess and six deficient years were noticed while recent five decades (1961-2010) five excess and eleven deficient years for monsoon and five excess and seven deficient years for postmonsoon season are there. This again confirms the decreasing post-monsoon rainfall over the state in recent fifty years. The total numbers of excess rainfall years are greater than deficient years for annual and seasonal basis. Monsoon season is mainly rain giving season for MP and excess and deficient rainfall frequencies seem to have some signals of fifty years transition period for decadal deficient years to decadal excess year.
| Decade | Annual | — | — | Pre-monsoon | — | — | Monsoon | — | — | Post-monsoon | — | — | Winter | — | — |
|---|---|---|---|---|---|---|---|---|---|---|---|---|---|---|---|
| Decadal Mean | Excess | Deficit | Decadal Mean | Excess | Deficit | Decadal Mean | Excess | Deficit | Decadal Mean | Excess | Deficit | Decadal Mean | Excess | Deficit | |
| 1871–1880 | 1.7 | 2 | 0 | 8.7 | 1 | 1 | 4.6 | 2 | 1 | -31.5 | 0 | 0 | −24.2 | 1 | 2 |
| 1881–1890 | 9.2 | 2 | 0 | −2.0.4 | 0 | 1 | 10.5 | 2 | 1 | 29.9 | 3 | 0 | −33.8 | 1 | 4 |
| 1891–1900 | 1.8 | 2 | 1 | 28.1 | 1 | 3 | 3.3 | 3 | 1 | −9.8 | 2 | 3 | 5.8 | 1 | 1 |
| 1901–1910 | 3 | 0 | 2 | 4.5 | 0 | 1 | -5.5 | 1 | 2 | −21.6 | 2 | 3 | 2.6 | 2 | 0 |
| 1911–1920 | 4.5 | 3 | 3 | 36.2 | 2 | 0 | 0.8 | 2 | 3 | 15.3 | 2 | 1 | 15.5 | 1 | 2 |
| 1921–1930 | 6.9 | 2 | 0 | 0.5 | 1 | 2 | 4.5 | 2 | 1 | 22.6 | 3 | 1 | −19.1 | 0 | 2 |
| 1931–1940 | 6.8 | 2 | 0 | 15.8 | 1 | 0 | 6.1 | 1 | 0 | 19.9 | 2 | 1 | 1.5 | 0 | 0 |
| 1941–1950 | -0.1 | 1 | 1 | -6 | 1 | 0 | 5.1 | 2 | 1 | 0.1 | 3 | 1 | 74.3 | 0 | 0 |
| 1951–1960 | -5.5 | 2 | 1 | −1.2 | 2 | 0 | 0 | 1 | 0 | 5.4 | 0 | 1 | −8.6 | 3 | 0 |
| 1961–1970 | −1.1 | 1 | 2 | -21.9 | 1 | 0 | −4.2 | 1 | 2 | −19.9 | 0 | 1 | -21.3 | 2 | 1 |
| 1971–1980 | −50 | 2 | 3 | −2.4 | 0 | 2 | −6.1 | 1 | 3 | 30.7 | 0 | 0 | −5.3 | 4 | 1 |
| 1981–1990 | −3.5 | 1 | 1 | 3.6 | 0 | 0 | −3.2 | 1 | 2 | −16.7 | 0 | 0 | 44.3 | 1 | 2 |
| 1991–2000 | -13.8 | 2 | 2 | 3.6 | 0 | 0 | −13.6 | 1 | 1 | −0.8 | 0 | 2 | -27.5 | 1 | 1 |
| 2001–2010 | 1.2 | 0 | 5 | 35.4 | 0 | 1 | 0.6 | 0 | 2 | -14 | 0 | 1 | −29.6. | 1 | 1 |
| 2010-2016 | 1.6 | 2 | 0 | 21.3 | 1 | 0 | 0.6 | 2 | 2 | -22.4 | 1 | 1 | 24.4 | 1 | 1 |
Table text extracted from the original PDF; superscript letters are shown inline. The original table image is below.
View original table image
| Decade | Annual | — | — | Pre-monsoon | — | — | Monsoon | — | — | — | Post-monsoon | — | — | — | Winter | — | — |
|---|---|---|---|---|---|---|---|---|---|---|---|---|---|---|---|---|---|
| Decadal Mean | Excess | Deficit | Decadal Mean | Excess | Deficit | Decadal Mean | Excess | Deficit | Decadal Mean | Excess | Deficit | Decadal Mean | Exces | sDeficit | |||
| 1871–1880 | 4.6 | 1 | 1 | 15.6 | 0 | 0 | 6.8 | 4 | 1 | -27.9 | 0 | 3 | −2.1 | 2 | 2 | ||
| 1881–1890 | 4.7 | 2 | 0 | -7.8 | 0 | 0 | 4.9 | 2 | 1 | 16.2 | 3 | 0 | −26.3 | 1 | 1 | ||
| 1891–1900 | -4.6 | 0 | 2 | -24 | 1 | 2 | -2.8 | 0 | 2 | −30.6 | 2 | 1 | -4.2 | 1 | 1 | ||
| 1901–1910 | -14.6 | 0 | 4 | -13.4 | 1 | 0 | -13 | 0 | 4 | −46.7 | 2 | 2 | -8.7 | 2 | 0 | ||
| 1911–1920 | -7.3 | 3 | 4 | 52 | 2 | 0 | -10.3 | 2 | 4 | 13.3 | 2 | 1 | 32.2 | 0 | 3 | ||
| 1921–1930 | -83 | 0 | 2 | -35.7 | 0 | 1 | -9.1 | 0 | 2 | 15.3 | 3 | 1 | 3.8 | 1 | 1 | ||
| 1931–1940 | 9.3 | 3 | 0 | -18.3 | 0 | 0 | 9.3 | 2 | 0 | 24.3 | 2 | 0 | -48 | 0 | 0 | ||
| 1941–1950 | 13.6 | 4 | 1 | -12.6 | 1 | 0 | 13.8 | 4 | 0 | 3.8 | 3 | 1 | 63.3 | 3 | 0 | ||
| 1951–1960 | 13 | 2 | 1 | 5.9 | 1 | 0 | 0.2 | 1 | 1 | 18.41 | 0 | 0 | 6.1 | 0 | 0 | ||
| 1961–1970 | -0.5 | 1 | 2 | -13.8 | 1 | 0 | 0.8 | 1 | 2 | −11.4 | 0 | 1 | -25.8 | 0 | 2 | ||
| 1971–1980 | 5 | 1 | 1 | −20 | 0 | 0 | 5 | 1 | 1 | 23.3 | 0 | 0 | −18.8 | 1 | 0 | ||
| 1981–1990 | -2.1 | 0 | 2 | 12.9 | 1 | 1 | −4.3 | 0 | 1 | 24.9 | 0 | 0 | 26.2 | 3 | 0 | ||
| 1991–2000 | 0.7 | 1 | 3 | 29.1 | 1 | 0 | −0.7 | 1 | 1 | 23.5 | 0 | 1 | -19.6 | 1 | 0 | ||
| 2001–2010 | -10.5 | 1 | 0 | 12.8 | 1 | 0 | -10.5 | 1 | 3 | -13.5 | 0 | 0 | −23.3. | 0 | 1 | ||
| 2010-2016 | 14.4 | 1 | 0 | 21.2 | 1 | 0 | 16.6 | 2 | 0 | -54.9 | 1 | 2 | 88.1 | 3 | 0 |
Table text extracted from the original PDF; superscript letters are shown inline. The original table image is below.
View original table image
| Decade | Annual | — | — | Pre-Monsoon | — | — | Monsoon | — | — | — | Post- Monsoon | — | Winter | — | — |
|---|---|---|---|---|---|---|---|---|---|---|---|---|---|---|---|
| Decadal mean | Excess | Deficit | Decadal mean | Excess | Deficit | Decadal mean | Excess | Deficit | Decadal mean | Excess | Deficit | Decadal mean | Excess | Deficit | |
| 1871-1870 | 3 | 3 | 1 | -4 | 1 | 1 | 5.6 | 3 | 1 | -29.9 | 1 | 3 | −17.7 | 1 | 2 |
| 1881–1890 | 7.3 | 2 | 0 | −16.3 | 0 | 2 | 8 | 3 | 0 | 24.3 | 3 | 0 | −31.6 | 0 | 4 |
| 1891–1900 | -1 | 2 | 2 | -26.3 | 1 | 3 | 0.6 | 1 | 1 | −18.5 | 1 | 2 | −3.1 | 1 | 1 |
| 1901–1910 | −9.6 | 0 | 3 | -1.5 | 1 | 0 | -8.8 | 0 | 3 | −32.2 | 1 | 4 | -0.5 | 2 | 1 |
| 1911–1920 | -1.5 | 3 | 3 | 41.4 | 3 | 0 | -4.1 | 2 | 3 | 14.6 | 2 | 1 | 20.4 | 1 | 2 |
| 1921–1930 | -1 | 1 | 0 | −11.6 | 0 | 1 | -1.5 | 1 | 0 | 19.7 | 2 | 1 | −14.6 | 0 | 2 |
| 1931–1940 | 7.9 | 2 | 0 | −16.6 | 1 | 0 | 7.5 | 1 | 0 | 21.9 | 2 | 1 | 16.6 | 0 | 0 |
| 1941–1950 | 9.7 | 4 | 1 | −8.3 | 1 | 0 | 8.9 | 5 | 1 | 1.8 | 2 | 1 | -8.3 | 4 | 0 |
| 1951–1960 | 0.5 | 2 | 2 | 1.1 | 0 | 0 | 0.1 | 0 | 1 | 11 | 2 | 0 | −1.1 | 1 | 0 |
| 1961–1970 | −3.3 | 1 | 2 | −6.5 | 1 | 0 | −2.0 | 1 | 2 | -16.2 | 1 | 1 | -6.5 | 1 | 2 |
| 1971–1980 | 1.6 | 3 | 2 | −21.3 | 1 | 2 | 0.8 | 2 | 2 | 27.7 | 0 | 2 | −21.3 | 2 | 1 |
| 1981–1990 | -3.7 | 1 | 1 | 2.7 | 1 | 0 | −5.3 | 1 | 2 | 0.9 | 2 | 0 | 2.7 | 4 | 1 |
| 1991–2000 | -1.7 | 2 | 2 | 12.1 | 2 | 0 | −2.1 | 1 | 2 | 11.7 | 1 | 1 | 12.1 | 1 | 2 |
| 2001–2010 | -12.3 | 0 | 5 | 4.5 | 2 | 1 | -12.3 | 0 | 3 | -13.7 | 1 | 1 | 4.5 | 1 | 1 |
| 2010-2016 | 6.9 | 1 | 0 | 30.6 | 1 | 0 | 7.6 | 2 | 1 | -36.1 | 0 | 2 | 30.6 | 2 | 1 |
Table text extracted from the original PDF; superscript letters are shown inline. The original table image is below.
View original table image
Tele-connections
The Southern Oscillation Index (SOI) is a measure of strength of the walker circulation and also indicative of El Niño and La Niña events and impact on Indian monsoon. The SOI measures the difference in surface air pressure between Tahiti and Darwin. The correlation between Indian monsoon rainfall and Southern Oscillation Index (SOI) was first explained by Walker (1923-1924) [28,29] . The Southern Oscillation Index (SOI) is the atmospheric component of ENSO. The studies in recent years showed strong interdecadal variability in the ENSO cycle and due to this, state of Pacific Ocean and its influence on monsoon is also variable on decadal scale (Webster et al.1998) [30] . Various research studies have done to explore relationship between rainfall and oceanic index SOI. The rainfall trends and the possible link with of SOI and NAO are investigated (Fig. 6 and Fig. 7) for annual and seasonal rainfall over the state. SOI has positive correlation with annual and seasonal rainfall over East MP and west MP subdivisions and MP except winter season for 1876-2016 period.
Figures and tables from the paper
| Months | All India | — | MP | — | East MP | — | West MP | — |
|---|---|---|---|---|---|---|---|---|
| Sen’s Slope | Test Z | Sen’s Slope | Test Z | Sen’s Slope | Test Z | Sen’s Slope | Test Z | |
| Jan | -0.18 | -0.39 | -0.02 | -0.26 | -0.06 | -0.74 | 0.01 | 0.49 |
| Feb | -0.07 | -0.17 | -0.03 | -0.34 | -0.07 | -0.61 | 0.00 | -0.34 |
| Mar | 0.00 | 0.00 | 0.00 | 0.03 | 0.01 | 0.22 | 0.01 | 0.23 |
| Apr | 0.70 | 0.75 | 0.04 | 1.05 | 0.07 | 1.22 | 0.00 | 0.25 |
| May | 1.53 | 1.10 | 0.03 | 0.23 | 0.05 | 0.61 | 0.00 | 0.05 |
| Jun | 2.20 | 0.62 | 0.04 | 0.04 | 0.30 | 0.33 | -0.13 | -0.23 |
| Jul | -2.07 | -0.57 | 1.23 | 1.66+ | 0.52 | 0.49 | 1.81 | 1.90+ |
| Aug | -4.46 | -1.27 | -2.18 | -2.20* | -2.69 | -2.26* | -1.67 | -1.73+ |
| Sep | 2.24 | 0.66 | -0.70 | -1.00 | -0.85 | -1.01 | -0.59 | -0.61 |
| Oct | 0.22 | 0.13 | 0.11 | 0.57 | 0.18 | 0.69 | 0.02 | 0.16 |
| Nov | -0.25 | -0.28 | 0.00 | 0.29 | 0.00 | 0.22 | 0.00 | -0.12 |
| Dec | -0.61 | -1.02 | -0.01 | -1.15 | 0.00 | -0.97 | 0.00 | -0.94 |
| Winter | -2.86 | -0.33 | 0.00 | 0.05 | 0.02 | -0.43 | 0.03 | 0.76 |
| Pre-monsoon | 0.31 | 0.31 | 0.01 | 0.27 | 0.21 | 0.50 | -0.03 | -0.46 |
| Monsoon | 2.20 | 1.04 | -0.01 | -1.19 | 0.01 | -1.31 | 0.03 | -0.47 |
| Post-monsoon | -4.80 | -0.79 | -1.19 | -2.01* | 0.01 | -1.40 | -0.58 | -1.80+ |
| Annual | -1.91 | -0.66 | -0.53 | -1.24 | -0.51 | -1.20 | 0.04 | -0.42 |
| Legends:-+ : 0.1, * : 0.05, ** : 0.01 |
Table text extracted from the original PDF; superscript letters are shown inline. The original table image is below.
View original table image
References
35 in the original paper- Agarwal KS. Fluctuations of annual rainfall in central India 1872-1947. Indian Journal of Meteorlogy & Geophysics. 1952;3(3):229-230.
- Bouchard A, Haemmerli J. Trend detection in water quality time series of LRTAP-quebec network lakes. Water, Air, & Soil Pollution. 1992;62(1-2):89-110. DOI:10.1007/bf00478455.
- Burn DH. Hydrologic effects of climatic change in west-central Canada. Journal of Hydrology. 1994;160(1-4):53-70. DOI:10.1016/0022-1694(94)90033-7.
- Chiew FHS, McMahon TA. Detection of trend or change in annual flow of Australian rivers, International Journal of Climatology. 1993;13(6):643-653.
- Cox DR, Stuart A. Some quick sign tests for trend In location and dispersion. Biometrika. 1955;42(1-2):8095. DOI:10.2307/2333424
- Goswami BN, Venugopal V, Sengupta D, Madhusoodanan MS, Xavier PK. Increasing trend of extreme rain events over India in a warming environment, Science. 2006;314(5804):1442-1445. Doi:10.1126/science.1132027.
- Guhathakurta P, Rajeevan M. Trends in the rainfall pattern over India. International Journal of Climatology. 2008;28(11):1453-1469. DOI:10.1002/joc.1640.
- Hirsch RM, Slack JR, Smith RA. Techniques of trend analysis for monthly water quality data, Water Resources Research. 1982;18(1):107-121. DOI:10.1029/wr018i001p00107
- Kothyari UC, Singh VP, Aravamuthan V. An Investigation of Changes in Rainfall and Temperature Regimes of the Ganga Basin in India. Water Resource Management. 1997;11(1):17-34. Doi:10.1023/a:1017936123283
- Kumar V, Jain SK, Singh Y. Analysis of long-term rainfall trends In India. Hydrological Sciences Journal. 2010;55(4):484-496. DOI:10.1080/02626667.2010.481373
- Lanzante JR. Resistant, robust and non-parametric techniques for the analysis of climate data: Theory and examples including application to historical radiosonde station data. International Journal of Climatology. 1996;16(11):1197-1226. DOI:10.1002/(sici)10970088(199611)16:11<1197::aid-joc89>3.0.co;2-l.
- Mooley DA, Parthasarathy B. Variability of the Indian Summer Monsoon and Tropical Circulation Features. Monthly Weather Review. 1983;111(5):967-978. Doi:10.1175/15200493(1983)111<0967:votism>2.0.co;2.
- Mann HB. Nonparametric tests against trend, Econometrica. 1945;13(3):245. DOI:10.2307/1907187.
- Mukherjee S, Joshi R, Prasad RC, Vishvakarma SCR, Kumar K. Erratum to: summer monsoon rainfall trends in the Indian Himalayan region. Theoretical and Applied Climatology. 2014;121(3-4):803-805. DOI:10.1007/s00704-014-1319-4.
- Naidu CV, Rao SBR, Rao BDV. Climatic trends and periodicities of annual rainfall over India, Meteorological Applications. 1999;6(4):395-404. DOI:10.1017/s1350482799001358
- Parthasarthy B, Dhar ON. Study of trends and periodicities of rainfall over M.P. Proceedings of the Indian National Science Academy. 1976;42-A(1):7380.
- Patra JP, Mishra A, Singh R, Raghuwanshi NS. Detecting rainfall trends in twentieth century (18712006) over Orissa State, India, Climatic Change. 2011;111(3-4):801-817. DOI:10.1007/s10584-011-0215-5.
- Radhakrishnan K, Sivaraman I, Jena SK, Sarkar S, Adhikari S. A Climate Trend Analysis of Temperature and Rainfall in India, Climate Change and Environmental Sustainability. 2017;5(2):146-153. DOI:10.5958/2320-642x.2017.00014.x.
- Rajeevan M, Bhate J, Jaswal AK. Analysis of variability and trends of Extreme Rainfall Events over India Using 104 Years of Gridded Daily Rainfall Data. Geophysical Research Letters, 2008;35(23):1-6. DOI:10.1029/2008gl036105
- Rasmusson EM, Thomas HC. The relationship between eastern equatorial Pacific sea surface temperatures and rainfall over India and Sri Lanka. Monthly Weather Review. 1983;111(3):517-528. DOI:10.1175/15200493(1983)111<0517:trbeep>2.0.co;2.
- Sen PK. Estimates of the regression coefficient based on Kendall's tau, Journal of The American Statistical Association. 1968;63(324):1379-1389. DOI:10.1080/01621459.1968.10480934
- Shukla R, Khare D, Tiwari P, Mishra P, Gupta S. Analysis of long-term temperature trend for Madhya Pradesh, India (1901-2005), Current World Environment. 2017;12(1):68-79. DOI:10.12944/cwe.12.1.09.
- Singh RB, Mal S. Trends and Variability of Monsoon and Other Rainfall Seasons in Western Himalaya, India, Atmospheric Science Letters. 2014;15(3):218-226. DOI:10.1002/asl2.494.
- Srivastava G, Chakraborty A, Nanjundiah RS. Multidecadal variations In ENSO-Indian Summer Monsoon relationship at sub-seasonal timescales. Theoretical and Applied Climatology. 2020;140(34):1299-1314. DOI:10.1007/s00704-020-03122-6.
- Sekhar PH, Dr. Poola K, Sekhar KR, Dr. Naidu MB. Modelling and prediction of coastal Andhra rainfall using ARIMA and ANN models. International Journal of Statistics and Applied Mathematics. 2020;5(6):104110.
- Walker GT. Correlation in seasonal variations of weather, VIII: A preliminary study of world weather, Mem. India Meteor. Dep; 1923;24:75-131.
- Walker GT. Correlation in seasonal variations of weather, IX: A further study of world weather, Mem. India Meteor. Dep. 1924;24:275-332
- Webster PJ, Magana VO, Palmer TN, Shukla J, Tomas RA, Yanai M, et al. Monsoons: Processes, predictability, and the prospects for prediction. Journal of Geophysical Research: Oceans. 1998;103(C7):14451-14510. DOI:10.1029/97jc02719
- Xu Z, Liu Z, Fu G, Chen J. Trends of major hydroclimatic variables In the Tarim river basin during the past 50 years. Journal of Arid Environments. 2010;74(2):256-267. DOI:10.1016/j.jaridenv.2009.08.014.
- Yadav RK. Changes In The large-scale features associated with the Indian Summer Monsoon in the recent decades, International Journal Of Climatology. 2009;29(1):117-133. DOI:10.1002/joc.1698.
- Yadav RK. Role of equatorial Central Pacific and northwest of North Atlantic 2-metre surface temperatures in modulating Indian summer monsoon variability, Climate Dynamics. 2008;32(4):549-563. DOI:10.1007/s00382-008-0410-
- Zetterqvist L. Statistical Estimation and Interpretation of Trends In Water Quality Time Series, Water Resources Research. 1991;27(7):1637-1648. DOI:10.1029/91wr00478.
- Kumar S, Rosenberg JM, Bouzida D, Swendsen RH, Kollman PA. The weighted histogram analysis method for free-energy calculations on biomolecules. I. The method. Journal of Computational Chemistry. 1992;13(8):1011-21.
- Shukla J. Interannual variability of monsoons. Journal of Climate 1987;14:399-464.
- Parthasarathy B, Dhar ON. A study of trends and periodicities in the seasonal and annual rainfall of India. MAUSAM. 1976;27(1):23-28.
Cited by 9
From OpenAlex, OpenCitations and reference lists read by Scinovex
- Assessing seasonal variation and trends in rainfall patterns of Madhya Pradesh, Central India ↗
Amit Kumar, Siddharth Kumar, Kuldeep Singh Rautela, Sulochana Shekhar, Tapas Ray, Mohanasundari Thangavel · Journal of Water and Climate Change · 2023
Abstract Climate change is a worldwide problem caused by various anthropogenic activities, leading to changes in hydroclimatic variables like temperature, rainfall, riverine flow, and extreme hydrometeorological events. In India, significant changes are noted in its natural resources and agriculture sectors. In this study, we analysed the long-term spatio-temporal change in rainfall patterns of Madhya Pradesh, Central India, using Indian Meteorological…
❝ 39PDF - Unravelling the dynamics of rainfall patterns in Bihar, India: A comprehensive spatiotemporal analysis ↗
Amit Kumar, Mohanasundari Thangavel · Environmental Science and Pollution Research · 2025
❝ 16 - Perceptions of climate change and it’s impacts on tribal livelihoods: an empirical study from central India ↗
Amit Kumar, Mohanasundari Thangavel · Natural Hazards · 2025
❝ 9 - Integrated assessment of livelihood vulnerability to climate Variability: An empirical study of tribal communities in chhindwara district, central India ↗
Amit Kumar, Juna Probha Devi, Mohanasundari Thangavel · Journal of Arid Environments · 2025
❝ 9 - Perceptions and impacts of climate change in Central India: A study of tribal communities ↗
Amit Kumar, Juna Probha Devi, B. Dhanya, Sulochana Shekhar, Uday Chatterjee, Mohanasundari Thangavel · Theoretical and Applied Climatology · 2025
❝ 4 - Trend and variability analysis of rainfall at Jaldhaka River Basin in the Himalayan Foreland, India ↗
Mantu Das, Snehasish Saha · Discover Applied Sciences · 2025
Abstract Understanding the mechanics of future climate and land use requires an understanding of hydrological consequences, which include changes in soil usage. The study's analysis of rainfall data from 13 monitoring stations spread over the Jaldhaka River Basin on monthly, seasonal and annual time periods revealed the substantial temporal pattern. Using data from 1901 to 2022 (122 years) from thirteen…
❝ 1PDF - Impacts of precipitation shifts and warming trends in tropical deciduous forests of Central India ↗
Gajendra Kumar, Amit Kumar, Purabi Saikia · Anthropocene · 2025
❝ 1 - Deciphering changing rainfall patterns across the hydroclimatic spectrum in Central India ↗
Gore Vikas Sudam, Alka Sharma, Priyank J. Sharma · Acta Geophysica · 2026
❝ 0 - DECADAL CLIMATE VARIABILITY AND CHANGE IN EDO STATE, NIGERIA ↗
Augustine Iyekeoretin Agbonaye, Osadolor Christopher Izinyon · Journal of Civil Engineering Science and Technology · 2025
This study examines the decadal variability of temperature and rainfall in Edo State, Nigeria. This is crucial for decision-making in various industries like infrastructure, water resources, agriculture, and energy. The study utilized gridded Climate Research data from 25 local communities between 1956 and 2016, cross-checked against Nigerian Meteorological Agency (NiMet) data, and applied various time series analysis methods. The results…
❝ 0PDF