
Research article · 2023 · Full text
International Journal of Geography Geology and EnvironmentAssessment and spatial distribution of groundwater quality in Bidadi industrial area, Ramanagara district, Karnataka using water quality index (WQI) and GIS
Volume 5(1) · Pages 111–128 · DOI: 10.22271/27067483.2023.v5.i1b.149 ↗
Research areasWater Quality and Pollution AssessmentWater Quality Monitoring and AnalysisGroundwater and Watershed Analysis
Abstract
Author-writtenOver time, there has been a rise in water consumption, which has caused water shortages throughout the world. The problem of water pollution makes the situation much worse. India is experiencing a freshwater crisis, partly as a result of poor water management practises and pollution, which restrict access to reliable water sources. States around the nation are seriously at risk from industrial pollution. The dangers posed by industrial waste are significant in several states across the nation. Ground water samples from 46 sources, were collected from Bidadi Industrial for the physico-chemical assessment and were analyzed as per BIS:10500-2015 standards for physical and chemical parameters. Parameters such as the pH, Hardness, Potassium, Calcium and Sodium were found to be breaching the drinking water standards but the over all WQI of Bidadi Industrial area is Good (50.75).
Summary
Source-checkedPlain-language reading of the full paper, prepared with AI and checked against the text. Each point links to the authors' own words.
Why it matters
- India faces a freshwater crisis driven by pollution and poor water management, which limits access to reliable water sources. View evidence ↗
- Rapid urbanization and industrialization have led to a decline in the quality of both surface and groundwater. View evidence ↗
- Heavy metals in groundwater exceeding allowable limits can cause significant health risks to humans and damage ecosystems. View evidence ↗
The question
- The study aims to evaluate groundwater drinking standards in the Bidadi Industrial Area using GIS, Remote Sensing, and water quality indexing. View evidence ↗
What they did
- Physico-chemical assessments were performed on groundwater samples collected from 46 sources in the Bidadi Industrial area, following BIS:10500-2015 standards. View evidence ↗
- The Water Quality Index (WQI) was calculated based on 15 parameters, including pH, conductivity, TDS, hardness, and various ions. View evidence ↗
- ArcGIS software was used to create iso-contour maps to analyze the spatial variation of water quality parameters. View evidence ↗
What they found
- The overall Water Quality Index (WQI) for the Bidadi Industrial area was 50.75, which is classified as 'Good'. View evidence ↗
- Sodium levels were the most frequent violation, with 82.14% of samples exceeding permissible limits. View evidence ↗
- Potassium levels exceeded permissible limits in 57.14% of the water samples. View evidence ↗
- Total Hardness exceeded permissible limits in 28.57% of the samples. View evidence ↗
- Chloride, bicarbonate, nitrate, sulphate, fluoride, and electrical conductivity were within permissible ranges for all samples. View evidence ↗
- Turbidity varied spatially, with the highest concentrations (0.6 to 3.5 NTU) found in the northern part of the area. View evidence ↗
What it means
- The authors conclude that because the overall WQI is 'Good', there is currently no risk associated with the water. View evidence ↗
- The authors state that more effective and rapid monitoring measures are needed to maintain a healthy environment and track water quality. View evidence ↗
Visual summary
1 visualsIllustrations explain the paper; they do not show study data.
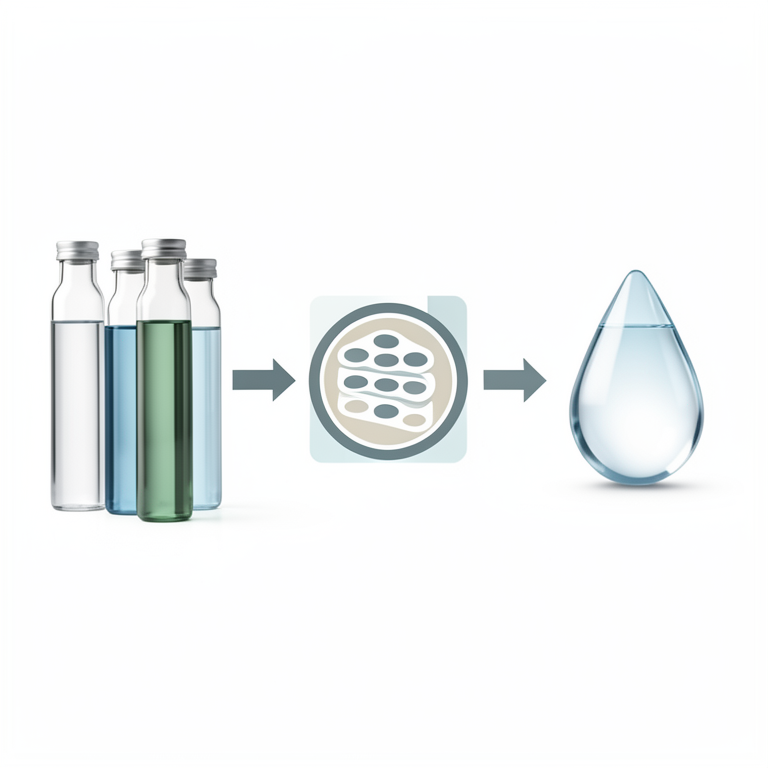
WQI Calculation Flow
AI-generated conceptual illustration (Groundwater from an industrial area). It explains the idea and does not show study data.
View source evidence ↗Figures & tables
From the original paper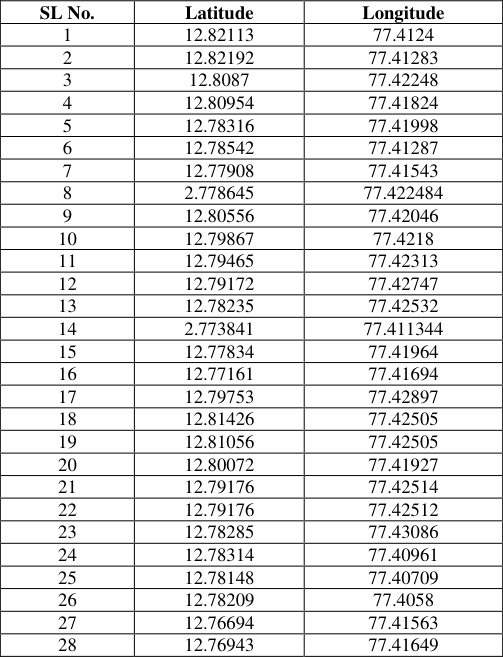 Table 1
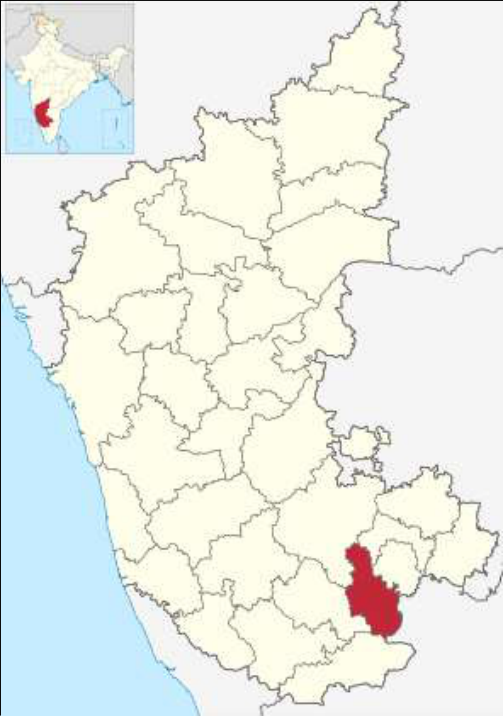 Figure 1
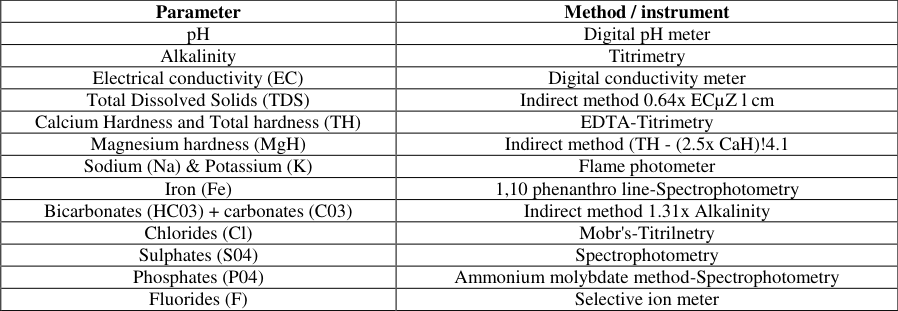 Table 2
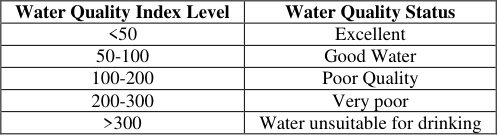 Table 3
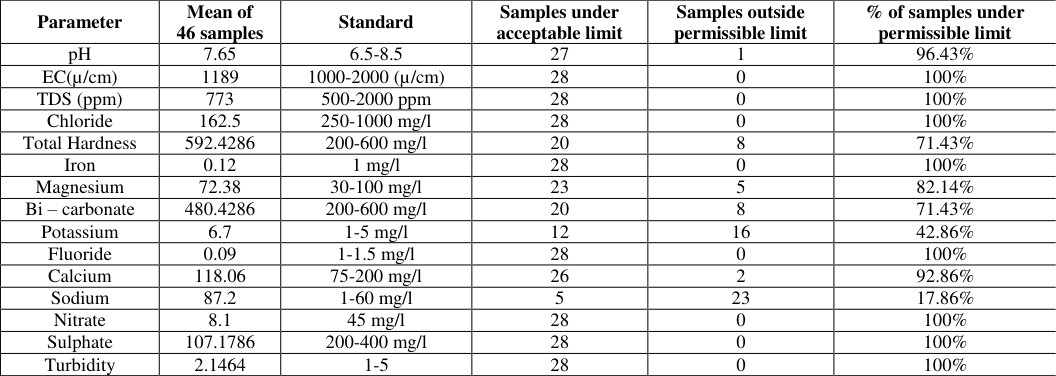 Table 4
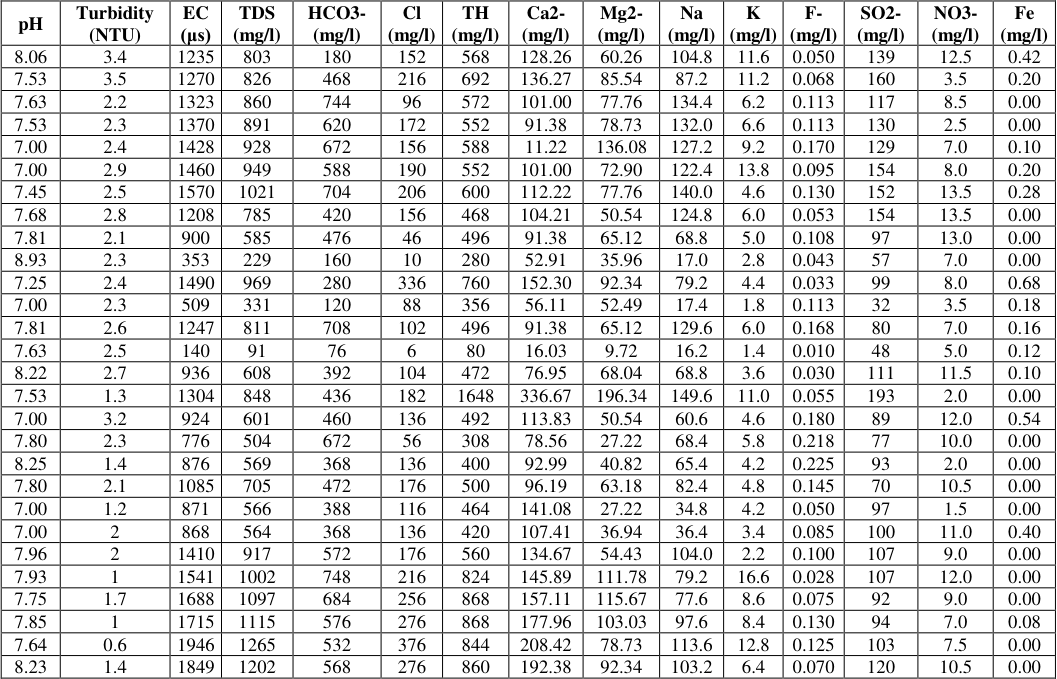 Table 5
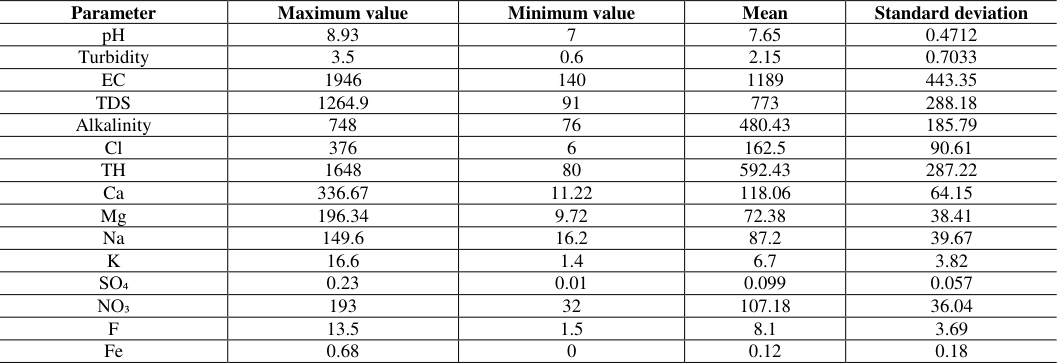 Table 6
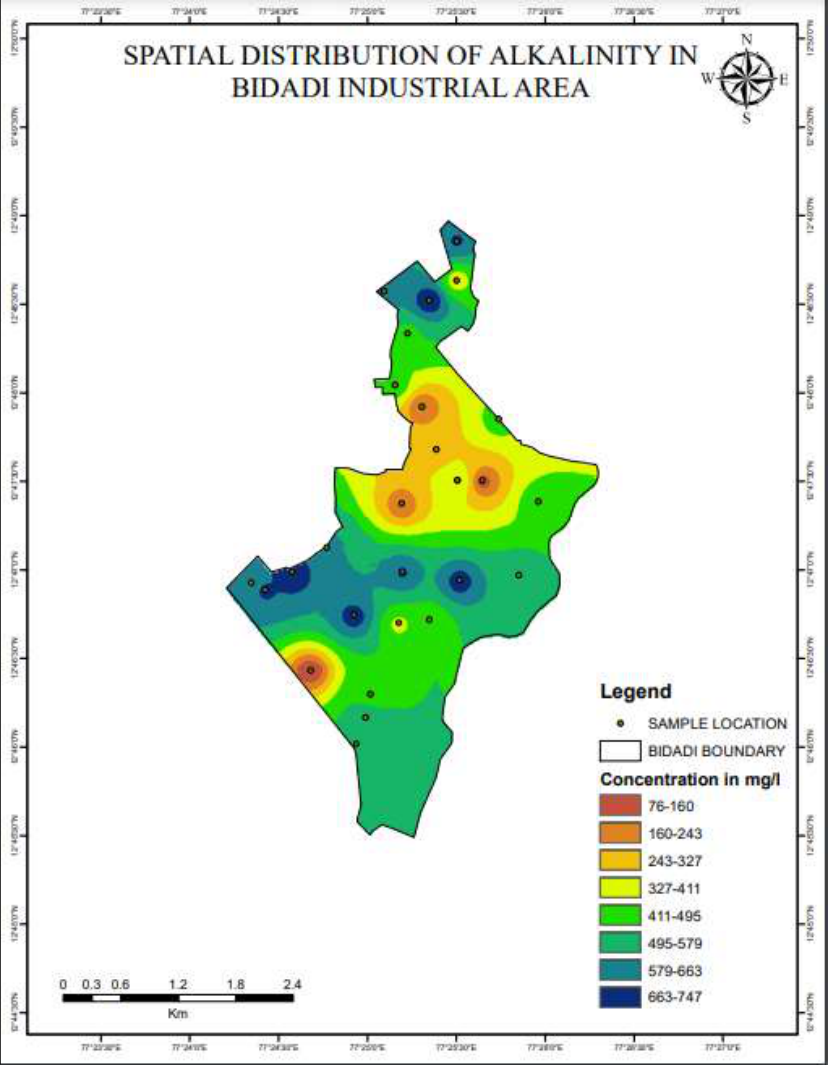 Figure 2
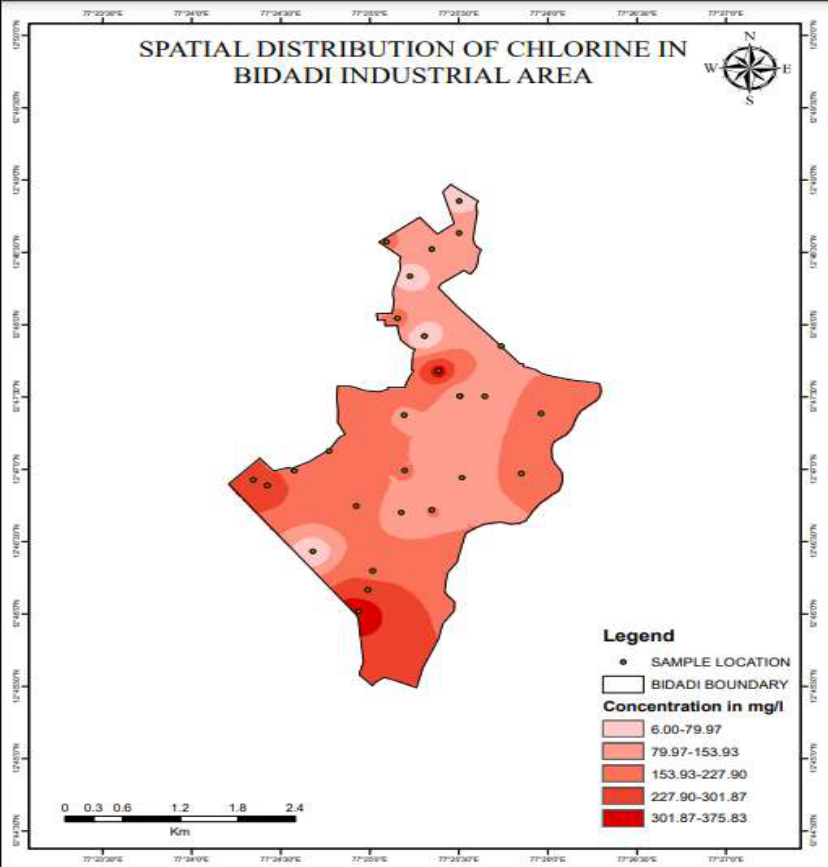 Figure 3
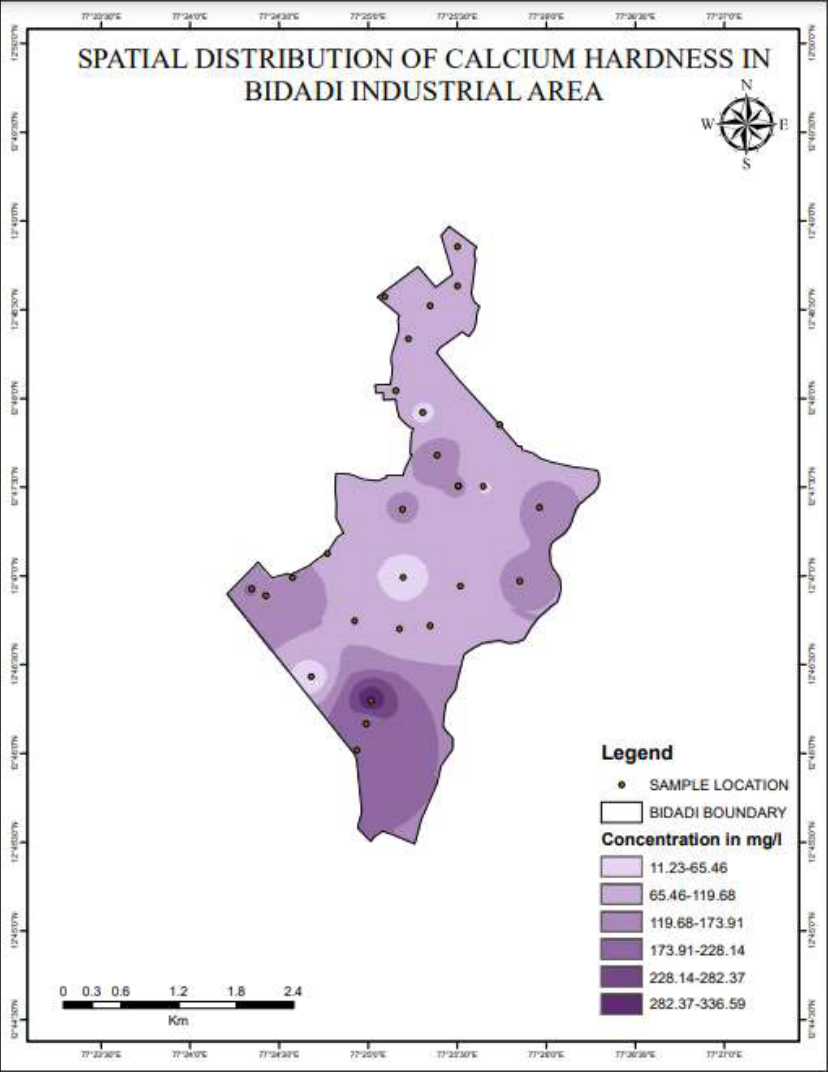 Figure 4
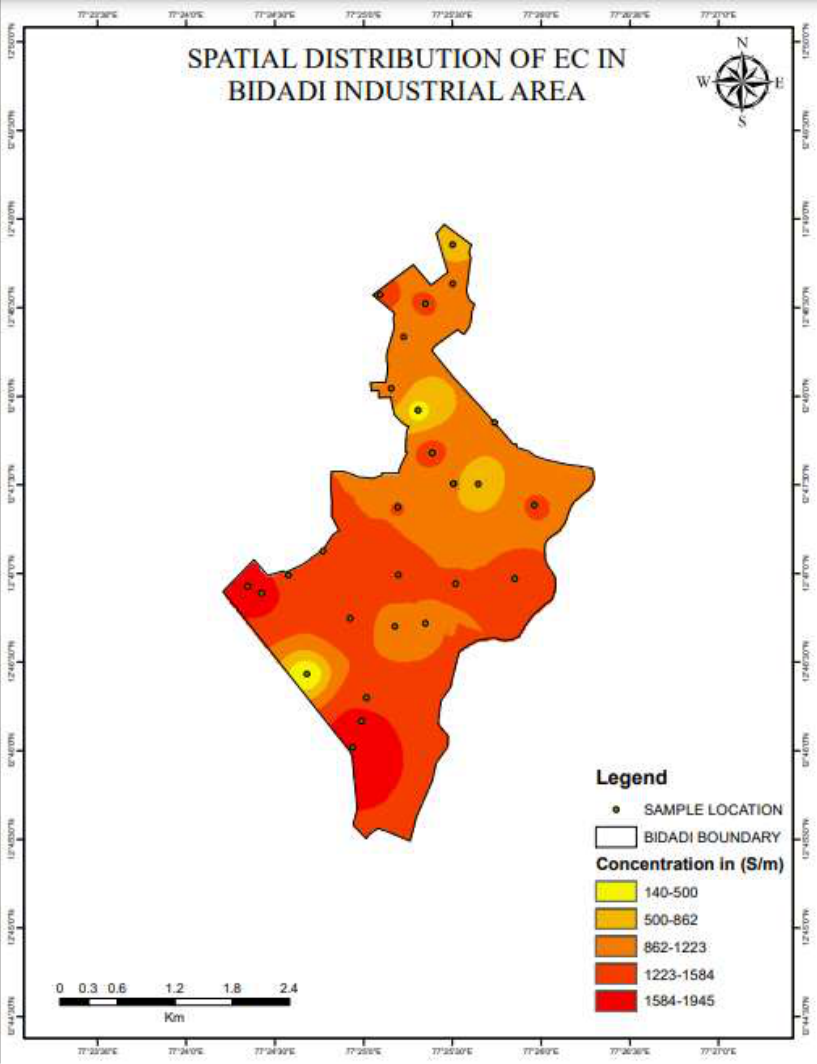 Figure 5
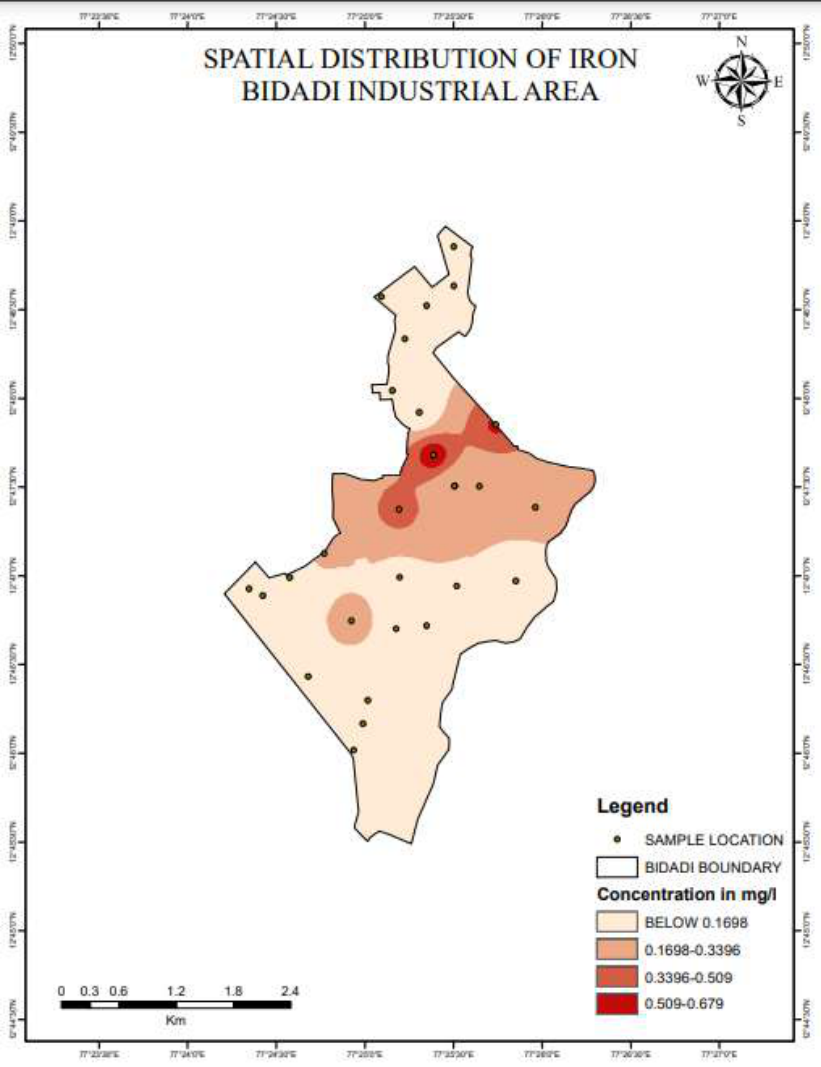 Figure 6
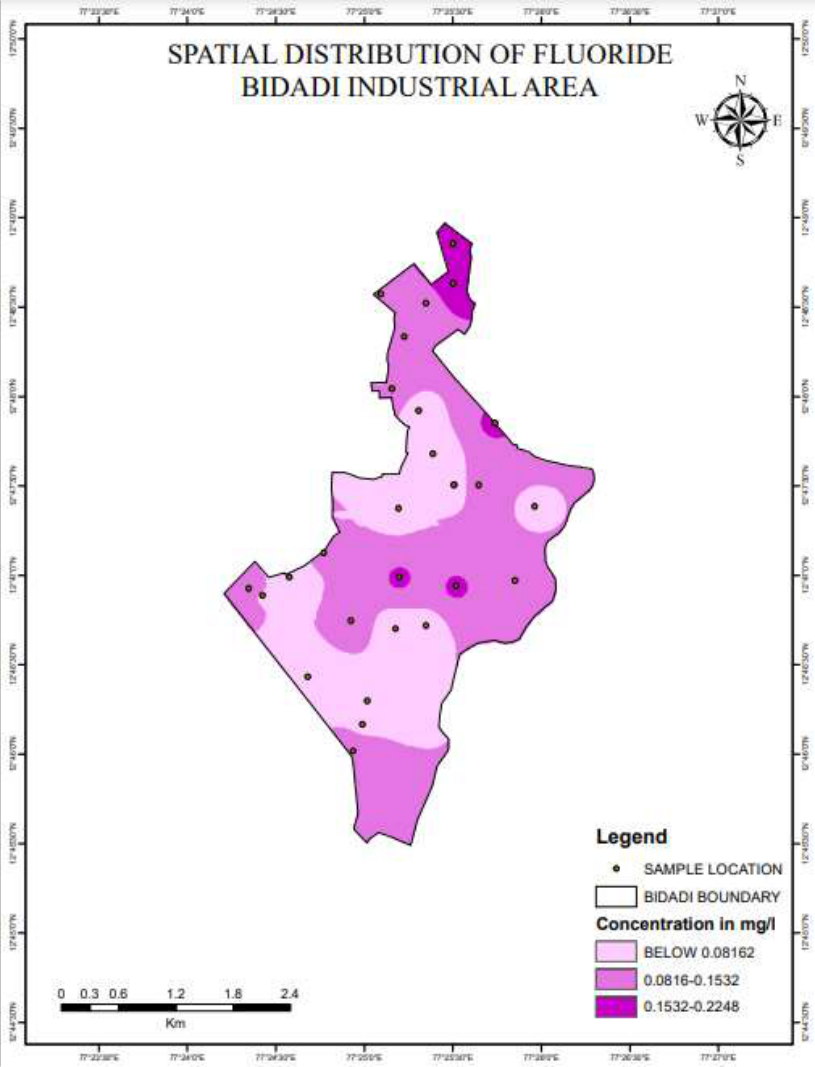 Figure 7
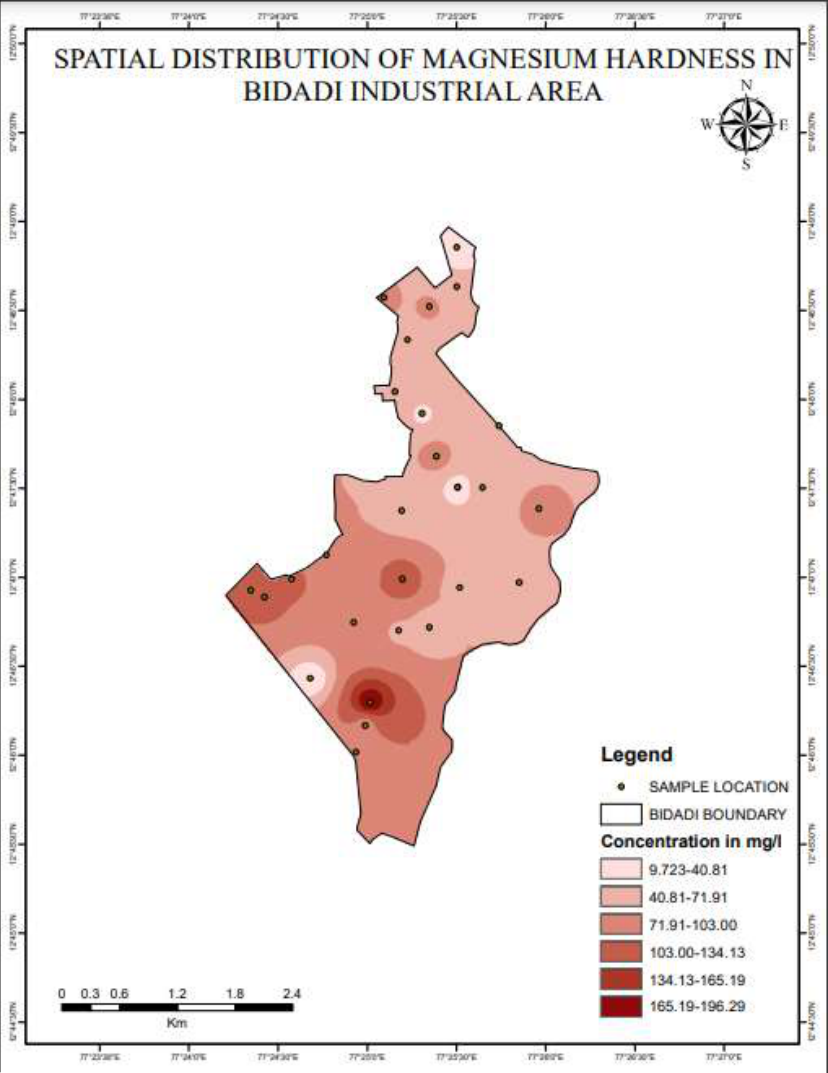 Figure 8
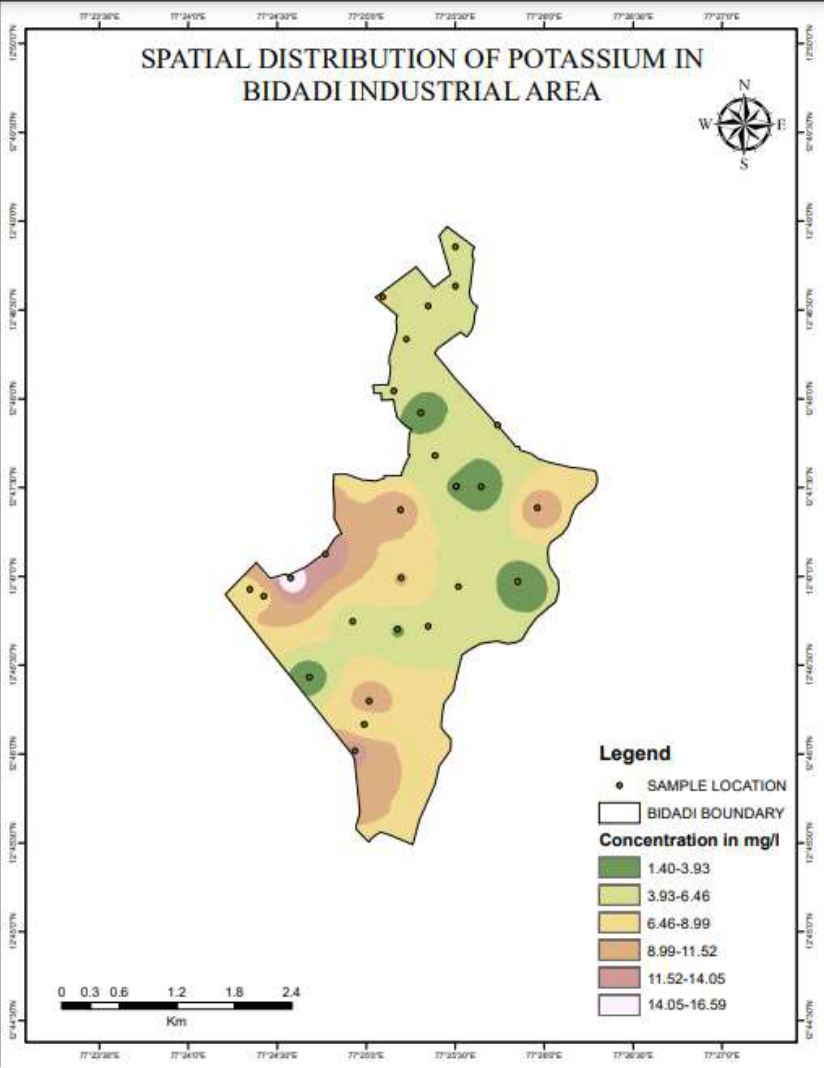 Figure 9
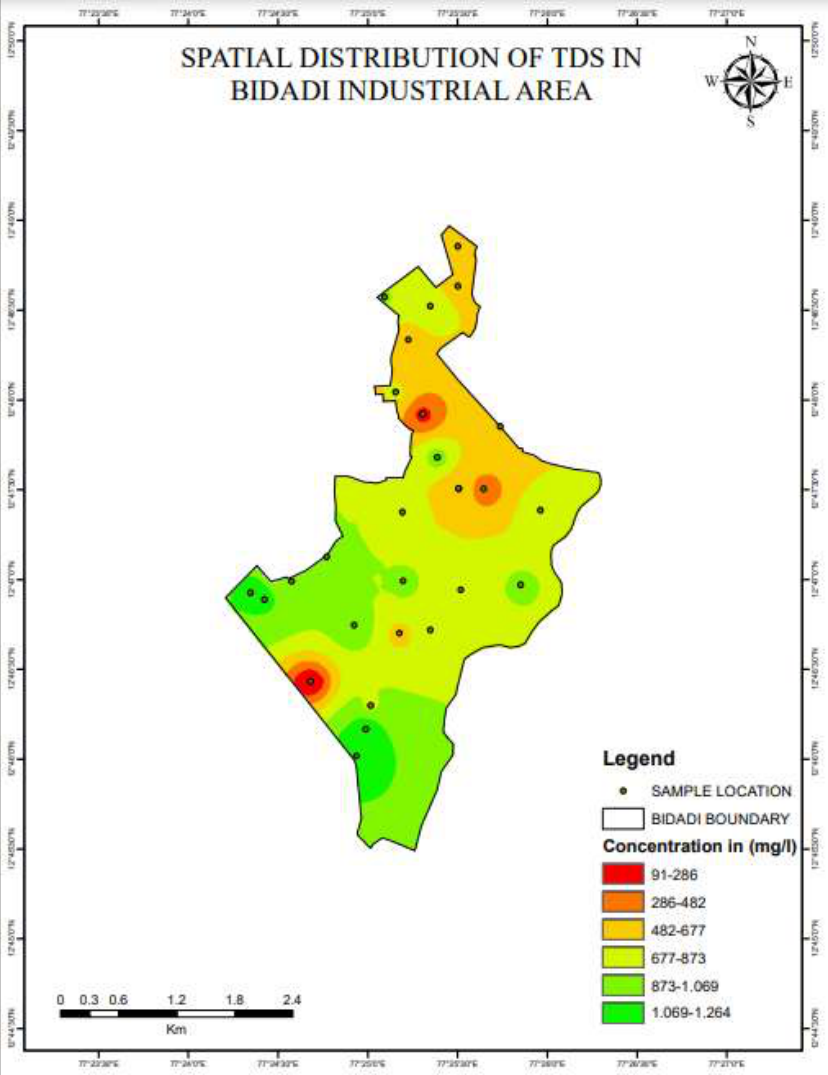 Figure 10
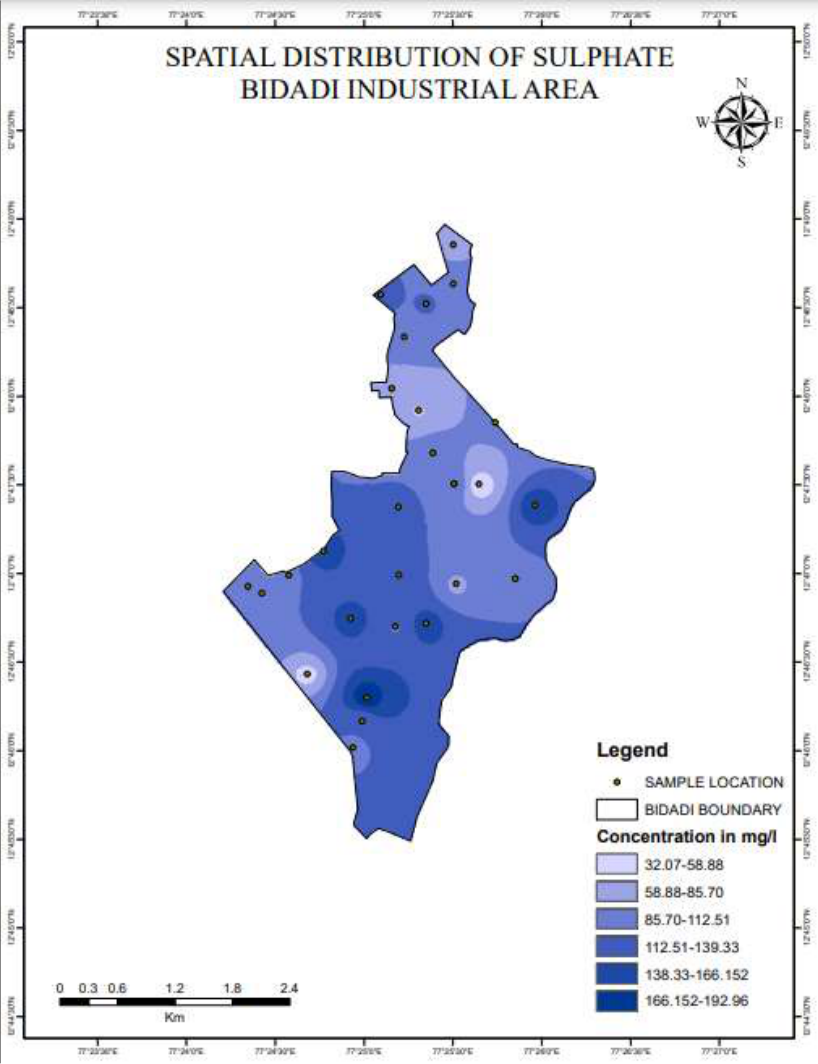 Figure 11
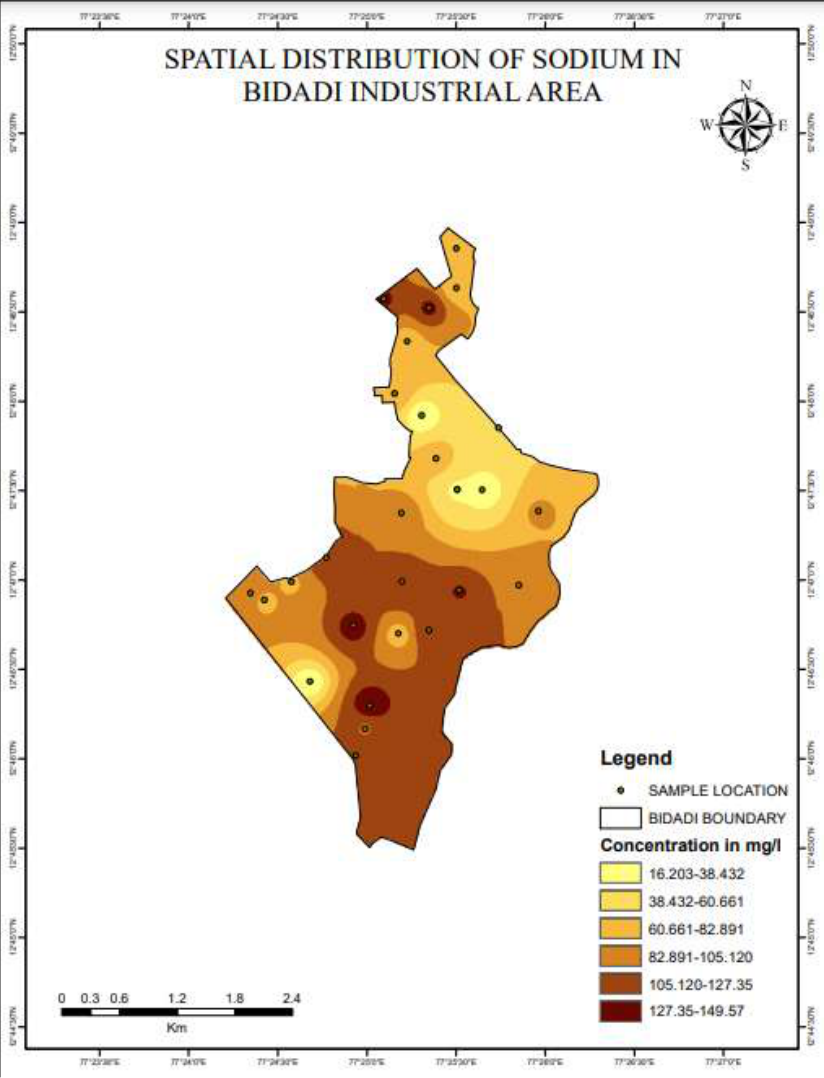 Figure 12
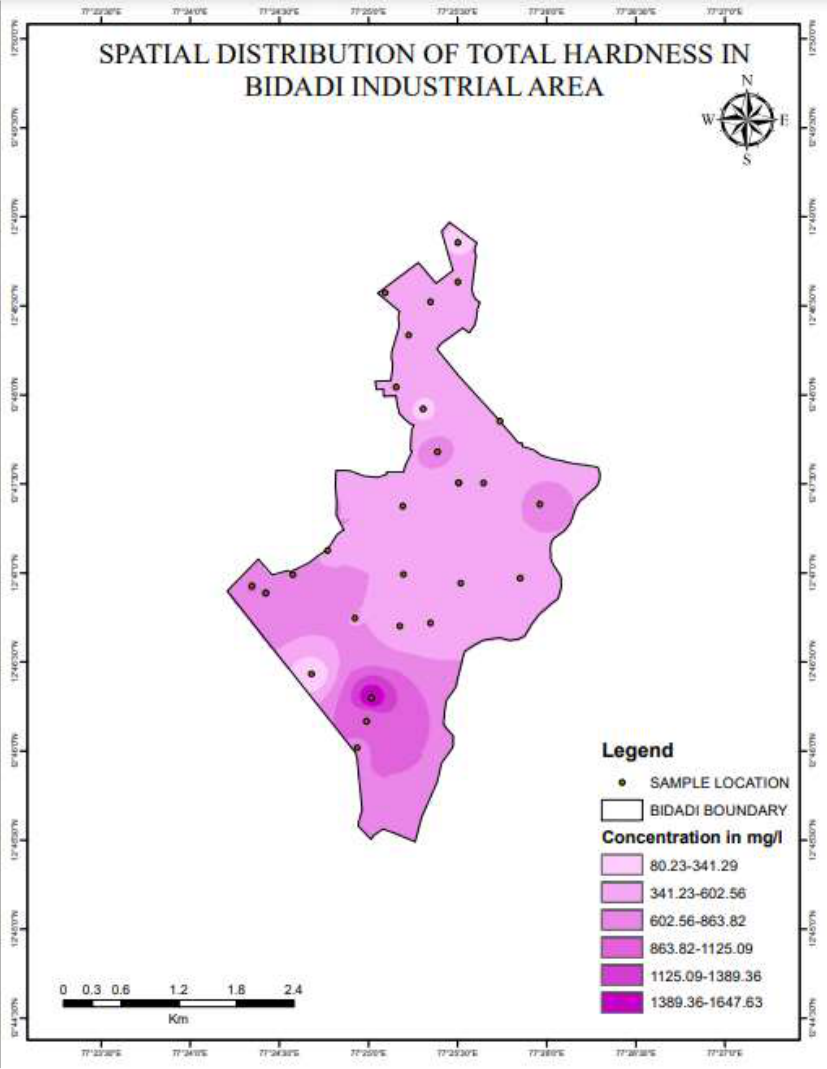 Figure 13
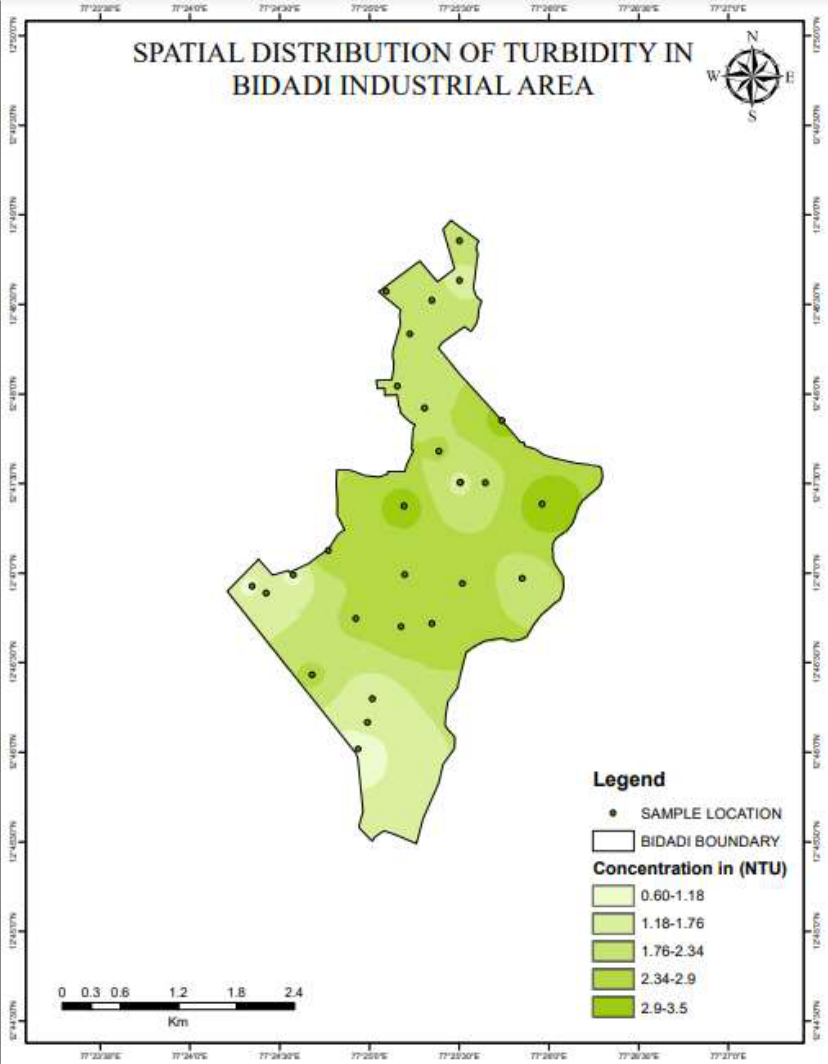 Figure 14
Introduction
Water is a basic requirement for the functioning of all life forms on earth. It is a well-known fact that presence of water makes Earth the only inhabitable planet. However, despite its vast quantity, water is very much limited. Additionally, while water is plentiful, it should be noted that not all of it is safe to consume. Groundwater is an essential source of water for humanity. Though it is beneath the Earth's surface, groundwater contributes significantly to the water cycle and accounts for 99% of the planet's liquid fresh water. The groundwater reservoir that feeds rivers, lakes, and wetlands when they are in need of water and removes some of their flow when there is a plenty of surface water present are all surface expressions of groundwater. Mining is one example of a human activity that has altered the natural, physical, and biological redistribution of heavy metals. These modifications have caused these metals to bio-accumulate in plants, animals, and finally in the human body. As a result, heavy metal-related pollution has negatively impacted human health [1] . The presence of heavy metals (Cd, As, Ni, and Hg) in groundwater at levels beyond the allowable limits can harm ecosystems, plants, and animals, as well as pose substantial health risks to people [2] . India, like many other countries, is experiencing a fresh water crisis, which is mostly caused by poor water management practises and environmental degradation, which restrict access to reliable water sources. Groundwater and surface water quality have both declined as a result of the fast rise of industrialisation and urbanisation [3] . Due to industrial waste, many states in the nation are in grave danger. Humans face a serious challenge with water quality because it directly affects their health [4] . To guarantee its ideal and long-term safe use, the groundwater quality study is necessary. There are many water quality principles depending on the type of water use. WQI is an effective method for evaluating the appropriateness and quality of drinking water in any setting. In addition, using the compositional and spatial characteristics of land cover, Multiple Linear Regression (MLR) models were used to predict the degree of water quality parameters. According to the awareness examination model, it was possible to plan borders that indicate substantially poorer water quality and significant spatial inconsistency. Rapid industrialization and urbanisation will contaminate groundwater either directly or indirectly. This study's primary goal is to determine the standards of groundwater for drinking purposes using Geographic Information System (GIS) and Remote Sensing (RS) approaches in combination with water quality indexing related to significant physio-chemical constraints of the groundwater from Bidadi Industrial Area.
Materials and Methods
Materials and Methods
Sample collection and analysis
The investigation of quality of ground water of Bidadi Industrial Area of Ramnagara district was undertaken in 2022. Sample Location names along with GPS data is shown in the following Table Water samples from the study area were collected for the physico-chemical analysis. Water sample locations were recorded using a GPS device. One-liter polythene cans were used to collect water samples, which were subsequently taken to the lab for physico-chemical examination. Then, they were examined for physical and chemical characteristics such as pH, electrical conductivity, total hardness, TDS, calcium, magnesium, sodium, potassium, iron, carbonates, sulphates, bicarbonates, nitrate, chloride, fluorides, etc. in accordance with BIS:10500-2015 requirements. Creating a spatial distribution map and calculating the WQI for each physicochemical parameter
Calculation of water quality index
Horton developed the WQI (Water Quality Index) [5] in the United States by selecting the 10 most commonly used water quality variables like pH, dissolved oxygen (DO), coliforms, chloride and chloride alkalinity etc. and has been widely accepted and used in European, African and Asian countries. WQI has been estimated in three steps utilizing weighed arithmetic index approaches [14] .
Parameter Selection: This is done at the discretion of professional experts, agencies or government institutions that is determined in the legislative area. It is recommended to select variables from five classes that have a large impact on water quality: oxygen content, eutrophication, health aspects, physical properties, and dissolved matter. Determination of Quality Function (curve) for Each Parameter Considered as the Sub -Index: Sub -indices are converted to non -dimensional scalar values from the variables of different units (ppm, saturation percentage, counts / volume etc.) Sub -Indices Aggregation with Mathematical Expression: Mathematical or geometric averages are frequently used to express this. Numerous indicators of water quality, including The National Sanitation Foundation Water Quality Index (NSFWQI), the Canadian Council of Ministers of the Environment Water Quality Index (CCMEWQI), the Oregon Water Quality Index (OWQI), and other national and international organisations have developed the Weight Arithmetic Water Quality Index (WAWQI), for example. These WQI have been used to assess the quality of the water in a particular area.
Additionally, these indices frequently base their calculations on different numbers and kinds of water quality measures in comparison to the corresponding requirements of a certain area. Water quality indicators are recognised for their capacity to precisely and promptly reflect annual cycles, regional and temporal variations in water quality, and fluctuations in water quality even at low concentrations. The available indices include several variances and restrictions based on the quantity of water, according to the examined literature.
It may be more appropriate to summarise the state of water quality across a variety of water types using the water quality index rather than a single parameter because it indicates the degree to which a number of water quality parameters vary from normal, expected, or "ideal" concentrations [7] . The Water Quality Index is an effective way to understand the properties of water. The pH of an aqueous solution is regulated by a series of related chemical reactions that either release or consume hydrogen ions (Hem 1985). No suggested pH safety recommendations exist. Despite the fact that pH values typically do not have a direct impact on users, they are one of the most important limitations on the quality of work water [8] . The pH level controls how acidic and alkaline freshwater is. Mainly tracked in groundwater are the quantity and chemical make-up of organic and inorganic molecules [9] . The pH ranges from 7 to 8.93 for samples of water. This demonstrates the water's mild basicity.
Alkalinity (Bi-carbonate)
Alkalinity is a measure of water's ability to resist changes in pH, also known as buffering. Maintaining a stable pH is critical for most applications.
Bicarbonates and carbonates create alkalinity in water. Carbonates and bicarbonates are estimated from alkalinity values [10] . Bicarbonate varies from 76 to 748 mg/l in the study area.
Chlorides (CL)
Salts such as NaCl (sodium), KCl (potassium) and CaCl2 (calcium) contain chlorides and are widely distributed in nature. Weathering cycles absorb chlorides from multiple rocks in the water and soil. Cation is the taste threshold for chloride anions in water, based on: Perception thresholds for sodium chloride and calcium chloride in water range from 200 to 300 mg/L [11] . Chloride is essential for monitoring groundwater contamination from sewage. At concentrations over 250 mg/l, water procures pungent taste which is frightful to many individuals. Department of Indian Standards recommends 250 mg/l as admissible cut off and 1000 mg/l as helpful breaking point without any substitute source. The chloride focus in the review region is under 250 mg/l, Hence acceptable.
Calcium Hardness
Water's calcium hardness is determined by the quantity of calcium ions in the water. Water with a significant mineral content is said to be "hard water." These minerals mostly consist of bicarbonates, chlorides, carbonates, and sulphates of calcium and magnesium. Typically, flooding and washing from limestone and chalk rocks dissolve minerals in water. Water hardness varies significantly from region to region even though there are strict standards for drinking water quality. High lime hardness drinking water has no recognised negative effects. Due to the fact that calcium and magnesium are crucial nutritional needs, hard water really has health benefits. Calcium also improves the taste of water. The WHO says that public acceptance of water hardness can vary greatly from region to region. They exhibit taste thresholds for calcium ions in the range of 100-300mg/L. They also specify that water with a hardness greater than about 200 mg/L can cause limescale, but these are guidelines only and do not set regulations or limits. Calcium hardness values range from 11.22 to 336.67 mg/l.
Electrical Conductivity (EC)
The amount of ionised substances in the water is related to its electrical conductivity, which shows the limit of electrical momentum that could pass through it. Many of the inorganic compounds that have broken down and are present in water have ionised structures and aid in electrical conduction. The electrical conductivity of water samples in the research area ranges from 140 to 1946 S/cm.
Iron
Iron is naturally present in rivers, lakes and groundwater. It can also be released into water from anthropological sources such as industrial waste and corroded iron pipes. Iron can exist in water in two forms: soluble iron (Fe 2+ ) or insoluble iron (Fe 3+ ). Iron in drinking water can come from corrosion of iron pipes. In addition, since natural water often contains a lot of iron, it is common to remove iron during treatment of drinking water. Iron is an essential organic component for all living organisms and is present in the hemoglobin skeleton. According to Haloi and Sharma [12] , Mn can promote iron bacteria in groundwater. High Iron fixation causes mild toxicity. The outcomes showed that the groupings of iron during the winter season falls within the permissible limits of the study area.
Magnesium Hardness
Magnesium ions are among the most essential minerals known to humans and are abundantly present in our surroundings. After Iron, Oxygen, and Silicon, Magnesium is the fourth most common element on Earth. At the cellular level, they are responsible for more than 300 enzymatic reactions that enable the human body to function. Magnesium in water is a completely normal phenomenon. Found in most rivers, streams and seas. Infection from one organism to another spreads unknowingly into the environment. As it passes from one organism to another, it's unknowingly spread across the environment. Potassium values range from 1.4 to 16.6 mg/l. However, [13] WHO does not establish health-based guideline values for K and P in drinking water.
Total Dissolved Solids (TDS)
Total Dissolved Solids is a measure of the total amount of impurities in drinking water. According to a common definition, "dissolved solids" must be less than 2 microns in order to flow through the filter. Total Suspended Solids are regarded as particles greater than 2 microns. The EPA classifies Total Dissolved Solids as a "secondary contaminant." Overall, people view them as more of a nuisance than a threat. However, some water contaminants that contribute to total dissolution can be harmful to your health in the long run if they are present in excess amounts. The water samples' mean TDS concentrations ranged from 91 to 1264.9 mg/l Hence no risk found in present situation of water. Iso-contour maps are prepared for all the quality parameter by using ARCGIS Software and spatial variation is analysed. The Bidadi industrial area presently growing day by day due to increase population and also industries near city and village. In order to keep a close eye on water quality and a healthy environment for people and the community, more trustworthy, effective, and quick monitoring measures must be implemented.
Figures and tables from the paper
| SL No. | Latitude | Longitude |
|---|---|---|
| 1 | 12.82113 | 77.4124 |
| 2 | 12.82192 | 77.41283 |
| 3 | 12.8087 | 77.42248 |
| 4 | 12.80954 | 77.41824 |
| 5 | 12.78316 | 77.41998 |
| 6 | 12.78542 | 77.41287 |
| 7 | 12.77908 | 77.41543 |
| 8 | 2.778645 | 77.422484 |
| 9 | 12.80556 | 77.42046 |
| 10 | 12.79867 | 77.4218 |
| 11 | 12.79465 | 77.42313 |
| 12 | 12.79172 | 77.42747 |
| 13 | 12.78235 | 77.42532 |
| 14 | 2.773841 | 77.411344 |
| 15 | 12.77834 | 77.41964 |
| 16 | 12.77161 | 77.41694 |
| 17 | 12.79753 | 77.42897 |
| 18 | 12.81426 | 77.42505 |
| 19 | 12.81056 | 77.42505 |
| 20 | 12.80072 | 77.41927 |
| 21 | 12.79176 | 77.42514 |
| 22 | 12.79176 | 77.42512 |
| 23 | 12.78285 | 77.43086 |
| 24 | 12.78314 | 77.40961 |
| 25 | 12.78148 | 77.40709 |
| 26 | 12.78209 | 77.4058 |
| 27 | 12.76694 | 77.41563 |
| 28 | 12.76943 | 77.41649 |
Table text extracted from the original PDF; superscript letters are shown inline. The original table image is below.
View original table image
| Parameter | Method / instrument |
|---|---|
| pH | Digital pH meter |
| Alkalinity | Titrimetry |
| Electrical conductivity (EC) | Digital conductivity meter |
| Total Dissolved Solids (TDS) | Indirect method 0.64x ECµZ l cm |
| Calcium Hardness and Total hardness (TH) | EDTA-Titrimetry |
| Magnesium hardness (MgH) | Indirect method (TH - (2.5x CaH)!4.1 |
| Sodium (Na) & Potassium (K) | Flame photometer |
| Iron (Fe) | 1,10 phenanthro line-Spectrophotometry |
| Bicarbonates (HC03) + carbonates (C03) | Indirect method 1.31x Alkalinity |
| Chlorides (Cl) | Mobr's-Titrilnetry |
| Sulphates (S04) | Spectrophotometry |
| Phosphates (P04) | Ammonium molybdate method-Spectrophotometry |
| Fluorides (F) | Selective ion meter |
Table text extracted from the original PDF; superscript letters are shown inline. The original table image is below.
View original table image
| Water Quality Index Level | Water Quality Status |
|---|---|
| <50 | Excellent |
| 50-100 | Good Water |
| 100-200 | Poor Quality |
| 200-300 | Very poor |
| >300 | Water unsuitable for drinking |
Table text extracted from the original PDF; superscript letters are shown inline. The original table image is below.
View original table image
| Parameter | Mean of 46 samples | Standard | Samples under acceptable limit | Samples outside permissible limit | % of samples under permissible limit |
|---|---|---|---|---|---|
| pH | 7.65 | 6.5-8.5 | 27 | 1 | 96.43% |
| EC(µ/cm) | 1189 | 1000-2000 (µ/cm) | 28 | 0 | 100% |
| TDS (ppm) | 773 | 500-2000 ppm | 28 | 0 | 100% |
| Chloride | 162.5 | 250-1000 mg/l | 28 | 0 | 100% |
| Total Hardness | 592.4286 | 200-600 mg/l | 20 | 8 | 71.43% |
| Iron | 0.12 | 1 mg/l | 28 | 0 | 100% |
| Magnesium | 72.38 | 30-100 mg/l | 23 | 5 | 82.14% |
| Bi – carbonate | 480.4286 | 200-600 mg/l | 20 | 8 | 71.43% |
| Potassium | 6.7 | 1-5 mg/l | 12 | 16 | 42.86% |
| Fluoride | 0.09 | 1-1.5 mg/l | 28 | 0 | 100% |
| Calcium | 118.06 | 75-200 mg/l | 26 | 2 | 92.86% |
| Sodium | 87.2 | 1-60 mg/l | 5 | 23 | 17.86% |
| Nitrate | 8.1 | 45 mg/l | 28 | 0 | 100% |
| Sulphate | 107.1786 | 200-400 mg/l | 28 | 0 | 100% |
| Turbidity | 2.1464 | 1-5 | 28 | 0 | 100% |
Table text extracted from the original PDF; superscript letters are shown inline. The original table image is below.
View original table image
| pH | Turbidity (NTU) | EC (μs) | TDS (mg/l) | HCO3- (mg/l) | Cl (mg/l) | TH (mg/l) | Ca2- (mg/l) | Mg2- (mg/l) | Na (mg/l) | K (mg/l) | F- (mg/l) | SO2- (mg/l) | NO3- (mg/l) | Fe (mg/l) |
|---|---|---|---|---|---|---|---|---|---|---|---|---|---|---|
| 8.06 | 3.4 | 1235 | 803 | 180 | 152 | 568 | 128.26 | 60.26 | 104.8 | 11.6 | 0.050 | 139 | 12.5 | 0.42 |
| 7.53 | 3.5 | 1270 | 826 | 468 | 216 | 692 | 136.27 | 85.54 | 87.2 | 11.2 | 0.068 | 160 | 3.5 | 0.20 |
| 7.63 | 2.2 | 1323 | 860 | 744 | 96 | 572 | 101.00 | 77.76 | 134.4 | 6.2 | 0.113 | 117 | 8.5 | 0.00 |
| 7.53 | 2.3 | 1370 | 891 | 620 | 172 | 552 | 91.38 | 78.73 | 132.0 | 6.6 | 0.113 | 130 | 2.5 | 0.00 |
| 7.00 | 2.4 | 1428 | 928 | 672 | 156 | 588 | 11.22 | 136.08 | 127.2 | 9.2 | 0.170 | 129 | 7.0 | 0.10 |
| 7.00 | 2.9 | 1460 | 949 | 588 | 190 | 552 | 101.00 | 72.90 | 122.4 | 13.8 | 0.095 | 154 | 8.0 | 0.20 |
| 7.45 | 2.5 | 1570 | 1021 | 704 | 206 | 600 | 112.22 | 77.76 | 140.0 | 4.6 | 0.130 | 152 | 13.5 | 0.28 |
| 7.68 | 2.8 | 1208 | 785 | 420 | 156 | 468 | 104.21 | 50.54 | 124.8 | 6.0 | 0.053 | 154 | 13.5 | 0.00 |
| 7.81 | 2.1 | 900 | 585 | 476 | 46 | 496 | 91.38 | 65.12 | 68.8 | 5.0 | 0.108 | 97 | 13.0 | 0.00 |
| 8.93 | 2.3 | 353 | 229 | 160 | 10 | 280 | 52.91 | 35.96 | 17.0 | 2.8 | 0.043 | 57 | 7.0 | 0.00 |
| 7.25 | 2.4 | 1490 | 969 | 280 | 336 | 760 | 152.30 | 92.34 | 79.2 | 4.4 | 0.033 | 99 | 8.0 | 0.68 |
| 7.00 | 2.3 | 509 | 331 | 120 | 88 | 356 | 56.11 | 52.49 | 17.4 | 1.8 | 0.113 | 32 | 3.5 | 0.18 |
| 7.81 | 2.6 | 1247 | 811 | 708 | 102 | 496 | 91.38 | 65.12 | 129.6 | 6.0 | 0.168 | 80 | 7.0 | 0.16 |
| 7.63 | 2.5 | 140 | 91 | 76 | 6 | 80 | 16.03 | 9.72 | 16.2 | 1.4 | 0.010 | 48 | 5.0 | 0.12 |
| 8.22 | 2.7 | 936 | 608 | 392 | 104 | 472 | 76.95 | 68.04 | 68.8 | 3.6 | 0.030 | 111 | 11.5 | 0.10 |
| 7.53 | 1.3 | 1304 | 848 | 436 | 182 | 1648 | 336.67 | 196.34 | 149.6 | 11.0 | 0.055 | 193 | 2.0 | 0.00 |
| 7.00 | 3.2 | 924 | 601 | 460 | 136 | 492 | 113.83 | 50.54 | 60.6 | 4.6 | 0.180 | 89 | 12.0 | 0.54 |
| 7.80 | 2.3 | 776 | 504 | 672 | 56 | 308 | 78.56 | 27.22 | 68.4 | 5.8 | 0.218 | 77 | 10.0 | 0.00 |
| 8.25 | 1.4 | 876 | 569 | 368 | 136 | 400 | 92.99 | 40.82 | 65.4 | 4.2 | 0.225 | 93 | 2.0 | 0.00 |
| 7.80 | 2.1 | 1085 | 705 | 472 | 176 | 500 | 96.19 | 63.18 | 82.4 | 4.8 | 0.145 | 70 | 10.5 | 0.00 |
| 7.00 | 1.2 | 871 | 566 | 388 | 116 | 464 | 141.08 | 27.22 | 34.8 | 4.2 | 0.050 | 97 | 1.5 | 0.00 |
| 7.00 | 2 | 868 | 564 | 368 | 136 | 420 | 107.41 | 36.94 | 36.4 | 3.4 | 0.085 | 100 | 11.0 | 0.40 |
| 7.96 | 2 | 1410 | 917 | 572 | 176 | 560 | 134.67 | 54.43 | 104.0 | 2.2 | 0.100 | 107 | 9.0 | 0.00 |
| 7.93 | 1 | 1541 | 1002 | 748 | 216 | 824 | 145.89 | 111.78 | 79.2 | 16.6 | 0.028 | 107 | 12.0 | 0.00 |
| 7.75 | 1.7 | 1688 | 1097 | 684 | 256 | 868 | 157.11 | 115.67 | 77.6 | 8.6 | 0.075 | 92 | 9.0 | 0.00 |
| 7.85 | 1 | 1715 | 1115 | 576 | 276 | 868 | 177.96 | 103.03 | 97.6 | 8.4 | 0.130 | 94 | 7.0 | 0.08 |
| 7.64 | 0.6 | 1946 | 1265 | 532 | 376 | 844 | 208.42 | 78.73 | 113.6 | 12.8 | 0.125 | 103 | 7.5 | 0.00 |
| 8.23 | 1.4 | 1849 | 1202 | 568 | 276 | 860 | 192.38 | 92.34 | 103.2 | 6.4 | 0.070 | 120 | 10.5 | 0.00 |
Table text extracted from the original PDF; superscript letters are shown inline. The original table image is below.
View original table image
| Parameter | Maximum value | Minimum value | Mean | Standard deviation |
|---|---|---|---|---|
| pH | 8.93 | 7 | 7.65 | 0.4712 |
| Turbidity | 3.5 | 0.6 | 2.15 | 0.7033 |
| EC | 1946 | 140 | 1189 | 443.35 |
| TDS | 1264.9 | 91 | 773 | 288.18 |
| Alkalinity | 748 | 76 | 480.43 | 185.79 |
| Cl | 376 | 6 | 162.5 | 90.61 |
| TH | 1648 | 80 | 592.43 | 287.22 |
| Ca | 336.67 | 11.22 | 118.06 | 64.15 |
| Mg | 196.34 | 9.72 | 72.38 | 38.41 |
| Na | 149.6 | 16.2 | 87.2 | 39.67 |
| K | 16.6 | 1.4 | 6.7 | 3.82 |
| SO₄ | 0.23 | 0.01 | 0.099 | 0.057 |
| NO₃ | 193 | 32 | 107.18 | 36.04 |
| F | 13.5 | 1.5 | 8.1 | 3.69 |
| Fe | 0.68 | 0 | 0.12 | 0.18 |
Table text extracted from the original PDF; superscript letters are shown inline. The original table image is below.
View original table image
References
8 in the original paper- Rattan RK, Datta SP, Chandra S. Heavy metals and environmental quality-Indian scenario. Fertiliser News. 2002;47(11):21-26.
- Bhagure GR, Mirgane SR. Heavy metal concentrations in groundwater and soils of Thane region of Maharashtra, India. Environmental Monitoring and Assessment. 2011;173(1-4):643-652.
- Srinivas CH, Piska RS, Venkateshwar C, Rao MSS, Reddy RR. Studies on ground water quality of Hyderabad. Pollution Research. 2000;19(2):285-289.
- Balakrishnan P. Groundwater quality mapping using geographic information system (GIS): A case study of Gulbarga City, Karnataka, India. African Journal of Environmental Science and Technology. 2012;5(12):1069-1084.
- Horton RK. An index number system for rating water quality. Journal of the Water Pollution Control Federation. 1965;37(3):300-306.
- Ortyom YG. Water pollution: A menace to aquatic ecodiversity and human health: A review. International Journal of Agriculture and Food Science. 2021;3(2):4753.
- Sadat-Noori SM, Ebrahimi K, Liaghat AM. Groundwater quality assessment using the Water Quality Index and GIS in Saveh Nobaran aquifer. Iran Environ Earth Sci. 2014;71:3827-3843.
- Ramakrishnaiah CR, Sadashivaiah C, Ranganna G. Assessment of Water Quality Index for the groundwater in Tumkur Taluk, Karnataka State, India. E-Journal of Chemistry. 2009;6(2):523-530.