
Research article · 2023 · Full text
International Journal of Veterinary Sciences and Animal HusbandryOxygen Saturation (SpO2) measurement to predict blood profile in sheep to help diagnose anemia caused by haemonchosis
Volume 8(3) · Pages 157–162 · DOI: 10.22271/veterinary.2023.v8.i3c.536 ↗
Research areasHelminth infection and control
Abstract
Author-writtenHaemonchus contortus infection (haemonchosis) often occurs in sheep and cause chronic blood losses. These worms causing symptoms of anemia that can continue in hypoproteinemia or even death. Therefore, early recognition of anemic conditions due to haemonchosis becomes very important. Rapid and accurate detection of the incidence of anemia will help in the determination of appropriate therapy. The purpose of this study was to detect anemia in sheep with easy, fast, and non-invasive way through the SpO2 examination. A total of 20 sheep were divided into 2 groups, control and the treatment group. Treatment group were sheep with artificial anemia that used as a model for haemonchosis anemia. The results showed that the normal levels of sheep SpO2 were 90.30±6.98% – 92.80±5.37% which described the number of RBC were 9.78±1.98x10⁶/µl– 10.44±1.52106/µl, Hb 8.42±1.07 g/dl – 9.14±1.03 g/dl and HCT 26.79±3.27% – 29.37±2.94%. When sheep were anemic, SpO2 values dropped to 81.40±4.09% reflecting RBC levels of 8.18±2.14x10⁶/µl, Hb 6.98±1.28 g/dl and HCT 21.82±3.93%. The strongest relationship of SpO2 with Hb levels in the equation y=0.1334x-3.856 with a correlation of 85.8%. The coefficient of determination of the equation is 0.74 so that the SpO2 value can guess the condition of anemia through the approximate hemoglobin value. From these results shows that SpO2 can be used as an estimator of anemic conditions in sheep. The SPO2 examination needs to be combined with the results of the EPG examination to confirm whether the anemia that occurs was caused by haemonchosis or due to other causes.
Summary
Source-checkedPlain-language reading of the full paper, prepared with AI and checked against the text. Each point links to the authors' own words.
Why it matters
- Haemonchosis, caused by Haemonchus contortus, leads to chronic blood loss in sheep, which can result in anemia, hypoproteinemia, or death. View evidence ↗
- Standard anemia detection requires laboratory blood tests, which are considered inefficient due to the associated costs and need for professional staff. View evidence ↗
- Peripheral oxygen saturation (SpO2) is a non-invasive and easy-to-measure parameter for assessing tissue oxygenation levels. View evidence ↗
The question
- The study aimed to determine if SpO2 examination could provide an easy, fast, and non-invasive method for detecting anemia in sheep. View evidence ↗
What they did
- The study used 20 male sheep, divided into a control group and an anemia group. View evidence ↗
- Artificial acute anemia was induced via jugular vein phlebotomy, removing 108 mL of blood per day for three consecutive days, totaling 324 mL. View evidence ↗
- The researchers measured SpO2, red blood cell (RBC) counts, hemoglobin (Hb) levels, and hematocrit (HCT) values. View evidence ↗
- SpO2 measurements were taken by placing the pulse oximeter sensor on the medial part of the sheep's ears. View evidence ↗
What they found
- SpO2 showed a linear correlation with Hb levels (y=0.1334x - 3.8555) with a coefficient of determination of 0.74, suggesting SpO2 can estimate hemoglobin levels. View evidence ↗
- A linear relationship was found between SpO2 and RBC counts (y=0.2176x - 9.7244) with a coefficient of determination of 0.63. View evidence ↗
- SpO2 and HCT values exhibited a linear pattern (y = 0.4085x - 11.132) with a coefficient of determination of 0.67. View evidence ↗
- Following blood loss, the conjunctival mucosa of the eyes became noticeably pale pink, and the gum mucosa also became paler. View evidence ↗
What it means
- The authors conclude that SpO2 measurements can be used to predict the occurrence of anemia in sheep. View evidence ↗
- To confirm that anemia is specifically caused by haemonchosis, SpO2 results should be combined with eggs per gram (EPG) fecal examinations. View evidence ↗
Visual summary
2 visualsIllustrations explain the paper; charts are replotted from the paper's own table values.
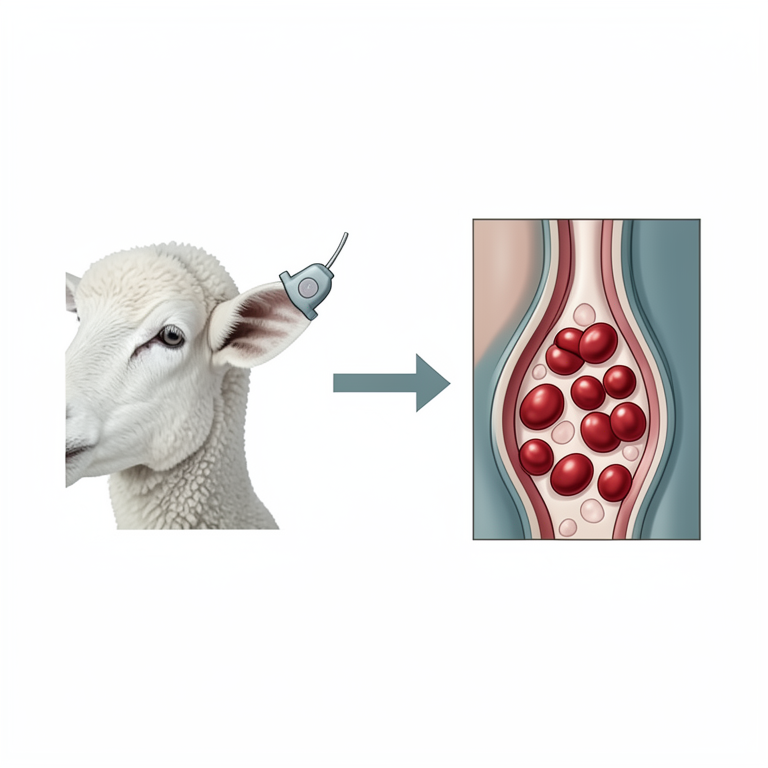
SpO2 as a Proxy for Hemoglobin
AI-generated conceptual illustration (sheep ears and blood vessels). It explains the idea and does not show study data.
View source evidence ↗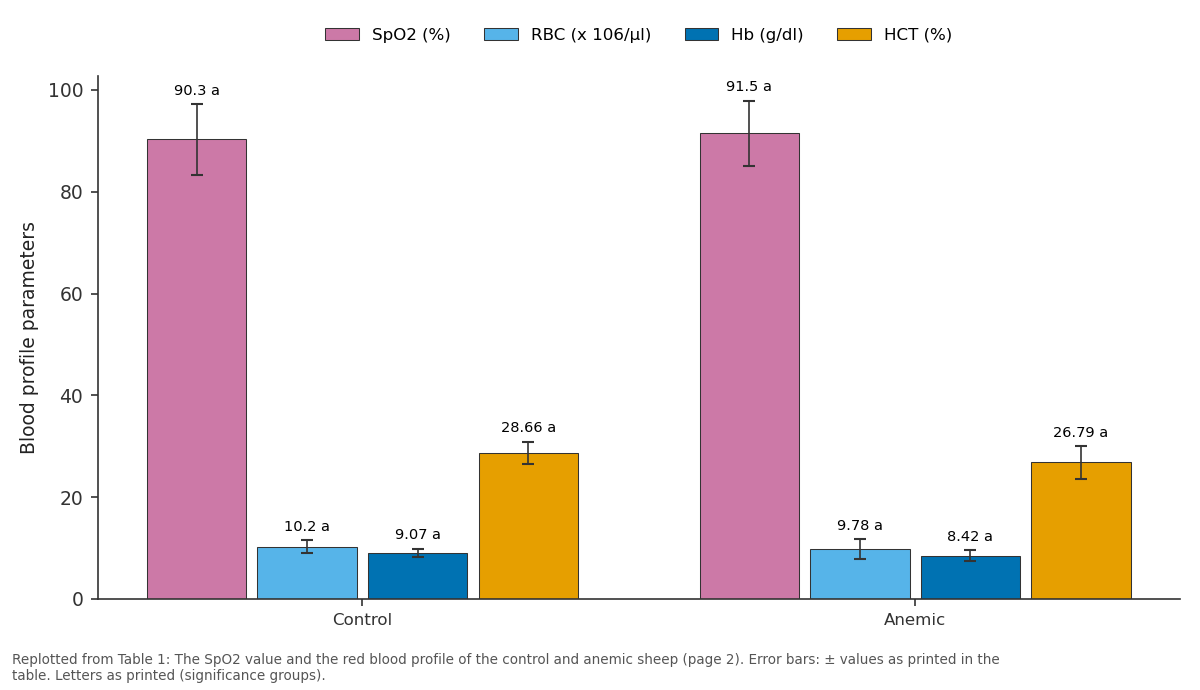
SpO2 (%) and RBC (x 106/µl) and more: Control vs Anemic
Replotted from Table 1 (page 2) of the original paper. Every bar is the paper's own table value.
View source evidence ↗Figures & tables
From the original paper Table 1
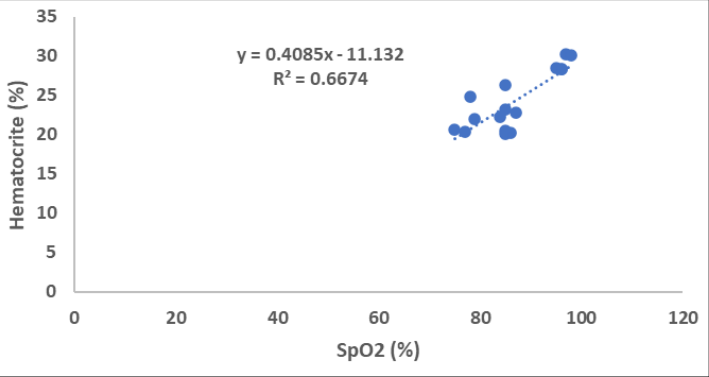 Figure 3
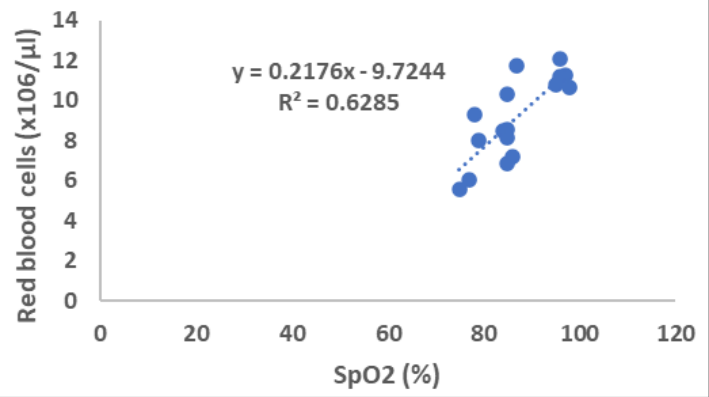 Figure 2
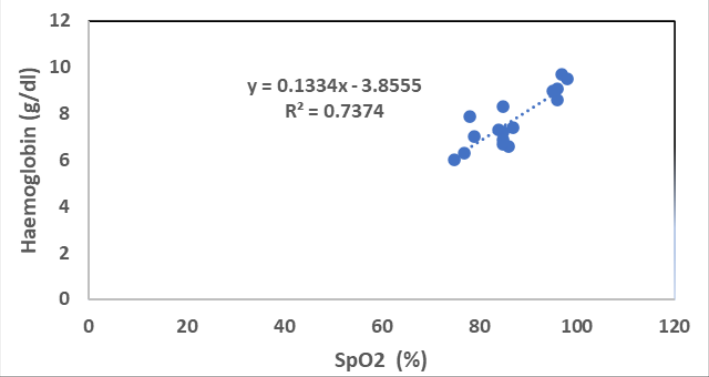 Figure 1
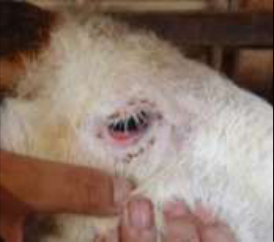 Figure 4
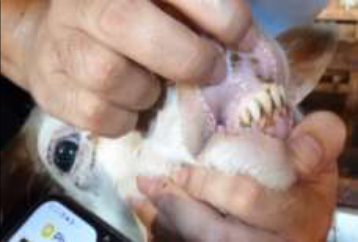 Figure 4
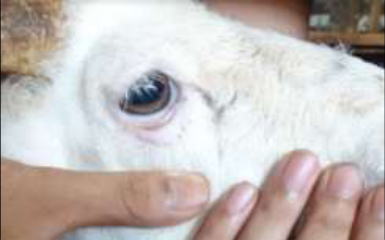 Figure 5
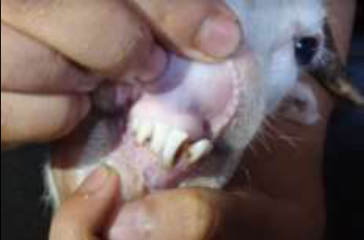 Figure 5
Introduction
Anemia is a condition in which the body lacks red blood cells or described as a reduction in the proportion of the red blood cells (Turner et al., 2022) [19] . Anemia can result in decreased physiological function of the body. Clinical symptoms has been seen when animals experience anemia like tachycardia, tachypnea, icterus and mucosal pallor (Katsogiannou et al., 2018) [11] . Anemia can appear acutely or chronically and divided into regenerative and nonregenerative forms with their specific characteristics (Johns and Heller, 2021) [10] . The causes of anemia in sheep can vary. One of them is by the infection of the blood-sucking nematode worm Haemonchus controtus. This worm can suck as much blood as 0.03 ml/worm/day (Naeem and Iqbal, 2021) [13] . Haemonchosis is more common chronically so that the anemia condition experienced by sheep has also been going on for a long time. Therefore, the losses suffered by sheep owners are also not realized. Haemonchosis presents many challenges including fact that infection exists throughout the world, both tropical and subtropic, the presence of strains that are to be resistant to anthelmintic, the difficulty of early diagnosis, and not easy of controlling this disease (Arsenopoulos et al., 2021) [3] . Detection of anemia is usually done by taking a blood sample and then doing a blood test in the laboratory. This technique is considered less efficient because it requires costs and professional staff to do. The development of science related to sensors for acquisition of body physiological data opens up the opportunity to make devices that can predict the anemia status of sheep without taking blood. One of the body's physiological variables that can be examined without being invasive is the peripheral oxygen saturation value (SpO 2 ).
Oxygen saturation values have been widely used to determine changes in dissolved oxygen in blood vessels. The peripheral oxygen saturation value (SpO2) is the easiest to check among other parameters such as arterial oxygen pressure (PaO2) and arterial oxygen saturation (SaO2) in assessing tissue oxygenation levels (Röttgering et al., 2021) [15] . Oxygen saturation values are usually checked using an oximeter device although the results are not as good as those of examinations using near-infrared spectroscopy (NIRS) (Cheung et al., 2022) [6] . The oxygen saturation value is checked using an pulse oximetry and then the results are presented in percentage form. The oximeter sensor works in a way to detect the oxygen in the blood so this value describes the amount of oxygenated haemoglobin (ALhyari et al., 2018) [2] . In addition, the oxygen saturation value is reported to have a relationship with the diagnosis anemia because of the changing of tissue deoxygenation rate (Meznar et al., 2009) [12] . In humans, oxygen saturation checks have been common, even in fetuses (Saini et al., 2020) [16] . The value of oxygen saturation has a relationship with blood hemoglobin levels although there needs to be a correction value (Suherlim et al., 2018) [18] . In animals, the estimation of anemia by examining oxygen saturation has never been done. Therefore, this research is needed to determine the relationship between the changes in oxygen saturation values to the incidence of anemia in sheep.
Materials and Methods
Materials and Methods
Animal
The animals used in this study were 20 sheep which were divided into 2 groups, namely control and anemia group. The control group was sheep that did not experience anemia. The anemia group was sheep experiencing anemia. The sheep used were male and have an average weight of 16-19 kg. Sheep are kept in a colony pen owned by Mitra Tani Farm located in Tegalwaru Village, Ciampea District, Bogor Regency, Indonesia. Feed is given 3 times a day in the form of forage and concentrate and drink is given ad libitum.
Artificial anemia method
The treated sheep were artificially anemic sheep. The implementation method for making sheep become anemic has received ethical approval from the Animal Ethics Committee of the School of Veterinary Medicine and Biomedical Sciences with number 007/KEH/SKE/VI/2022. Sheep that were made to experience anemia described acute anemia with a total blood loss of 324 mL. The total blood volume is in accordance with the recommendations of the Institutional Animal Care and Use Committee (IACUC) which states that the maximum non-hazardous total blood volume is less than 33% of the total blood volume. The process of bleeding/ plebotomy was carried out through the jugular vein and carried out for three consecutive days with each volume of 108 mL per day.
Research variables and data analysis
The variables examined in this study included oxygen saturation values (SpO 2 ), Red Blood Cell counts (RBC), Hemoglobin levels (Hb), and Hematocrite values (HCT). In addition, documentation was also carried out on the conjunctival mucosa of the eye and gum mucosa. Examination of the blood sample was carried out on day 0 or before treatment and on day 3 or after treatment of anemia phlebotomy in sheep. The data obtained were analyzed using ANOVA. In addition, a correlation analysis and coefficient of determination was carried out between the SpO 2 value and RBC, Hb, and HCT. Data in the form of photos of the conjunctiva and gum mucosa were compared and analyzed descriptively.
Results
The sheep in the control and the anemic group had almost the same blood profile and SpO 2 values on day 0. The SpO 2 , RBC, Hb, and HCT values showed no significant difference. The results of measuring the SpO 2 and the red blood profile of the experimental sheep are presented in Table 1. On the day 0 or before the phlebotomy, there were no significant differences that showed the conditions of the experimental sheep had the same status. On day 0 in the control and anemic group had SpO 2 values of 90.30±6.98 and 91.50±6.42 respectively. The SpO 2 values were followed by RBC, Hb, and HCT values from the control group respectively 10.20±1.26, 9.07±0.77, and 28.66±2.25. The value did not differ markedly in the treatment group before experiencing anemia, namely 9.78±1.98a, 8.42±1.07a, and 26.79±3.27. The value of these parameters is still included in the normal range of the sheep's blood profile. The normal sheep has erythrocytes, haemoglobin, and hematocrit respectively 10.60±1.01, 9.10±0.70, and 26.00±2.00 (Astuti and Sudarman, 2015) [4]. On day 3 of sampling, the control group had a stable value for the blood profile. The SpO 2 values were 92.80±5.37 followed by RBC, Hb, and HCT values were 10.44±1.52, 9.14±1.03, and 29.37±2.40, respectively. On the other hand, in the group of sheep that had been made anemic, there was a significant decrease in all blood variables examined. The SpO 2 value of anemic sheep was 81.40±4.09. This value was followed by a decrease in RBC, Hb, and HCT values, there were 8.18±2.14, 6.98±1.28, and 21.82±3.93, respectively. Furthermore, the analysis on the scatter plot of the relationship between SpO 2 and Hb levels is presented in Figure 1. Furthermore, the relationship between SpO 2 and HCT value is also seen to have a linear pattern with the equation y = 0.4085x -11.132 with the value of the coefficient of determination is 0.67. Although not as strong as the relationship with hemoglobin and red blood cell count, the hematocrite value can be sufficiently estimated levels by looking at the SpO 2 value. The results of the examination of SpO 2 level and their blood profile give a clinical appearance in line. The condition of the experimental sheep before the blood draw was seen to have a mucosal color that looked bright red. This condition is a normal condition before the sheep has anemia. The condition of the normal mucosal color of the conjunctiva and the normal gum mucosa look slightly different. The conjunctival color of the eye normally looks redder than the color of the gums as shown in Figure 4.
| Group | Day | SpO2 (%) | RBC (x 106/µl) | Hb (g/dl) | HCT (%) |
|---|---|---|---|---|---|
| Control | 0 | 90.30±6.98a | 10.20±1.26a | 9.07±0.77a | 28.66±2.25a |
| 3 | 92.80±5.37a | 10.44±1.52a | 9.14±1.03a | 29.37±2.94a | |
| Anemic | 0 | 91.50±6.42a | 9.78±1.98a | 8.42±1.07a | 26.79±3.27a |
| 3 | 81.40±4.09b | 8.18±2.14b | 6.98±1.28b | 21.82±3.93b |
Table text extracted from the original PDF; superscript letters are shown inline. The original table image is below.
View original table image
Discussion
The SpO 2 is a value that indicates the level of oxygen saturation in the blood. The ability to measure SpO 2 values give an advantage because it can be done without invasive action. The SpO 2 value measuring device is pulse oximetry that works through a mechanism to detect the oxygenated haemoglobin use light emitting diodes (LEDs) in specific wavelength. Through this mechanism, the use of an oximeter is enough to be done by attaching a sensor to the surface of the body that has blood vessels close to the surface of the body. The level of oxygen saturation in the blood has a direct relationship with blood conditions including hemoglobin levels, red blood cell counts, and hematocrite values. The SpO 2 value has the strongest relationship with blood hemoglobin levels so it can theoretically be used to help diagnose anemia. The anemia condition in experimental sheep occurred artificially through blood loss of 108 ml per day. The amount of blood lost is taken into close to the amount of blood loss in conditions of acute haemonchosis. In acute and moderate infections, the number of infecting worms is estimated to be around 400-1500 worm (Alam et al., 2020) [1] and each adult worm is able to suck blood as much as 0.03 ml/worm/day (Naeem and Iqbal 2021) [13] . Haemonchosis significantly lowers red blood cell count, hemoblobin, and hematocrite (Alam et al., 2020) [1] . Therefore, this condition of artificial anemia can give a representative of mucosal color similar to the anemia condition due to haemonchosis. The pale color of the conjunctival mucosa of the eye is usually detected by examination of the Famacha technique. This technique is carried out by comparing the color of the conjunctiva with a special measuring chart so that it can be known the degree of paleness that reflects the burden level of Haemonchus sp. Infection (van Wyk and Bath, 2002) [21] . This method is practical to use but in some ways must be adapted because the differences condition like conditions of animal husbandry, sheep breeds, and climate in the country. The amount of blood volume lost through direct blood draw will lower the number of red blood cells. Therefore, hemoglobin levels and hematocrit values also decreased. The number of red blood cells in sheep after blood draw decreased by about 16.36%. The condition directly influences the discoloration of the mucosa. The mucosal color that looks more pale is the color of the conjunctival mucosa of the eyes and the color of the gum mucosa does not change too much. The mucosal color is getting paler because the amount of the red blood cells in the microvascular reduced significantly. The blood profile parameters in sheep is reported have a wide range and variation. The average of normal red blood cell count is 7.3±1.4 million/cumm (Rahman et al., 2018) [14] . In this study, the number of red blood cells has decreased to about 1.6 million so it can be ascertained that sheep have anemia. This condition is similar in sheep that have haemonchosis or have gastrointestinal parasite infection and show symptoms of anemia that give a blood profile of red blood cell count 7.3±1.6 -8.6± 2.1 x 10 6 /μl (Chirkena et al., 2016) [7] . When the experimental sheep has anemia due to the phlebotomy, they show a clinical sign and changing in behavior. Sheep experience a slight weakness and have a slight increase in body temperature. The sheep that had been active before looked more silent after has anemia.
The Hb levels of anemic sheep also decreased significantly. The decrease in hemoglobin levels in anemic sheep was about 17.8%. Normal Hb levels in sheep are about 10.15±0.83 g/dl (Rahman et al., 2018) [14] . The function of haemoglobin is to bind oxygen in the blood and carry it to the tissues. Therefore, Hb levels greatly affect the physiological condition of the body. In cases of haemonchosis or gastrointestinal parasite infection, Hb level may decrease to 6.9±1.1 g/dl (Chirkena et al., 2016) [7] . At low Hb levels due to haemonchosis, this can cause clinical symptoms including paleness in mucous membranes, especially in conjunctiva with a red-pink appearance to a pale white color (Besier et al., 2016) [5] . The hematocrite value also decreased about 19.2% in anemic sheep. Hematocrite shows the value of the ratio between the volume of red blood cells to a unit of blood volume. The average normal hematocrite value in sheep was 30.56±3.66% (Rahman et al., 2018) [14] and was reported to be slightly lower in fat tailed sheep at 33.7±6.1% (Islam et al., 2018) [9] . The hematocrite after the sheep has anemic shows a significant decrease. The results of hematocrit measurements obtained a value of 21.82±3.93% which was slightly lower in the condition of sheep who has gastrointestinal parasitic infections reported by et al. They reported that sheep has gastrointestinal parasitic infection has around 23.0±3.7% (Chirkena et al., 2016) [7] . The SpO 2 value describes the value of oxygen saturated in the blood and it has the strongest relationship with Hb levels. The ability of the blood to bind oxygen is influenced by the presence of haemoglobin so that these two variables have a strong relationship (ALhyari et al., 2018) [2] . Examination of SpO 2 value for different kinds of animals has the same principle but the practice of laying the sensor can be different. In this study, the sensor was placed on the medial part of the sheep's ears that were not overgrown with hair. The time it takes for the pulse oximetry to be able to measure is 5-10 seconds with the position of the sensor not shifting as long as it is attached to the skin. The SpO 2 examination with the principle of earlobe probes in humans was reported to provide high accuracy values (Seifi et al., 2018) [17] so that this study was also carried out in the ear area. The principle of using this oximeter is similar to the conventional pulse oximetry used on the skin. This pulse oximeter monitors oxygen levels in arterial vessels while other types sensor can represent oxygen levels in microvascular (Dixon et al., 2019) [8] . Therefore, when taking measurements, sheep must be handled properly. In dogs and cats, measurements using an oximeter are usually mounted on their lips. In large animals such as cows or horses, oximeter measurements can used in tongue or in the ear. The results of the linear line equation show that the SpO 2 value can estimate haemoglobin levels with a coefficient of determination of 0.74. Through this estimation, the condition of anemia can be determined without having blood examination in the laboratory. Furthermore, the application of this estimation is necessary to be connected with the results of the examination of the eggs per gram of faeces (EPG) of Haemonchus contortus. This is because the anemia condition is not only caused by haemonchosis, some other causes include piroplasmosis. The incidence of piroplasmosis in sheep is caused by Babesia sp. and Theileria sp. infections which they are vector borne diseases (Villanueva-saz et al., 2022) [20] . With combining the results of SpO 2 measurements to assess the status of anemia conditions and then linked to the results of EPG examination, it can be determined that the anemia occurs is either due to haemonchosis conditions or by other causes.
Conclusion
Examination of SpO 2 values can be used to predict the incidence of anemia in sheep. The value of SpO 2 in anemic sheep is around 81% with Hb levels about 6.98 g/dl. The results of the SpO 2 examination need to be linked to the results of the EPG examination to ensure the anemia condition that occurs is caused by haemonchosis.
Acknowledgement
AcknowledgementThe authors thank to Institute for Research and Community Services (LPPM) IPB University for providing grants through Dosen Muda funding 2022.
Figures and tables from the paper
References
20 in the original paper- Alam RTM, Hassanen EAA, El-Mandrawy SAM. Heamonchus contortus infection in sheep and goats: alterations in haematological, biochemical, immunological, trace element and oxidative stress markers. Journal of Applied Animal Research. 2020;48(1):357-364.
- ALhyari I, Alabadi M, HIjazin G, Alasasfeh F. SPO 2 Vital Sign: Definition, ranges, and measurements. International Journal of Scientific and Research Publications. 2018;8(7):287-289.
- Arsenopoulos KV, Fthenakis GC, Katsarou EI, Papadopoulos E. Haemonchosis: A challenging parasitic infection of sheep and goats. Animals. 2021;11:1-28.
- Astuti DA, Sudarman A. Blood profile of sheep fed with Ca saponified lemuru oil coated by herb. Buletin Peternakan. 2015;39(2):116-122.
- Besier RB, Kahn LP, Sargison ND, Van Wyk JA. Diagnosis, treatment and management of Haemonchus contortus in small ruminants. Advances in parasitology. 2016;93:181-238.
- Cheung A, Tu L, Macnab A, Kwon BK, Shadgan B. Detection of hypoxia by near-infrared spectroscopy and pulse oximetry: A comparative study. Journal of Biomedical Optics. 2022;27(7):1-10. DOI: 10.1117/1.JBO.27.7.077001.
- Chirkena K, Getachew S, Beyene G, Dinede G. Hematological parameters of sheep: An aid in the diagnosis of gastrointestinal (GIT) and respiratory diseases. Nature and Science. 2016;14(5):97-102.
- Dixon B, Turner R, Christou C. Assessment of a Noninvasive brain oximeter in a sheep model of acute brain injury. Medical Devices Evidence and Research. 2019;12:479-487.
- Islam S, Rahman K, Ferdous J, Hossain MB, Hassan MM. Hematological reference values for healthy fattailed sheep (Dhumba) in Bangladesh. Journal of Advenced Veterinary and Animal Research. 2018;5(4):481-484.
- Johns J, Heller M. Hematologic conditions of small ruminants. The Veterinary Clinics of North America Food Animal Practice. 2021;37(1);183-197.
- Katsogiannou E, Athanasiou L, Christodoulopoulos G, Polizopoulou Z. Diagnostic approach of anemia in ruminants. Journal of the Hellenic Veterinary Medical Society. 2018;69(3):1033-1046.
- Meznar M, Pareznik R, Voga G. Effect of anemia on tissue oxygenation saturation and the tissue deoxygenation rate during ischemia. Critical Care 29th Int Symp Intensive Care Emerg Med. 2009;13(1):238.
- Naeem M, Iqbal Z. Ovine haemonchosis : a review. Tropical Animal Health Production. 2021;53(19):1-11.
- Rahman K, Islam S, Ferdous J, Uddin H, Hossain MB. Determination of hematological and serum biochemical reference values for indigenous sheep (Ovies aries) in Dhaka and Chittagong Districts of Bangladesh. Veterinary World. 2018;11:1089-1093.
- Röttgering JG, de Man AME, Schuurs TC, Wils E-J, Daniels JM, van den Aardweg JG, et al. Determining a target SpO2 to maintain PaO2 within a physiological range. PLoS One. 2021;16:5.
- Saini BS, Darby JRT, Portnoy S, Sun L, van Amerom J, Lock MC, et al. Normal human and sheep fetal vessel oxygen saturations by T2 magnetic resonance imaging. The Journal of Physiology. 2020;598(15):3259-3281.
- Seifi S, Khatony A, Moradi G, Abdi A, Najafi F. Accuracy of pulse oximetry in detection of oxygen saturation in patients admitted to the intensive care unit of heart surgery: comparison of finger, toe, forehead and earlobe probes. BioMed Central Nursing. 2018;17(15):17.
- Suherlim DA, Permana H, Lubis L.. Correlation between haemoglobin concentration and oxygen saturation (SpO 2) in elderly professors. Journal of Medical Science. 2018;50(2):157-162.
- Villanueva-saz S, Borobia M, Fern A, Jim C, Figueras L. Anaemia in sheep caused by Babesia and Theileria haemoparasites. Animals. 2022;12:1-15.
- van Wyk JA, Bath GF. The FAMACHA system for managing haemonchosis in sheep and goats by clinically identifying individual animals for treatment. Veterinary Research. 2002;33(5):509-529.
Cited by 1
From OpenAlex, OpenCitations and reference lists read by Scinovex
- Gastrointestinal nematode parasites of grazing ruminants: a comprehensive literature review of diagnostic methods for quantifying parasitism, larval differentiation and measuring anthelmintic resistance ↗
Matthew C. Playford, R. Brown Besier · New Zealand Veterinary Journal · 2024
This review summarises up-to-date research on the diagnosis of gastrointestinal nematode (GIN) infection in livestock and anthelmintic resistance in GIN. It was commissioned to assist funding bodies to prioritise and guide research and extension efforts to improve the health, welfare and productivity of grazing ruminants in the face of challenge with GIN. A comprehensive review of published articles from journals,…
❝ 14