
Research article · 2022 · Full text
International Journal of Agriculture and NutritionEffect of deficit irrigation on yield and water use efficiency of maize at indris irrigation scheme, Western Oromia, Ethiopia
Volume 4(2) · Pages 119–123 · DOI: 10.33545/26646064.2022.v4.i2b.103 ↗
Research areasCrop Yield and Soil FertilityRice Cultivation and Yield Improvement
Abstract
Author-writtenWater shortages are a critical issue in the agricultural sector. An experiment was conducted in the field to evaluate the effects of deficit irrigation on maize yields and water productivity. There was a significant (p
Summary
Source-checkedPlain-language reading of the full paper, prepared with AI and checked against the text. Each point links to the authors' own words.
Why it matters
- Irrigated agriculture is a key strategy for increasing food production and self-sufficiency in Ethiopia. View evidence ↗
- Farmers in the Indris small-scale irrigation scheme face water supply shocks, particularly those located downstream. View evidence ↗
- Water shortages have driven farmers to explore deficit irrigation systems to maximize water use efficiency while maintaining crop production. View evidence ↗
The question
- The study aimed to evaluate how deficit irrigation affects maize yield and water use efficiency to determine the optimal irrigation level for maximizing productivity. View evidence ↗
What they did
- The research was conducted in the char kebele of Sibu Sire woreda, located in the Eastern Wollega zone of Ethiopia. View evidence ↗
- The experiment used a Randomized Complete Block Design (RCBD) with three replications and four conventional furrow irrigation levels. View evidence ↗
- The four irrigation treatments were 100% (T1), 85% (T2), 75% (T3), and 50% (T4) of the crop evapotranspiration (ETC). View evidence ↗
- The researchers measured plant height, cob length, cob diameter, and overall grain yield. View evidence ↗
What they found
- The highest grain yield (5346.9 kg/ha) was achieved with 100% ETC, while the lowest (3061.5 kg/ha) occurred at 50% ETC. View evidence ↗
- Irrigation water use efficiency was highest at 50% ETC (1.08 kg/m3) and lowest at 100% ETC (0.94 kg/m3). View evidence ↗
- Applying 75% ETC saved 1288.8 m3/ha of water, which is equivalent to enough water to irrigate an additional 0.33 ha of land. View evidence ↗
What it means
- The authors recommend applying 75% ETC throughout the growth of the 'shoney' maize variety under conventional furrow irrigation. View evidence ↗
- Full irrigation (T1) is suggested as a second alternative only when water is not a limiting factor. View evidence ↗
Visual summary
3 visualsIllustrations explain the paper; charts are replotted from the paper's own table values.
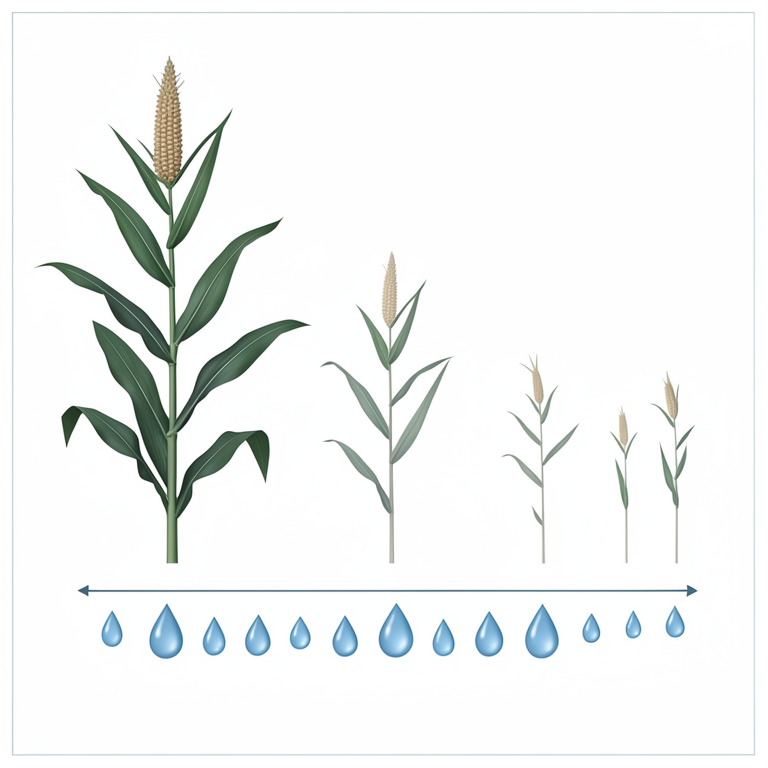
Trade-off between Yield and Water Efficiency
AI-generated conceptual illustration (maize plants). It explains the idea and does not show study data.
View source evidence ↗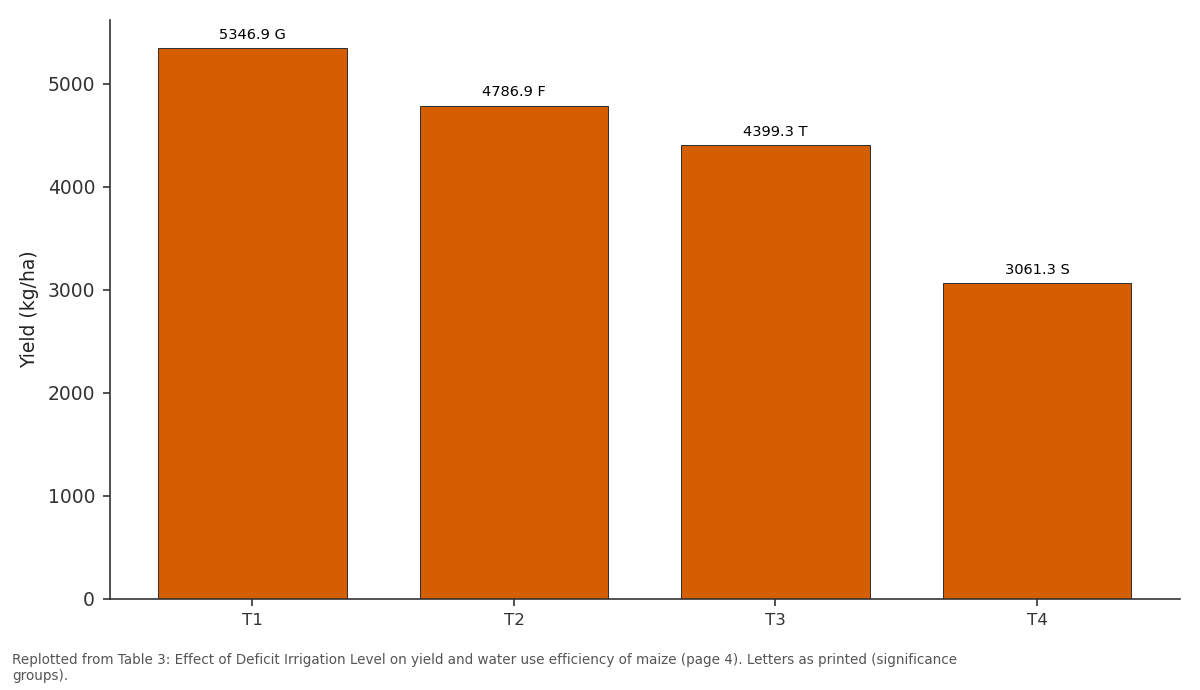
Yield (kg/ha): T1 vs T2 vs T3 vs T4
Replotted from Table 3 (page 4) of the original paper. Every bar is the paper's own table value.
View source evidence ↗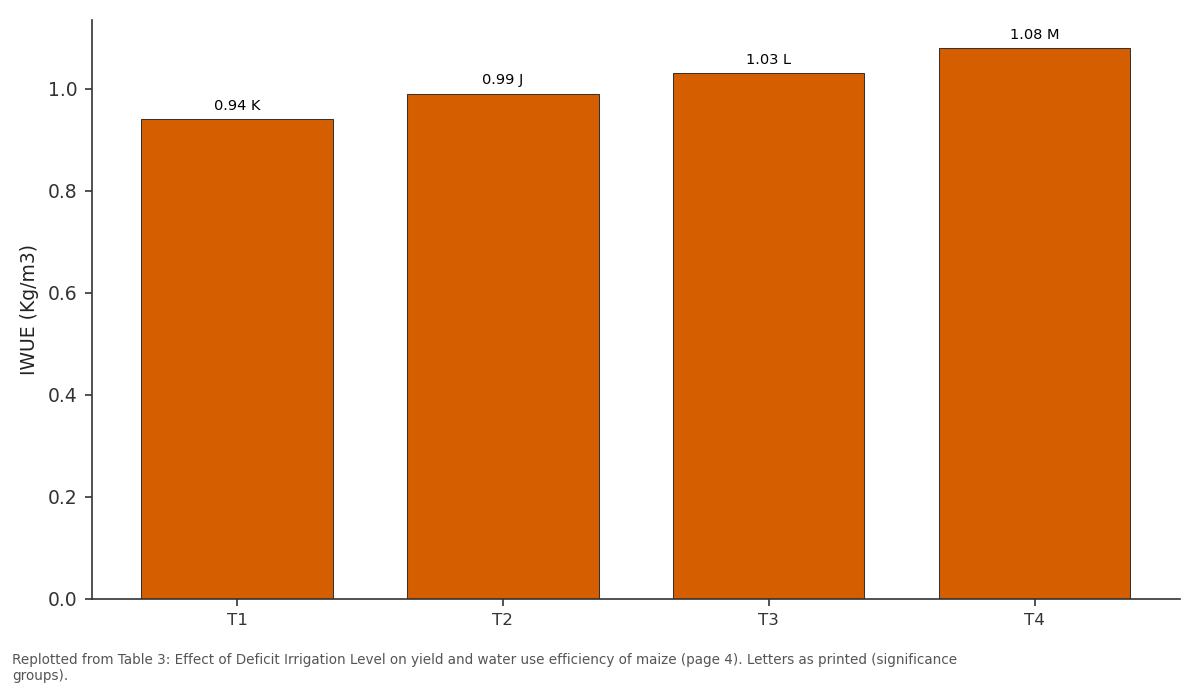
IWUE Kg/m3: T1 vs T2 vs T3 vs T4
Replotted from Table 3 (page 4) of the original paper. Every bar is the paper's own table value.
View source evidence ↗Figures & tables
From the original paper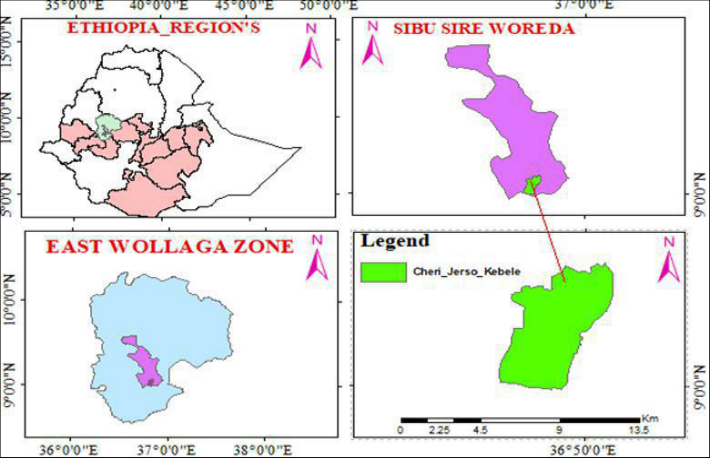 Figure 1
 Table 1
 Table 3
 Table 4
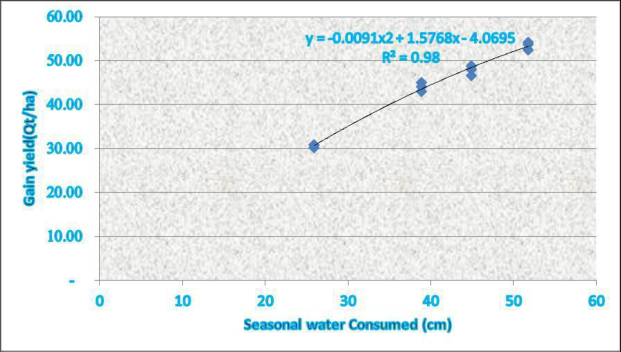 Figure 2
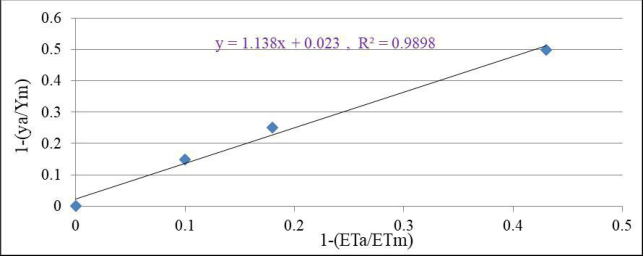 Figure 3
 Table 5
Introduction
Irrigated agriculture is known for ensuring food security and being one of the most important concerns. In a rapidly growing country like Ethiopia, this is seen as a method of boosting food production and self-sufficiency. Increasing population pressure, rapidly declining natural resource bases, and variable rainfall have secured irrigated agriculture a prominent position on the country's development agenda (Sisay et al., 2011) [16] . In order to ensure continued production and preservation of this limited resource, irrigated agriculture has increased its water use efficiency due to increasing competition between different water use sectors (Mekonen, 2011) [13] . There have been studies that indicate some small-scale irrigation schemes developed have not covered the designed command area nor are they producing optimum yields, mainly due to structural problems and inefficient irrigation water management (Seleshi and Mekonnen, 2011) [14] . It is especially true of the indris small-scale irrigation scheme, where farmers downstream are increasingly susceptible to water supply shocks. Farmers have been motivated by this water shortage to find ways to produce crops with less irrigation water and switch from fully-irrigated to deficit irrigated cropping systems that maximize water use efficiency. The aim of this study was to evaluate the effects of deficit irrigation on maize yield and water use efficiency, and also determined the optimal deficit irrigation level for maximizing yield and water productivity.
Materials and Methods
The research was conducted at the Eastern wollega zone, Sibu Sire woreda char kebele. This is located about 270 km west of Ethiopia's capital, Addis Ababa. It also found an altitude of 1826 meters above sea level and lies in 9°02'38.9'' N and 36°52'31.3'' E Latitude and longitude respectively. Average maximum and minimum temperatures were 23.2 and 13.9°C respectively.
Experimental design and Treatment
The experimentation was designed with four deficit irrigation levels of furrow irrigation(conventional), using RCBD and three replications. 50% ET C was selected because of maximum allowable deficit recommended for grain maize (Allen et al., 1998) [1] . The experiment plot has a net size of 6m X 8m with spacing of 75cm X 25cm between row rows and plants respectively. Experimental treatments were; T 1 = 100% ET C water application, T 2 =85% ET C water application, T 3 = 75% ET C water application, T 4 = 50% ET C water application. After setting of treatments soil moisture contents at field capacity and permanent wilting point were analyzed by applying pressure at 0.33 bar (for FC) and 15 bar (for PWP). Based on these the total available water (TAW) was determined as expressed (Jaiswal, 2003) [10] Crop water Requirement and Irrigation scheduling of Maize Based on metrological data, soil characteristics, and crop data, the amount of irrigation and crop water needed for maize were created. The crop water demand was calculated by multiplying the ETo by the crop coefficient (Kc), which was provided by Allen et al. in 1998 [1] . According to Allen et al. (1998) [1] , the net irrigation demand was computed using the crop water requirement and the effective rainfall. The FAO/AGLW Formula was used to compute the effective rainfall (FAO, 2009) [8] , and the gross irrigation need was estimated by taking into account 60% of application efficiency. Water applied to the test field was measured using a 3-inch Parshall flume. The equation was used to determine how long it would take to provide the specified level of water to each plot (Kandiah, 1981) [11] .
𝑡 = 𝑑𝑔×𝐴 6×𝑄
Where; dg = gross depth of water applied (cm), t = application time (min) A = Area of experimental plot (m 2 ) and Q = flow rate (discharge) (l/s) The irrigation depth was converted to volume of water by multiplying it with area of the plot 𝑉 = 𝐴 × 𝑑𝑔 V = Volume of water in (m 3 ), A = Area of plot (m 3 ) and dg = Gross irrigation water applied (m)
Data collection Methodology
For the purpose of to gather data, representative samples of maize plants were cut above ground level, recorded as to plant height, and gathered for each plot from the middle ridge (row) of each treatment. Additionally, data on plant height, cob length, and cob diameter, as well as yield and yield component parameters, were gathered.
Crop water production Function and Yield Response Factor
Crop yield and seasonal water requirements (ETC) were fitted into multiple regression equations to create a crop water production function, and the regression equation with the highest coefficient of determination was chosen. Y= a + b (ETc) +C (ETc) 2 + d(ETc) 3 Where; Y = grain yield (kg/ha), ET C = seasonal actual evapotranspiration (mm), a = Y-axis intercept and b, c and d = Regression coefficients indicating the magnitude of yield variation (kg/ha) per unit increase in ETc. According to the method described by (Doorenbos and Kassam, 1979) [4] , the yield response factor (Ky), which is defined as the drop in yield with respect to the deficit in water consumptive use (ET), was computed as follows;
Where; Ky = yield response factor, Ya = actual yield obtained from each deficit treatments (kg/ha), Ym = maximum of maize yield obtained from the control treatment with full irrigation (kg/ha), ETa = net depth of irrigation applied for each deficit treatments (mm), ETm = net depth of irrigation water applied for the control treatment with full irrigation (mm), (
Economic Water Productivity
Net income and marginal rate of return were calculated taking into account the average cost of local people paying for daily labor (75.00 Birr/day), farm gate price corn during harvest period (10.50 Birr/kg), and the price of irrigation water (1.00 Birr 0.5 m3 of water). (CIMMYT, 1988) [3] states that the adjusted yield was calculated by deducting 10% from the average yield.
Statistical Analysis
RCBD analysis of variance for the assessed variables was performed using the SAS system. To compare mean separation, LSD at 5% and 1% level of probability was utilized.
Result and Discussions Soil of Experimental site
The results of the soil study indicated that the average percentages of sand, silt, and clay were 23.67, 34.0, and 42.33%, respectively, and that the texture was clay loam (Table 1). As shown in Table 1, the average soil moisture content at Field Capacity and Permanent Wilting Point (PWP) was 39.2% and 27.77%, respectively, and the total amount of water accessible was 142.89mm/m with a bulk density of 1.25g/cm3. According to the result of the soil analysis, the mean percentages of sand, silt, and clay were 23.67, 34.0, and 42.33%, respectively, and were categorized as clay loam texture (Table 1). Field capacity and Permanent wilting point (PWP) had an average soil moisture content of 39.2% and 27.77%, respectively, and the total amount of water available was 142.89mm/m with a bulk density of 1.25g/cm3 (Table 1).
| Depth (cm) | — | — | — | — | Distribution of particles by size (%) | — | — | Textural class |
|---|---|---|---|---|---|---|---|---|
| BD(g/cm3) | FC (%) | PWP (%) | TAW (mm/m) | sand | Clay | silt | ||
| 0-20 | 1.3 | 38 | 27 | 143.33 | 23 | 41 | 36 | Clay loam |
| 20-40 | 1.24 | 39 | 28 | 136.32 | 23 | 43 | 34 | Clay loam |
| 40-60 | 1.21 | 41 | 28.3 | 148.89 | 25 | 43 | 32 | Clay loam |
| Average | 1.25 | 39.2 | 27.77 | 142.89 | 23.67 | 42.33 | 34.0 | Clay loam |
Table text extracted from the original PDF; superscript letters are shown inline. The original table image is below.
View original table image
Crop Water Requirement and Irrigation Schedule of Maize
The reference evapotranspiration measurements were multiplied by the maize crop coefficient to determine the irrigation schedule and the crop water need for maize, which came out to be 518.72mm (5187.2m3/ha). According to (FAO, 1977), the seasonal crop water demand for maize for maximum yields is between 500 to 800 mm, depending on climate. The effective rainfall from ETc was used to calculate the net crop water requirement, while the gross crop water requirement was calculated using a field application efficiency of 60%. The results were 416.53 mm and 694.21 mm, respectively.
Effect of Deficit Irrigation levels on yield and yield Component of Maize Plant Height
According to Table 3's Anova results, the impact of irrigation levels on plan height was very significant (P< 0.01). The control treatment and T4 gave the highest (287.07 cm) and lowest (24.04 cm) plant heights, respectively. This is because shorter plant heights were produced when less irrigation water was applied, whereas larger plant heights were connected with more irrigation water application. This outcome is consistent with what Dirirsa et al. (2017) [5] and Mebrahtu et al. (2018) [12] found.
| Treatment | Irrigation water applied(m3/ha) | PH (cm) | CL (cm) | CD (cm) | Yield (kg/ha) | CWUE (Kg/ha/mm) | IWUE Kg/m3 | Water saved (m3/ha) |
|---|---|---|---|---|---|---|---|---|
| T1 | 5187.2 | 287.07A | 25.25H | 51.73L | 5346.9G | 1.29C | 0.94 K | |
| T2 | 4, 409.12 | 275.47B | 23.22I | 48.53M | 4786.9F | 1.35E | 0.99J | 778.08 |
| T3 | 3898.4 | 264.40C | 21.15J | 45.73N | 4399.3T | 1.39E | 1.03L | 1288.8 |
| T4 | 2593.8 | 240.47D | 16.97K | 38.93P | 3061.3S | 1.42B | 1.08M | 2593.4 |
| LSD (0.05) | 1.35 | 1.87 | 0.77 | 1.59 | 1.97 | 1.56 | 1.9 | |
| CV | 2.3 | 3.75 | 2.79 | 3.4 | 5.8 | 2.69 | 2.79 |
Table text extracted from the original PDF; superscript letters are shown inline. The original table image is below.
View original table image
Cob Length and Cob diameter
The results of the analysis of variance revealed that the variation in cob length and diameter as a result of various deficit irrigation treatment amounts was very significant (P< 0.01), as shown in Table 3. The control treatment produced the longest cobs (25.25 cm), while T4 produced the shortest cobs (16.97 cm). The control treatment produced the largest cob diameter (51.7 cm), whereas the T4 treatment produced the smallest cob diameter (38.9 cm).
Grain Yield
In accordance with Table 3's Anova results, the impact of irrigation levels on maize yield was very significant (P< 0.01). The highest yield of maize (5346 kg/ha) and the lowest yield of maize (3061 kg/ha) were obtained from T1 and T4, respectively. Similar to the current finding, Patel and Rajput (2013) also noted that water application at any stage of plant growth with no deficit (100% ETc) produced the maximum marketable yield. Additionally, Mekonen (2011) [13] found that crop water productivity was impacted differently by water stress at various growth stages.
Effect of Deficit Irrigation level on Water use Efficiency of Maize
Crop water use efficiency (CWUE) was significantly (P< 0.01), impacted by deficit irrigation levels, according to an analysis of variance indicated. At T4 and at full water application level (T1), the highest crop water use efficiency (1.43 kg/ha/mm) and lowest crop water use efficiency (1.29 kg/ha/mm) were attained. This outcome is consistent with that of Samson and Ketema (2007) as well as FAO (2002).
According to an analysis of variance, deficit irrigation levels had a significantly significant (P< 0.01), impact on irrigation water consumption efficiency. The maximum water consumption efficiency for irrigation (1.08kg/m3) was achieved under T4, which statistically differed significantly (P< 0.01), from all other treatments (Table 4). This outcome is consistent with (Sarkar et al. 2008), who found that irrigation water use efficiency increased at decreased soil moisture availability levels. The water uses efficiency results demonstrated that 75% ETC deficit irrigation levels could be used in areas with restricted irrigation water by increasing water use efficiencies with a sizable and tolerable yield reduction. As a result, it was determined that 75% ETC should be applied throughout the entire crop of this particular maize variety (shoney) under conventional furrow irrigation.
| Treatment | Grain yield (Kg/ha) | ETa(mm) | 𝐄𝐓 𝐚 𝐄𝐓 𝐦 | 𝐲 𝐚 𝐲 𝐦 | 𝐄𝐓 𝟏− 𝐚 𝐄𝐓 𝐦 | 𝐲 𝟏− 𝐚 𝐲 𝐦 | ky |
|---|---|---|---|---|---|---|---|
| T1 | 5,346.90 | 518.70 | 1.00 | 1.00 | 0.00 | 0.00 | - |
| T2 | 4,786.90 | 440.90 | 0.85 | 0.90 | 0.15 | 0.10 | 0.70 |
| T3 | 4,399.30 | 389.80 | 0.75 | 0.82 | 0.25 | 0.18 | 0.71 |
| T4 | 3,061.30 | 259.40 | 0.50 | 0.57 | 0.50 | 0.43 | 0.86 |
Table text extracted from the original PDF; superscript letters are shown inline. The original table image is below.
View original table image
Crop Water Production Function and yield Response Factor
The best relationship between seasonal crop evapotranspiration and grain yield was found (R 2 = 0.98; Figure 2). The coefficients a, b, and c had values of -0.0091, 1.5768, and -4.0695, respectively. Y= -0.0091(P+ I) 2 + 1.5768 (P+ I) -4.0695
Where, y= grain yield (qt/ha), P= effective Rain fall(cm), and I= net irrigation water(cm). The yield response factor that was achieved for each treatment was less than one and was 0.68, 0.62, 0.57, 0.61, and 0.65, respectively (Table 4). These findings are consistent with (Doorenbos and Kassam, 1979) [4] , who found that deficiency levels that persisted throughout the entire growing season could withstand yield drop (Ky < 1) throughout the local cropping season. In comparison to the (T1) irrigation water application, stressed treatments with irrigation application under T2, T3, and T4 revealed yield reductions of 10%, 18%, and 43%, respectively. This suggests a linear relationship (Fig. 3) between the relative yield decline and the relative water use decline. This relationship closely resembles that found in Bhagyawant et al. (2015) [2] . [3] , the minimum MRR that is acceptable is between 50% and 100%. Thus, according to the results of the current study (Table 5), the marginal rate of return is greater than 100%. This demonstrated that, in line with all treatments being economically significant. But by using T3, small-scale farmers with minimal production costs and the largest net gain were attained. However, the usage of T1 for incredibly profitable with higher cost which is advised as second alternative when water is not a limiting problem in area for crop production.
| Treatment | Amount of water applied (m3/ha) | Average of grain yield(ton/ha) | Adjusted grain yield(ton/ha) | Total return (ETB/ha) | Variable cost (ETB/ha) | Net income (ETB/ha) | MRR (%) |
|---|---|---|---|---|---|---|---|
| T1 | 5,187.20 | 5.3469 | 4.81221 | 50,528.21 | 19687.79 | 30,840.42 | 297.83 |
| T2 | 4, 409.12 | 4.7869 | 4.30821 | 45,236.21 | 18357.58 | 26,878.63 | 150.68 |
| T3 | 3898.40 | 4.3993 | 3.95937 | 41,573.39 | 16896.42 | 24,676.97 | 289.47 |
| T4 | 2593.80 | 3.0613 | 2.75517 | 28,929.29 | 13649.89 | 15,279.40 | - |
Table text extracted from the original PDF; superscript letters are shown inline. The original table image is below.
View original table image
Conclusions and Recommendation
Through field experimentation, a study was conducted to determine the impact of the level of deficit irrigation on yield and water productivity of maize. According to the findings, all levels of deficit irrigation had a highly significant (P 0.01) impact on maize's yield, yield component, and water use efficiency. T1 and T4 gave the highest and lowest amounts of maize grain, respectively. Similarly, T4 produced the highest IWUE and CWUE, whereas T1 produced the lowest. However, compared to T1, T4, T3, and T2 showed significantly lower yields, which may not be acceptable to farmers. This leads to the conclusion that applying a 75% ETC deficit irrigation level under a conventional furrow irrigation system resulted in water savings of 1288.9mm (1288.8m3/ha) compared to a full irrigation level, which could be used for down stream water user in irrigation scheme.
Acknowledgement
AcknowledgmentsThe Oromia Agricultural Research Institute provided funding to carry out the experiment, which we would like to thank. Additionally, we would like to appreciate Bako Agricultural Engineering Research Center's researchers and technical assistance.
Figures and tables from the paper
References
8 in the original paper- Bhagyawant RG, Gorantiwar SD, Dahiwalkar SD, Bhalekar MN, Khedkar D. Yield Response Factor for Onion (Allium cepa L) Crop under Deficit Irrigation in Semiarid Tropics of Maharashtra. Curr. Agri. Res. Jour. 2015;3(2):128-136.
- Doorenbos J, Kassam AH. Yield response to water. FAO irrigation and drainage. FAO, Rome, Italy. 1979;33:194.
- Dirirsa G, Woldemichael A, Hordofa T. Effect of Deficit Irrigation at Different Growth Stages on Onion (Allium cepa L.) Production and Water Productivity at Melkassa, Central Rift Valley of Ethiopia. Acad. Res. J Agri. Sci. Res. 2017;5(5):358-365.
- Mebrahtu Y, Woldemichael A, Habtu S. Response of onion (Allium cepa L.) to deficit irrigation under different furrow irrigation water management techniques in Raya Valley, Northern Ethiopia. African Journal of Plant Science. 2018;12(5):105-113. (ISSN 1996-0824).
- Mekonen Ayana. Deficit irrigation practices as alternative means of improving water use efficiencies in irrigated agriculture: Case study of maize crop at Arba Minch, Ethiopia. African J of Agri. Res. 2011;6(2):226235.
- Seleshi Bekele Awulachew, Mekonnen Ayana. Performance of irrigation: An assessment at different scales in Ethiopia. Expl. Agri. 2011;47(Sl):57-69.
- Sarkar S, Goswami SB, Mallick S, Nanda MK. Different indices to characterize water use pattern of micro sprinkler irrigated onion (Allium cepa L.). Agricultural Water Management. 2008;95:625-632.
- Sisay Demeku Dirib, Descheemaeker K, Amare Haileslassie, Tilahun Amade. Irrigation water productivity as affected by water management in a small-scale irrigation scheme in the Blue Nile Basin, Ethiopia. Expl. Agri. 2011;47(Sl):39-55.