
Research article · 2023 · Full text
International Journal of Statistics and Applied MathematicsChen’s model to understand the invariant fuzzy time series model through maize production in India
Volume 8(3) · Pages 54–57 · DOI: 10.22271/maths.2023.v8.i3a.980 ↗
Research areasStock Market Forecasting MethodsFuzzy Logic and Control SystemsForecasting Techniques and Applications
Abstract
Author-writtenThe present study has applied a time-invariant fuzzy time series model for maize Production in India. Most of the time series data is forecasted using AR and ARIMA models but the present study considered the Chen fuzzy time series model to understand fuzzy time series and endeavour to forecast. Generally, fuzzy models are based on uncertainty, non-probabilistic and linguistic variables. The maize production of India during 1951-2020 data was divided into seven subsets. The subsets are equal intervals. Chen's model has used arithmetic operations for fuzzy logic relations and forecasting. The accuracy of the model was measured by Root Mean Square Error (1949.93) and Mean Absolute Percentage Error (25.86). The Chen model will give impetus to the higher-order fuzzy time series model.
Summary
Source-checkedPlain-language reading of the full paper, prepared with AI and checked against the text. Each point links to the authors' own words.
Why it matters
- Maize is considered one of the most critical crops for human consumption, second only to rice and wheat. View evidence ↗
- India holds the fourth rank globally in terms of maize cultivation area, covering 9.89 million ha with a productivity of approximately 3.19 t/ha. View evidence ↗
- Fuzzy models are utilized because they can handle uncertainty and linguistic variables in a non-probabilistic manner. View evidence ↗
The question
- The study aims to use the Chen fuzzy time series model to understand fuzzy time series and attempt to forecast maize production. View evidence ↗
What they did
- The researchers used maize production data from India spanning the years 1951 to 2020, which was divided into seven subsets. View evidence ↗
- The data subsets were created using equal intervals. View evidence ↗
- The Chen model employed arithmetic operations to establish fuzzy logic relations and perform forecasting. View evidence ↗
- The invariant fuzzy time series model followed a six-step process: defining the universe of discourse/intervals, partitioning intervals, defining fuzzy sets, fuzzifying data, establishing relationships, and forecasting/defuzzifying results. View evidence ↗
What they found
- The 70-year dataset of maize production was successfully categorized into seven distinct subsets. View evidence ↗
- The study identified 19 fuzzy logic relations, which were then used to form fuzzy logic relative groups. View evidence ↗
- The model's accuracy was determined to be a Root Mean Square Error (RMSE) of 1949.93 and a Mean Absolute Percentage Error (MAPE) of 25.86. View evidence ↗
What it means
- The authors conclude that the Chen model provides a foundation that will encourage the development of higher-order fuzzy time series models for forecasting. View evidence ↗
Visual summary
3 visualsIllustrations explain the paper; charts are replotted from the paper's own table values.
Fuzzy Time Series Workflow
AI-generated conceptual illustration (maize plants in an Indian agricultural field). It explains the idea and does not show study data.
View source evidence ↗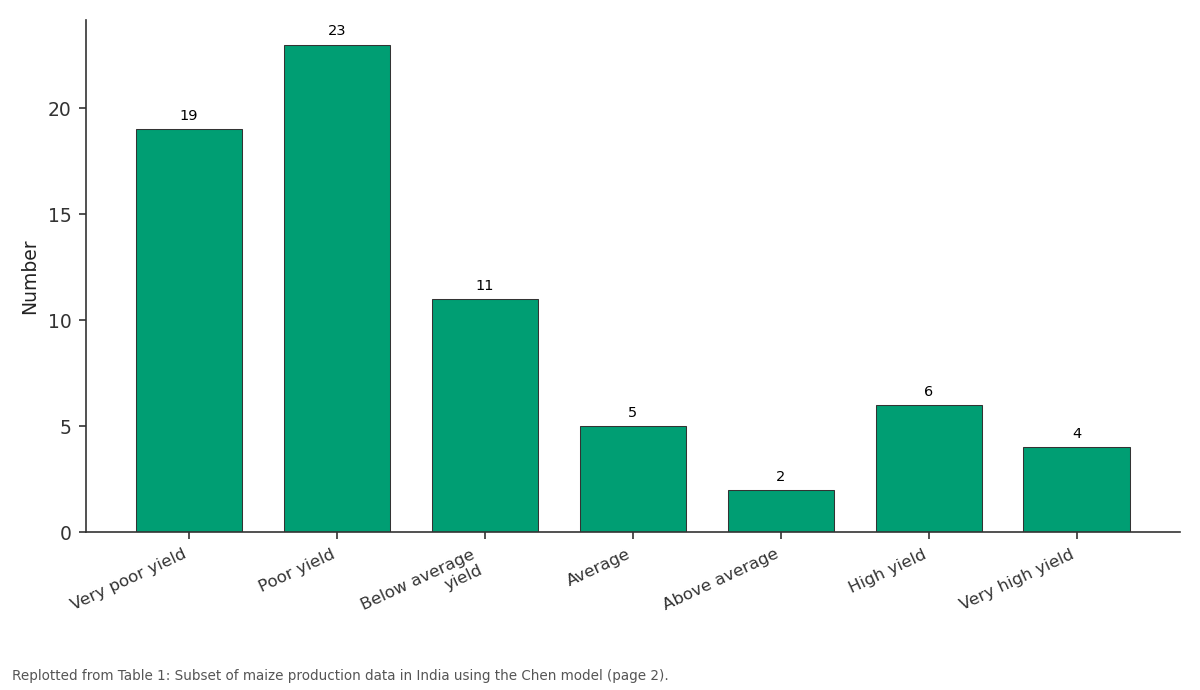
Number: Very poor yield vs Poor yield vs Below average yield vs Average vs Above average
Replotted from Table 1 (page 2) of the original paper. Every bar is the paper's own table value.
View source evidence ↗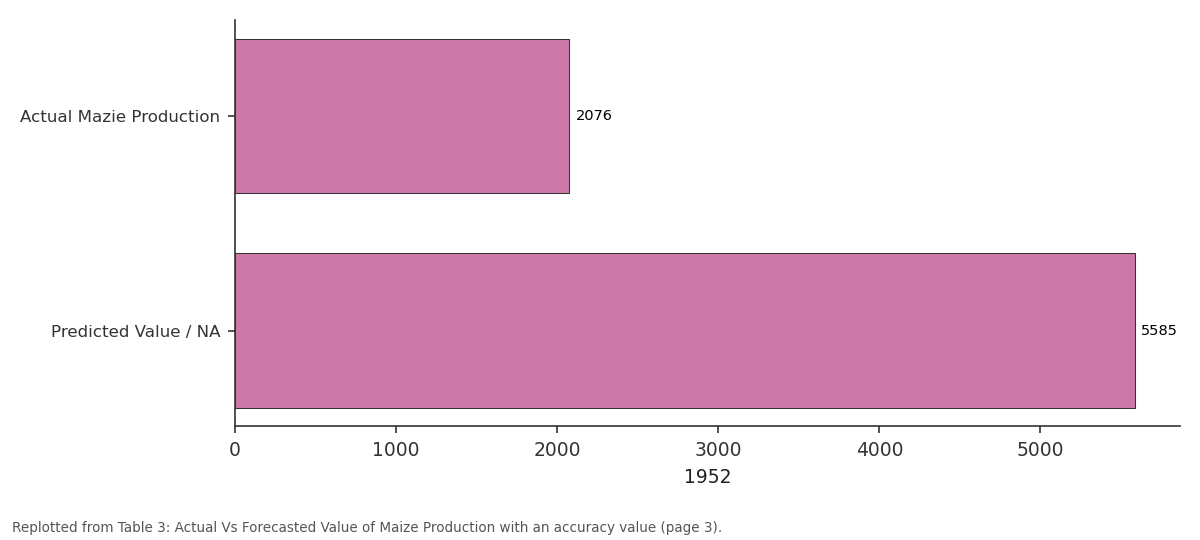
1952: Actual Mazie Production vs Predicted Value / NA
Replotted from Table 3 (page 3) of the original paper. Every bar is the paper's own table value.
View source evidence ↗Figures & tables
From the original paper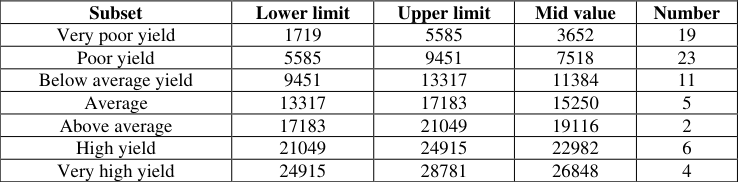 Table 1
 Table 2
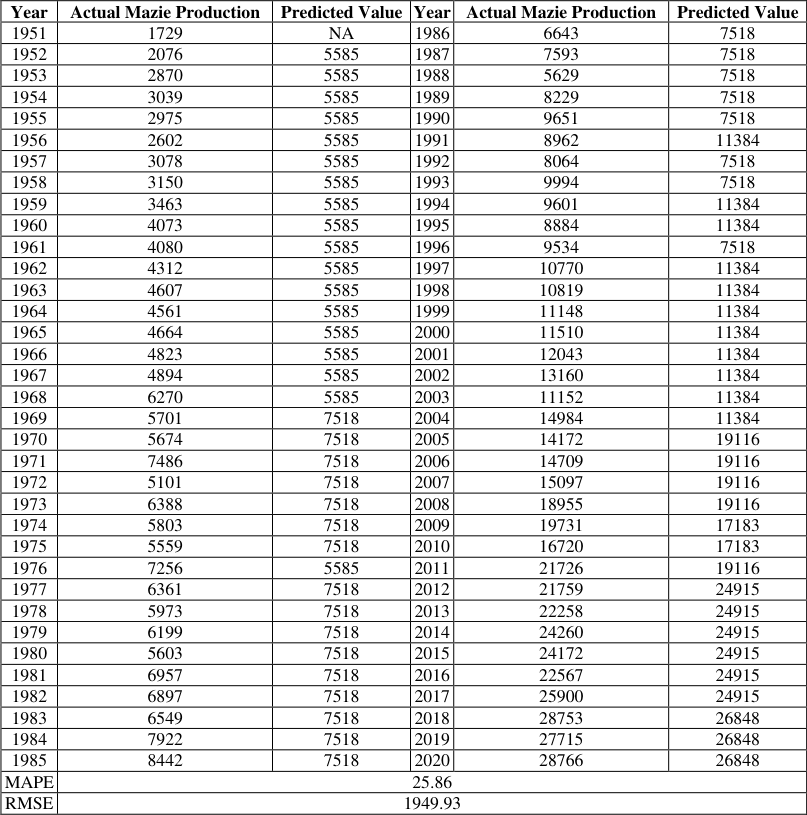 Table 3
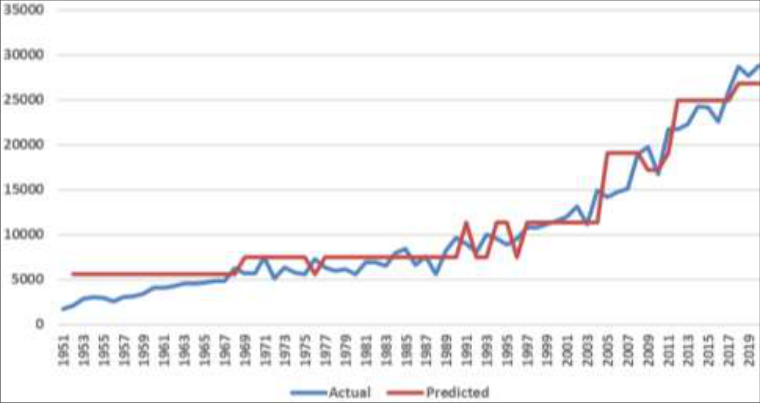 Figure 1
Introduction
Maize (Zea mays) is known as the queen of cereal crops and one of the most important crops for human consumption next to rice and wheat. India is ranked fourth in terms of area with 9.89 million ha and the productivity is about 3.19 t/ha. The major pattern of maize consumption is considered as feed, food and Industrial non-food products (mainly starch). Around 47% of maize produced in India is consumed by feed industries. From this, about 63% of the consumption is going to poultry and cattle feed. Karnataka, Madhya Pradesh, Maharashtra, Rajasthan, Bihar, Uttar Pradesh, Telangana, Gujarat and Tamil Nadu are contributing above 75% of production to the country. The traditional maize growing areas are Bihar, Madhya Pradesh, Rajasthan, and Uttar Pradesh and non-traditional maize areas such as Karnataka and Andhra Pradesh. The crop is mainly grown in traditional areas as a subsistence crop to satisfy food needs. In comparison, maize is grown commercially in non-traditional areas, primarily to supply the expanding poultry industry's feed needs. Zadeh [1965] [7] introduced the FS theory to deal with having uncertainty and impression, this becomes an amazing tool for many real-life problems involving vagueness and impression in the information. Soft computing techniques are more comfortable tools for forecasting over other statistical models in forecasting (Rana et al., 2020a) [5] . Rana et al., [2020b] [6] used nested interval-based fuzzy time series models to reduce the error in forecasting values significantly for fish production. The shape of the membership function was important in fuzzy time series model thus that triangular and trapezoidal membership with centroid defuzzification used by Basyigit et al., [2014] [1] . Kumar et al., [2010] [3] applied a fuzzy time series model to forecast wheat production. Kumar et al., [2019] [4] build a mathematical prediction model that depends on the high-order fuzzy logical relationship to reduce the average forecasting error of the existing fuzzy time series forecasting method and increased the accuracy of prediction value in agricultural production.
Materials and Methods
Let's consider fuzzy set A, 𝐴 = {𝑢 𝑖 , 𝜇 𝐴𝑖 (𝑢 𝑖 )|𝑢 𝑖 Є U}, where 𝜇 𝐴𝑖 is called the membership function for the fuzzy set A. U is referred to as the universe of discourse with U = {𝑢 1 , 𝑢 2 , 𝑢 3 ………, 𝑢𝑛}, where 𝑢 i are possible linguistic values of U, then a fuzzy set of linguistic variables A i of U is defined by
Each element is mapped to [0, 1] in fuzzy sets by a membership function. Let Y(t) (t =…..,0, 1, 2, 3,…..) be a subset of R, be the universe of discourse on which fuzzy sets [f i (t): i = 1, 2, … ] are defined and F(t) is the collection of fuzzy sets, then F(t) is defined as fuzzy time series on Y(t). At different times, the values of F(t) can be different, F(t) is a function of time and similarly, the universe of discourse Y(t) may be different at different times. If there exists a fuzzy relationship𝑅(𝑡, 𝑡 -1), such that
Where 𝜊 is an operator, then F(t) is said to be caused by F (t -1). The relationship between F(t) and F (t -1) can be denoted by 𝐹(𝑡 -1) → 𝐹(𝑡). Suppose F(t -1) = A i and F(t) = A j , a fuzzy logical relationship is defined as
where A i is named as the left-hand side of the fuzzy logical relationship and A j on the right-hand side. Fuzzy logical relationships can be further grouped into fuzzy logical relationship groups according to the same left-hand sides of the fuzzy logical relationships.
𝐴 𝑖 → 𝐴 𝑗1 , 𝐴 𝑗2 … ., Suppose F(t) is a fuzzy time series and 𝑅(𝑡 1 , 𝑡 1 -1) be a first-order model of F(t) such that 𝑅(𝑡 1 , 𝑡 1 -1) = 𝑅(𝑡 2 , 𝑡 2 -1) for 𝑡 1 ≠ 𝑡 2 , the F(t) is called the time-invariant fuzzy time series. But if 𝑅(𝑡 1 , 𝑡 1 -1) is time-dependent i.e., 𝑅(𝑡 1 , 𝑡 1 -1) ≠ 𝑅(𝑡 2 , 𝑡 2 -1) for 𝑡 1 ≠ 𝑡 2 , then F(t) is called time-variant fuzzy time series. If F(t) is caused by more fuzzy sets, 𝐹(𝑡 -𝑛), 𝐹(𝑡 -𝑛 + 1), … . , 𝐹(𝑡 -1), the fuzzy relationship is represented by
where 𝐹(𝑡 -𝑛) = 𝐴 𝑖1 , 𝐹(𝑡 -𝑛 + 1) = 𝐴 𝑖2 ,…, 𝐹(𝑡 -1) = 𝐴 𝑖𝑛 . This relationship is called the n th -order fuzzy time series model Rana et al., [2020b] [6] .
Fuzzification and defuzzification
The process of generating membership values for a fuzzy variable using membership functions is termed fuzzification. (i.e., translation from 𝑢 to 𝜇 𝐴 (𝑢). The process of transforming a fuzzy output of a fuzzy inference system into a crisp output is known as defuzzification. The input for the defuzzification process is a fuzzy set and the output is a single number.
Membership functions
A membership function (MF) is a curve that defines how each point in the input space is mapped to a membership value (or degree of membership) between 0 and 1. The input space is sometimes referred to as the universe of discourse.
Where 𝜇 𝐴 (𝑢) = 1 if u is totally in fuzzy set A; 𝜇 𝐴 (𝑢) = 1 if u is not in fuzzy set A; 0 < 𝜇 𝐴 (𝑢) < 1 if u is partly in fuzzy set A; In this study time-invariant fuzzy time series model especially Chen model is used for maize production data in India for the 1951 to 2020 data set. The steps involved in the invariant fuzzy time series model are 1) Defined the universe of discourse and the intervals, 2) Partition of the intervals, 3) Defined the fuzzy sets, 4) Fuzzified the data, 5) Established fuzzy relationships, 6) Forecasted and defuzzified the forecasting results.
In the Chen Model, the arithmetic operation is applied for establishing fuzzy relationships and forecasting Joshi et al., [2013] [2] . In the Table 1 showed that the whole 70 years of mazie production data have been divided into seven subsets. The intervals of each subset had been equal. Therefore, the fuzzy set is called an equal interval fuzzy set. The mid-value of each set is calculated by adding both lower and upper limit values and dividing by two. The last column indicated the number of observations belonging to the corresponding sets.
| Subset | Lower limit | Upper limit | Mid value | Number |
|---|---|---|---|---|
| Very poor yield | 1719 | 5585 | 3652 | 19 |
| Poor yield | 5585 | 9451 | 7518 | 23 |
| Below average yield | 9451 | 13317 | 11384 | 11 |
| Average | 13317 | 17183 | 15250 | 5 |
| Above average | 17183 | 21049 | 19116 | 2 |
| High yield | 21049 | 24915 | 22982 | 6 |
| Very high yield | 24915 | 28781 | 26848 | 4 |
Table text extracted from the original PDF; superscript letters are shown inline. The original table image is below.
View original table image
Forecasting accuracy measures
Forecasting accuracy measures
Results and Discussion
From the 19 fuzzy logic relations:
formed the fuzzy logic relative groups using ∪ 𝑖=1 19 𝑅 𝑖 ; where R is fuzzy time-invariant relation.In Table 3, the forecast value has been presented. There are obtained from the following steps If A i → A j is the only fuzzy logic relation in Table 2 then next year's forecast will be m k i.e. mid-value of A j . The forecasted value of the year 2018-2020 would be the mid-value of subset A 7 because these years had A 7 → A 7 fuzzy logic relation. If relation groups were A 1 → A 1 , A 2 then the forecast value would be the mean of the corresponding mid-value. Therefore forecast value of relation A 1 → A 1 , A 1 → A 2 has been (3652+7518)/2 = 5585. Similarly, for the fuzzy logic relation group A 2 → A 1 , A 2 , A 3 the forecast has been (3652+7518+ 11384)/3. The accuracy of the forecast is measured by Root Mean Square Error (RMSE) and Mean Absolute Percentage Error (MAPE).
| Year | Actual Mazie Production | Predicted Value | Year | Actual Mazie Production | Predicted Value |
|---|---|---|---|---|---|
| 1951 | 1729 | NA | 1986 | 6643 | 7518 |
| 1952 | 2076 | 5585 | 1987 | 7593 | 7518 |
| 1953 | 2870 | 5585 | 1988 | 5629 | 7518 |
| 1954 | 3039 | 5585 | 1989 | 8229 | 7518 |
| 1955 | 2975 | 5585 | 1990 | 9651 | 7518 |
| 1956 | 2602 | 5585 | 1991 | 8962 | 11384 |
| 1957 | 3078 | 5585 | 1992 | 8064 | 7518 |
| 1958 | 3150 | 5585 | 1993 | 9994 | 7518 |
| 1959 | 3463 | 5585 | 1994 | 9601 | 11384 |
| 1960 | 4073 | 5585 | 1995 | 8884 | 11384 |
| 1961 | 4080 | 5585 | 1996 | 9534 | 7518 |
| 1962 | 4312 | 5585 | 1997 | 10770 | 11384 |
| 1963 | 4607 | 5585 | 1998 | 10819 | 11384 |
| 1964 | 4561 | 5585 | 1999 | 11148 | 11384 |
| 1965 | 4664 | 5585 | 2000 | 11510 | 11384 |
| 1966 | 4823 | 5585 | 2001 | 12043 | 11384 |
| 1967 | 4894 | 5585 | 2002 | 13160 | 11384 |
| 1968 | 6270 | 5585 | 2003 | 11152 | 11384 |
| 1969 | 5701 | 7518 | 2004 | 14984 | 11384 |
| 1970 | 5674 | 7518 | 2005 | 14172 | 19116 |
| 1971 | 7486 | 7518 | 2006 | 14709 | 19116 |
| 1972 | 5101 | 7518 | 2007 | 15097 | 19116 |
| 1973 | 6388 | 7518 | 2008 | 18955 | 19116 |
| 1974 | 5803 | 7518 | 2009 | 19731 | 17183 |
| 1975 | 5559 | 7518 | 2010 | 16720 | 17183 |
| 1976 | 7256 | 5585 | 2011 | 21726 | 19116 |
| 1977 | 6361 | 7518 | 2012 | 21759 | 24915 |
| 1978 | 5973 | 7518 | 2013 | 22258 | 24915 |
| 1979 | 6199 | 7518 | 2014 | 24260 | 24915 |
| 1980 | 5603 | 7518 | 2015 | 24172 | 24915 |
| 1981 | 6957 | 7518 | 2016 | 22567 | 24915 |
| 1982 | 6897 | 7518 | 2017 | 25900 | 24915 |
| 1983 | 6549 | 7518 | 2018 | 28753 | 26848 |
| 1984 | 7922 | 7518 | 2019 | 27715 | 26848 |
| 1985 | 8442 | 7518 | 2020 | 28766 | 26848 |
| MAPE | 25.86 | ||||
| RMSE | 1949.93 |
Table text extracted from the original PDF; superscript letters are shown inline. The original table image is below.
View original table image
| A1 → A1, A2 | A2 → A1, A2, A3 |
|---|---|
| A3 → A2, A3, A4 | A4 → A4, A5, A6 |
| A5 → A4, A5 | A6 → A6, A7 |
| A7 → A7 |
Table text extracted from the original PDF; superscript letters are shown inline. The original table image is below.
View original table image
Conclusion
This study attempted a fuzzy time series model for maize production data in India. The whole data was divided into seven fuzzy sets and from the 19 fuzzy logic relation seven fuzzy logic groups were obtained using union operator relationship. Chen's model has used arithmetic operations for forecasting. The actual and forecasted value is figured in Figure 1. Chen's fuzzy time series model is fitted, and its accuracy has been measured with Root Mean Square Error (1949.93) and Mean Absolute Percentage Error (25.86). The Chen model will give impetus to the higher-order fuzzy time series model for forecasting Kumar et al., [2019] [4] .