
Research article · 2019 · Full text
International Journal of Advanced Chemistry ResearchImpact of the eleme petrochemicals company on the levels of some physicochemical parameters and total petroleum hydrocarbons (TPH) in the soil from eleme
Volume 1(2) · Pages 01–04 · DOI: 10.33545/26646781.2019.v1.i2a.7 ↗
Research areasSpectroscopy and Chemometric Analyses
Abstract
Author-writtenThis study investigated the level of some physicochemical parameters (pH, electrical conductivity, % TOM, % TOC, % total nitrogen, % available phosphorous and particle size distribution) and total petroleum hydrocarbons (TPH) in Eleme soil. Samples were collected from six different locations. The physicochemical parameters were determined using standard analytical methods and the total petroleum hydrocarbons was done using gas chromatography equipped with FID. The results of physicochemical parameters were higher than the ones obtained by Eleme petrochemicals company EIA. The pH values of soils from the study area were moderately acidic; the electrical conductivity indicates a non-saline soil in the various locations. All the %TOC values were within the limit recommended by Brady for agricultural soils except in location 5 where a slightly higher value was obtained. The total nitrogen values varied from very low to high. The soils across the six locations showed a coarse textured soil. The value for available phosphorous varied from 0.119 – 0.200%. The levels of total petroleum hydrocarbon in some locations were within the DPR recommended limit of 50mg/kg while others were higher than the DPR limit.
Summary
Source-checkedPlain-language reading of the full paper, prepared with AI and checked against the text. Each point links to the authors' own words.
Why it matters
- Petrochemical plants can produce hazardous solid wastes and sludges containing heavy metals and toxic organics. View evidence ↗
- Industrial effluents from petrochemical sites may contain phenols, polycyclic aromatic hydrocarbons, and heavy metals, potentially harming ecosystems through toxic accumulation. View evidence ↗
- Indorama (Eleme) Petrochemicals limited in Nigeria produces various chemicals and fertilizers, generating significant amounts of daily effluent. View evidence ↗
The question
- The study aimed to investigate total petroleum hydrocarbons (TPH) and various physicochemical parameters in the soil of Eleme. View evidence ↗
What they did
- Soil samples were collected from six different locations at a depth of 0-30cm using a soil auger. View evidence ↗
- Standard analytical methods were used for physicochemical parameters, while gas chromatography with a flame ionization detector (FID) measured total petroleum hydrocarbons. View evidence ↗
What they found
- The soil pH ranged from 5.75 to 6.10, which indicates that the soil is moderately acidic. View evidence ↗
- Electrical conductivity ranged from 90 to 220 µs/cm (mean 132.5 ± 45.79µs/cm), indicating the soils are non-saline. View evidence ↗
- Total organic carbon ranged from 0.813% to 3.454%, with the highest value at location 5 remaining slightly below the recommended 3.5% limit. View evidence ↗
- Total nitrogen levels in the six soil samples ranged from 0.027% to 0.170%. View evidence ↗
- Available phosphorous concentrations in the soil ranged from 0.119 to 0.36 mg/kg. View evidence ↗
- The soils were coarse in texture, with mean particle size distributions of 80.67% sand, 29% clay, and 12% silt. View evidence ↗
- The mean total petroleum hydrocarbon (TPH) level was 68.677 ± 31.032 mg/kg, peaking at location 4 and reaching its minimum at location 6. View evidence ↗
- Soil at locations 2, 4, and 5 were contaminated with TPH, as their concentrations exceeded the Department of Petroleum Resources (DPR) limit of 50 mg/kg. View evidence ↗
What it means
- The authors conclude that TPH levels exceeding DPR limits indicate soil contamination, which may reduce agricultural productivity and negatively impact local livelihoods. View evidence ↗
- The authors recommend further research into the degree of soil pollution and increased monitoring of effluent treatment compliance by the company. View evidence ↗
Visual summary
2 visualsIllustrations explain the paper; charts are replotted from the paper's own table values.
Soil Contamination Assessment Flow
AI-generated conceptual illustration (Soil from an industrial petrochemical site). It explains the idea and does not show study data.
View source evidence ↗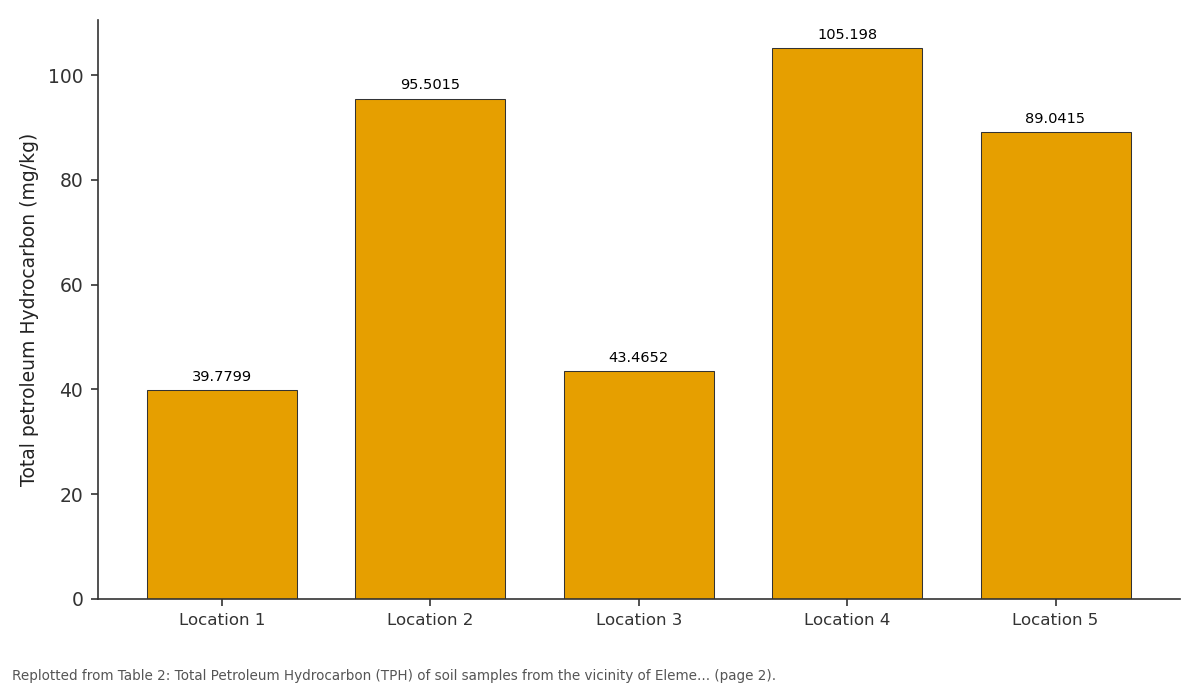
Total petroleum Hydrocarbon (mg/kg): Location 1 vs Location 2 vs Location 3 vs Location 4 vs Location 5
Replotted from Table 2 (page 2) of the original paper. Every bar is the paper's own table value.
View source evidence ↗Figures & tables
From the original paper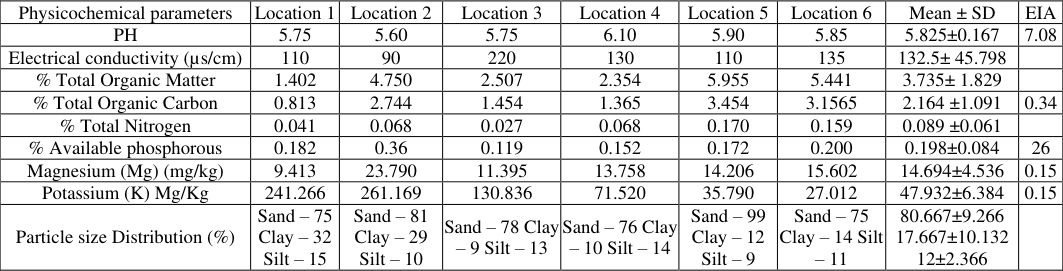 Table 1
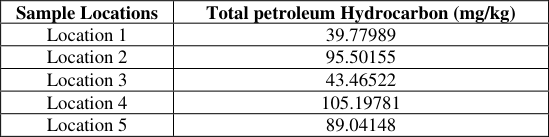 Table 2
Introduction
The petrochemical industry has been of great benefit to human life and is providing the major basic needs of rapidly growing, expanding and highly technical civilization as source of energy for domestic, industrial, transport sectors and as feedstock for fertilizers, synthetic fibers, synthetic rubbers, polymers, intermediates, explosives, agrochemicals, dye and paints due to these enormous benefits, we rely so greatly on these products from the petrochemical industries for our day to day life. However environmental issues have now become important consideration because Petrochemical plants generate solid wastes and sludges, some of which may be considered hazardous because of the presence of toxic organics and heavy metals [22] . Accidental discharges due to abnormal operation, especially from polyethylene and ethylene oxide-glycol plants in a petrochemical industry, can be a serious environmental hazard, releasing large quantities of pollutants and products into the environment [5] . Effluent from petrochemical industries contains large quantities of heavy metals, polycyclic aromatic hydrocarbons, phenols and other chemicals. Effluent may be a serious environmental problem that can lead to the accumulation of toxic substances in the receiving water which can have a negative effect on the ecosystem [22] . Indorama (Eleme) Petrochemicals limited is a Nigerian based provider of fertilizer, olefins, butene, polyethylene and polypropylene, the company generates large quantities of effluents daily. These effluents are discharged into natural water bodies after treatment. Though, the compositions of the effluents are regulated by various laws, it is not known whether they comply with the legally accepted toxicant levels for refineries and petrochemical plants in Nigeria.
A research carried out by Nwineewii and Ibok [19] to investigate the impact of Eleme Petrochemicals Company on the level of some physicochemical parameters in soil revealed that the results found were out of range when compared with the impact assessment study carried by the Eleme Petrochemicals company in 1992 indicating that the operations and construction within the company may have been responsible for it. Also, Ambo et al. [3] investigated the level of heavy metals and P H in the surface Soil from Eleme and other oil producing areas, it was found out that the percentage of heavy metals obtained at Eleme was higher than those obtained from other areas probably due to the presence of the Petrochemicals and other oil producing companies at Eleme.
Study Location
Eleme Petrochemicals complex site is spatially approximately between l0km North-East of Port Harcourt, the capital city of Rivers State of Nigeria and 40km South-West of the largest commercial Town, Aba in Abia State. The Port Harcourt township is located on the South-East Flank of Niger Delta on the edge of the dry main land which is contiguous with the site of the Petrochemicals Company and occupies about 4,200 hectares of land in the vicinity of the villages of Akpajo, Aleto and Agbonchia in Eleme, Eleme Local Government Area of Rivers State on the Port Harcourt-Bori segment of the East-West road [9] .
Sampling procedure
Soil samples were collected from six locations around the vicinity of the Eleme Petrochemicals Company. The distance between
International Journal of Advanced Chemistry Research
each sampling point was at least 300m apart. The sample points were drilled with soil auger from the top soil to the depth of 30cm (0-30cm) and hand trowel was used to scoop the soil samples and transferred into already well-labeled polythene bags, after which they were taken to the laboratory for analysis Total Petroleum Hydrocarbons Determination 2.0g each of the ground soil samples was weighed into an extracting vessel. Enough sodium sulphate was added in other to remove the water molecule with a continuous stirring. This was followed by the addition of 25ml Dichloromethane (DCM) to extract the hydrocarbons content from the soil i.e. (extraction solvent). According to Imeh [12] , DCM proved to be the most suitable solvent over hexane, acetone and toluene for this extraction due to its consistency, efficiency and ability of not interfering with BTEX. This was followed by the addition of Silica gel to remove the debris from the sample. The sample was left for 45mins before filtering. The sample was poured into a separating funnel with a filter paper, a cotton wool, sodium sulphate (Na 2 SO 4 ) and silica gel. The filtered sample was passed through a chromatographic column which is made up of cotton wool, sodium sulphate and silica gel and then was collected in the vial. To concentrate the content in the vial, it was passed through ambient air. After this, 10µL of the extracting solvent was injected to mix the sample solution in the vail. Finally, 2ml of the sample solution was introduced into the injection port of the G. C through the Septum and was separated into its different components Determination of pH 20g of soil sample was weighed into a 100ml beaker and 40ml of distilled water was added to it. The solution was stirred at a regular interval for 30 minutes. A pH meter was immersed into the solution and the reading was recorded.
Determination of Electrical Conductivity
20g of soil sample was weighed into a beaker, 50ml of distilled water was added. The mixture was stirred with glass rod for 10 minutes and was allowed for 30 minutes without any disturbance. The electrical conductivity was measured by immersing a conductivity meter into the solution and the reading was recorded in µs/cm.
Determination of % Total Organic Carbon
The organic carbon content of the soil samples was determined by titrimetric method of walkley and Black. 1g of finely ground soil sample was passed through 0.5mm sieve and taken into 500ml conical flask, 10ml of potassium dichromate and 20ml sulfuric acid were added. The contents were shaken for a minute and allowed to stand for 30 minutes. 200ml of distilled water, 10ml of orthophosphoric acid and 2ml diphenylamine indicator were added. The solution was titrated against ammonium ferrous sulfate until the colour flashes from purple to green and the reading was noted for calculation. The blank titration was carried at the beginning without soil. The results were calculated using the formula;
Determination of % Total Organic Matter
A conversion factor of 1.724 was used to convert organic carbon to organic matter.
Determination of particle size distribution
Particle size distribution was determined by hydrometric method Determination of % phosphorous: % phosphorous was determined by direct reading with Hach DR 3900
Results and Discussion
The results of the physicochemical parameters and total petroleum hydrocarbons (TPH) obtained from the soil samples are shown in table 1 and 2 below.
| Physicochemical parameters | Location 1 | Location 2 | Location 3 | Location 4 | Location 5 | Location 6 | Mean ± SD | EIA |
|---|---|---|---|---|---|---|---|---|
| PH | 5.75 | 5.60 | 5.75 | 6.10 | 5.90 | 5.85 | 5.825±0.167 | 7.08 |
| Electrical conductivity (µs/cm) | 110 | 90 | 220 | 130 | 110 | 135 | 132.5± 45.798 | |
| % Total Organic Matter | 1.402 | 4.750 | 2.507 | 2.354 | 5.955 | 5.441 | 3.735± 1.829 | |
| % Total Organic Carbon | 0.813 | 2.744 | 1.454 | 1.365 | 3.454 | 3.1565 | 2.164 ±1.091 | 0.34 |
| % Total Nitrogen | 0.041 | 0.068 | 0.027 | 0.068 | 0.170 | 0.159 | 0.089 ±0.061 | |
| % Available phosphorous | 0.182 | 0.36 | 0.119 | 0.152 | 0.172 | 0.200 | 0.198±0.084 | 26 |
| Magnesium (Mg) (mg/kg) | 9.413 | 23.790 | 11.395 | 13.758 | 14.206 | 15.602 | 14.694±4.536 | 0.15 |
| Potassium (K) Mg/Kg | 241.266 | 261.169 | 130.836 | 71.520 | 35.790 | 27.012 | 47.932±6.384 | 0.15 |
| Particle size Distribution (%) | Sand – 75 Clay – 32 Silt – 15 | Sand – 81 Clay – 29 Silt – 10 | Sand – 78 Clay – 9 Silt – 13 | Sand – 76 Clay – 10 Silt – 14 | Sand – 99 Clay – 12 Silt – 9 | Sand – 75 Clay – 14 Silt – 11 | 80.667±9.266 17.667±10.132 12±2.366 |
Table text extracted from the original PDF; superscript letters are shown inline. The original table image is below.
View original table image
Soil P H
The soil pH obtained from the study ranged from 5.75 to 6.10 indicating moderately acidic soil. This observation corroborates the findings by Inuwa et al. [15] but contradicts the alkaline range of 7.64 to 8.10 reported by Ini and Charles [14] in soil from Alesa Eleme. Soil pH can affect plants growth through its effects on nutrient availability. Low or high soil pH causes deficiency in essential nutrients needed by plants for its growth. Soil pH is important because it influences the availability of essential nutrients. Most horticultural crops will grow better in soils having a pH between 6 and 7.5 [14] . However, for plants, a soil pH below 6.0 is considerable [16] . Eleme petrochemical company EIA (1992) recorded a pH of 7.08.
Electrical Conductivity
The electrical conductivity values ranged from 90 to 220 µs/cm with a mean of 132.5 ± 45.79µs/cm. This range of values indicates that the soils across the six samples locations are nonsaline as all the values are below 4000µs/cm [18] and do not exceed the critical value of 2000µs/cm for sensitive crop species. Similar results were reported by other researchers [8,21] . However, these results are in contrast with the ones obtained by Badmus et al. [4] and Obasi et al. [20] , they reported higher values that ranged from 5030-6080µs/cm and 1379 to 3120µs/cm respectively. Electrical conductivity is an indication of the availability of nutrients in the soil and low electrical conductivity levels indicate low availability of nutrients in the soil which will affect plants growth drastically, while high electrical conductivity of soil is an indication of higher significant presence of ions [10] .
Total Organic Carbon and Matter
In this study, a conversion factor of 1.724 was used to convert organic carbon to organic matter. The results ranged from 0.813 to 3.454% for total organic carbon and 1.402 to 5.95%. The highest value of 3.454% was observed for organic carbon in location 5 and it is slightly below the limit of 3.5% recommended for organic carbon in soil by Brady [6] . This result is consistent with reports by Ini and Charles [14] who reported a TOC range of 0.6 to 3.4% in soil samples from Eleme. However, the result was far below reports by Edori and Iyama [8] who reported a TOC range of 12.69 to 16.79% in soil sample from Port Harcourt. The values of total organic carbon in all the six sampling locations were higher than that of the Eleme Petrochemicals EIA, 1992. The amount of total organic matter in soil determines the nutrients content and any other changes that will alter the quantity and quality of soil fertility [8] . Organic matter provides nutrients and habitat to organisms living in the soil, also binds soil particles into aggregates and improves the water holding capacity of soil.
% Total Nitrogen
The total nitrogen values ranged from 0.027 to 0.170% for the six different soil samples analyzed. Horneck et al. [11] classified soil total nitrogen as; very low <0.5, low 0.05 to 0.15, medium 0.15 to 0.25, high 0.25 to 0.50, very high >0.5. The values obtained in this work are comparatively higher than the values reported by other scholars. [23,24,13] .
Nitrogen is very essential for all living things as it is an essential component of protein such as DNA, RNA, and vitamins as well as hormones and enzymes [11] .
Available Phosphorous
The values for the concentration of available phosphorous ranged from 0.119 to 0.36mg/kg. This range of available phosphorous correlates with work reported for Eleme soil by Ini and Charles [14] but higher when compared to reports by other scholars [23,24] . Available phosphorous is an essential nutrient in soil fertility because of its fixation and transformation in the soil system [18] . Deficiency of phosphorous in soil may cause plant leaves to develop purple coloration, stunted plant growth and decay in plant development while excess of it may cause micronutrient deficiency especially iron and zinc [24] .
Particle Size Distribution
The soil particle size distribution had the mean values of 80.67%, 29% and 12% for sand, clay and silt respectively. Sand has the highest fraction followed by clay and then silt. This is consistent with reports from other studies [21,14] and it has been reported to be the characteristic of the soils found in the Niger Delta region [23] . The proportion of sand, clay and silt found in this study suggested that the soils were coarse in texture. Coarse textured sandy soils usually have low supply of nutrient and moisture but provide physical support to plant.
Total Petroleum Hydrocarbon
The results of the levels of total petroleum hydrocarbon (TPH) from the six sample locations are given in table 2. The mean value of TPH as presented in table 2 is 68.677 ± 31.032mg/kg with the highest concentration at location 4 and the lowest concentration at location 6. The results indicate that location 2, 4 and 5 of the soil samples studied were contaminated with total petroleum hydrocarbon in view of the high concentration obtained at these locations when compared to the 50mg/kg limit recommend by Department of Petroleum Resources [7] . The levels of total petroleum hydrocarbon recorded in this study are lower than TPH on of soil samples conducted by other scholars [1,17,12,2] near a petrochemical complex who recorded high total petroleum hydrocarbon within the range of 1179.3 to 6354.9mg/kg. Petroleum hydrocarbons can impact soil ecosystems sufficiently to result in significant losses in soil quality [17] . Study of contaminated soils have demonstrated that elevated loadings of these contaminations can result in diminished microbial biomass, reduced viable bacterial population densities, inhibition of organic matter mineralization as well as decreased leaf litter decomposition [1] .
| Sample Locations | Total petroleum Hydrocarbon (mg/kg) |
|---|---|
| Location 1 | 39.77989 |
| Location 2 | 95.50155 |
| Location 3 | 43.46522 |
| Location 4 | 105.19781 |
| Location 5 | 89.04148 |
Table text extracted from the original PDF; superscript letters are shown inline. The original table image is below.
View original table image
Conclusion
This study was conducted to determine the impact of Eleme petrochemicals-company on the levels of some physicochemical parameters and total petroleum hydrocarbons in soil within the company's environment. The result revealed that the levels of the physicochemical parameters were in contrast with the values recorded by the Eleme petrochemicals company EIA (1992). The level of total petroleum hydrocarbons in some locations were above the recommended limit set by DPR. This implies that the soil is contaminated which can lead to low agricultural productivity and poor means of livelihood for the inhabitants of this area. The study recommends that further studies be conducted on the degree of pollution of Eleme soil and appropriate monitoring by relevant environmental agencies to ensure strict compliance in the treatment of effluent by Eleme petrochemicals Company before discharge.
References
24 in the original paper- Adeniyi AA, Afolabi JA. Determination of total petroleum hydrocarbons and heavy metals in soils within the vicinity of facilities handling refined petroleum products in Lagos metropolis. Environment International. 2001; 28(1-2):7982.
- Alinnor IJ, Nwachukwu MA. Determination of total petroleum hydrocarbon in Soil and groundwater samples in some communities in Rivers State, Nigeria. Journal of Environmental Chemical and Ecotoxicology. 2013; 5(11):292-297.
- Ambo AI, Saleh SA, Igboanusi P, Iyakwari SS. Chemical composition analysis of soil from selected oil producing communities in the Niger Delta region of Nigeria. International Journal of Basic and Applied Chemical Sciences. 2013; 3(1):84-92.
- Badmus BS, Ozebo VC, Idowu OA, Ganiyu SA, Olurin OT. Physicochemical properties of soil samples and dumpsite environmental impact on groundwater quality in South Western Nigeria. The African Review of Physics. 2014; 9(15):107-111.
- Beg MU, Al-Muziaini S, Saeed T, Jacob PG, Beg KR, AlBahloul M, Al-Matrouk K, Al-Obaid T, Kurian A. Archives environmental contamination and toxicity. 2001; 41:289297.
- Brady NC, Weil RR. The Nature and Properties of Soils. Eleventh Edition, Prentice-Hall, Upper Saddle River, New York, 1996.
- DPR. Environmental guidelines and standard for the petroleum industry in Nigeria. Nigeria: Department of Petroleum Resources, Ministry of Petroleum Resources, 1991.
- Edori OS, Iyama WA. Assessment of physicochemical parameters of soils from selected abattoirs in Port Harcourt, Rivers State, Nigeria. Journal of Environmental Analytical Chemistry. 2017; 4(3):2-4.
- EIA. Eleme Petrochemical Environmental Impact Assessment, 1992.
- Funtua MA, Jimoh A, Agbaji EB, Ajibola VO. Evaluation of heavy metals level of soil in old Panteka Market area of Kaduna, Nigeria. Journal of pure and applied sciences. 2017; 10(1):100-107.
- Horneck DJ, Hart R, Stevens S, Petrie JA. Acidifying Soil for Crop Production West of the Cascade Mountains (Western Oregon and Washington), 2004.
- Imeh JO, Clement EB, Fiokedu SO. Chemometric determination of chemical and physical assortment of total hydrocarbons within crude oil spilled soil. International Research Journal of Natural Sciences. 2013; 1(2):23-33.
- Inah EO, Chima OO. The impacts of crude oil exploitation on soil in some parts of Ogoni Region, Rivers State, Southern Nigeria. Open Access Library Journal. 2018; 5(7):1-20.
- Ini UU, Charles O. Petroleum hydrocarbon contamination of soil at a commercial trailer truck parking facility at Alesa Eleme, Rivers State, Nigeria. Journal of Applied Research. 2018; 4(3):1483-1493.
- Inuwa M, Abdulrahman FW, Bimin-Yauri UA, Ibrahim SA. Analytical assessment of some trace metals in soils around the major industrial Areas of Northern Nigeria. Trend Appl. Sci. Res. 2007; 2(6):515-521.
- Jauron R. Horticulture. The Meaning and Importance of Soil pH. IOWA State University. Extension and Outreach, 2002.
- Li JH, Lu Y, Yin W, Gan HH, Zhang C, Deng XL, Lian J. Distribution of heavy metals in agricultural soils near a petrochemical complex in Guangzhou, China. Environmental Monitoring and Assessment. 2009; 5(3):2-4.
- Miller RW, Donahue RL. Soils in Our Environment. Prentice-Hall, London, 1992.
- Nwineewii JD, Ibok UJ. The Eleme petrochemicals company and its impact on the levels of some physicochemical parameters from Eleme Creeks, Port Harcourt, Rivers State, Nigeria: 10SR Journal of Environmental Science, Toxicology and Food technology. 2014; 8(1):48-24.
- Obasi NA, Akubugwo EI, Ugbogu OC, Otuchristian G. Assessment of physicochemical properties and heavy metals bioavailability in dumpsites along EnuguPort Harcourt expressway, South East, Nigeria. Asian Journal of Applied Science. 2012; 5:342-356.
- Obianefo FU, Agbagwa IO, Tanee FBG. Physicochemical characteristics of soil from selected solid waste dump sites in Port Harcourt, Rivers State, Nigeria. Journal of applied science and environmental management. 2017; 21(6):11531156.
- Obot IB, Israel AU, Umoren SA, Mkpenie V, Ebong GA. Effluents and solid waste analysis in a petrochemical company-A case study of Eleme petrochemicals company Ltd, Port Harcourt, Nigeria. E-Journal of chemistry. 2008; 5(10):74-80.
- Osakwe SA. Effect of cassava processing mill effluent on physical and chemical properties of soils in Abraka and environs, Delta State, Nigeria. Chemistry and Material Research. 2014; 2(7):27-39.
- Umeri C, Moseri H, Onyemekonwu RC. Effects of nitrogen and phosphorus on the growth performance of maize (Zea mays) in selected soils of Delta State, Nigeria. Advances in Crop Science and technology. 2017; 4(1):1-4.