
Research article · 2020 · Full text
International Journal of Advanced Chemistry ResearchPhysico-chemical analysis of different water sources in Gidan Igwai area, Sokoto, Sokoto State, Nigeria
Volume 2(2) · Pages 48–52 · DOI: 10.33545/26646781.2020.v2.i2a.62 ↗
Research areasWater Quality and Pollution Assessment
Abstract
Author-writtenPhysicochemical characteristic is a very vital water quality monitoring parameters due to their instability once water is extracted from its source. The addition of various kinds of pollutants and nutrients through sewage, industrial effluents, agricultural runoff etc. into the water bodies brings about a series of changes in the physicochemical biological characteristic of water, which have been the subject of several investigations. This research work focused on the levels of physico-chemical parameters such as pH, conductivity, dissolve oxygen, carbonates, bicarbonates calcium, magnesium, chloride, phosphates, and nitrates content in the natural water samples collected from Gidan igwai Area Sokoto, Sokoto State. The mean results showed that : pH(6.3±0.17 -7.0±0.69),Electrical conductivity (77.80.2±0.06 - 4510.2±5.77µscm1),Dissolve Oxygen (4.67.0±0.92-5.87±1.04 mg/l ),Carbonates (0.2±0.06 -0.2±0.06 mg/l), bicarbonates (16±3.46 -116±9.24 mg/l),Calcium (30±2.89 -72±2.31 mg/l ),Magnesium (25.2±0.12- 67.2±0.12 mg/l), Chloride (2.0±0.58-8.2±0.12 mg/l), Nitrates (2.4±0.23- 3.0±1.15 mg/l) Phosphate (0.19±0.05 - 0.21±0.11 mg/l.). All the measured parameters were found to be within the WHO standards for drinking water.
Summary
Source-checkedPlain-language reading of the full paper, prepared with AI and checked against the text. Each point links to the authors' own words.
Why it matters
- Water is a fundamental necessity for life, serving as a universal solvent used in domestic, agricultural, and industrial activities. View evidence ↗
- Water sources can become contaminated through rock leaching or the runoff of industrial and agrochemical discharges, particularly during rainy seasons. View evidence ↗
- Access to clean and safe drinking water is a significant challenge for the community in the Gidan Igwai Area of Sokoto, Nigeria. View evidence ↗
The question
- The study aimed to analyze the physicochemical parameters of borehole, river, and underground water sources in the Gidan Igwai Area of Sokoto, Nigeria. View evidence ↗
What they did
- Water samples from borehole, river, and underground sources were collected between February and April 2021 in 4-liter gallons and preserved with 2M HNO3. View evidence ↗
- The researchers used a Techmel pH meter for pH determination and a model 4200 TDS/conductivity meter for electrical conductivity (EC). View evidence ↗
- Total hardness was measured using the EDTA titration method with an Erichrome Black-T indicator. View evidence ↗
What they found
- The mean pH of the water sources ranged from 6.3±0.17 to 7.0±0.69, with borehole water (Sample A) being neutral at 7.0±0.69. View evidence ↗
- Calcium concentrations ranged from 30±2.89 mg/L (river water) to 72±2.31 mg/L (borehole water). View evidence ↗
- Magnesium levels were lowest in river water (25.2±0.12 mg/L) and highest in borehole water (67.2±0.12 mg/L). View evidence ↗
- Chloride ion concentrations ranged from 2.0±0.58 mg/L in river water to 8.2±0.12 mg/L in underground water. View evidence ↗
- Nitrate levels in the samples ranged from 2.4±0.23 to 3.0±1.15 mg/L. View evidence ↗
- Phosphate ion concentrations were found to be between 0.19±0.05 and 0.21±0.11 mg/L. View evidence ↗
What it means
- The authors concluded that most parameters across all three water sources fell within WHO standards, with the exception of pH in river water and dissolved oxygen in river and underground water. View evidence ↗
- The authors state that heavy metal concentrations were not determined in this study and will be the focus of future research. View evidence ↗
Visual summary
3 visualsIllustrations explain the paper; charts are replotted from the paper's own table values.
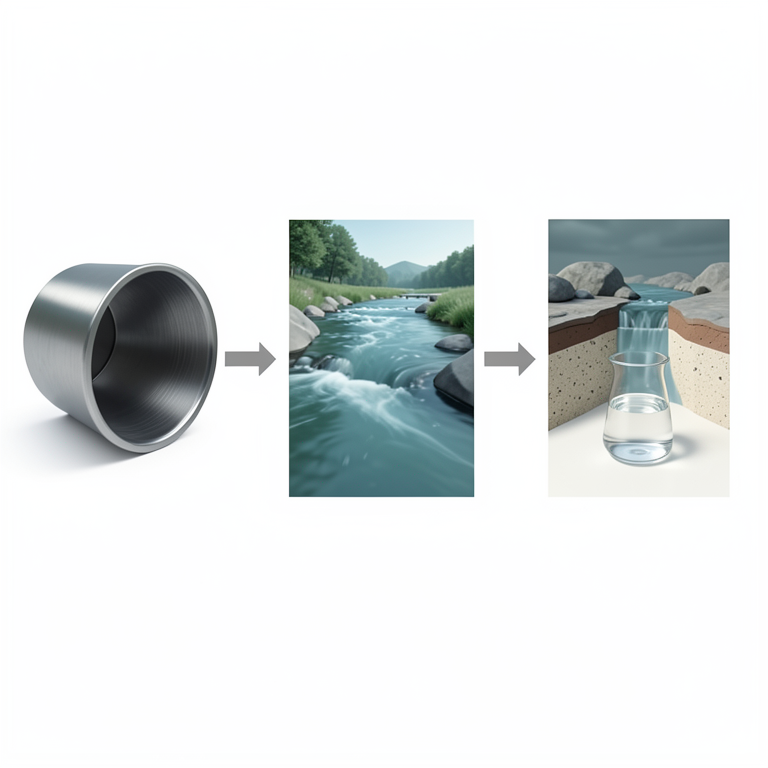
Water Sampling Sources
AI-generated conceptual illustration (Borehole, river, and underground aquifer water sources). It explains the idea and does not show study data.
View source evidence ↗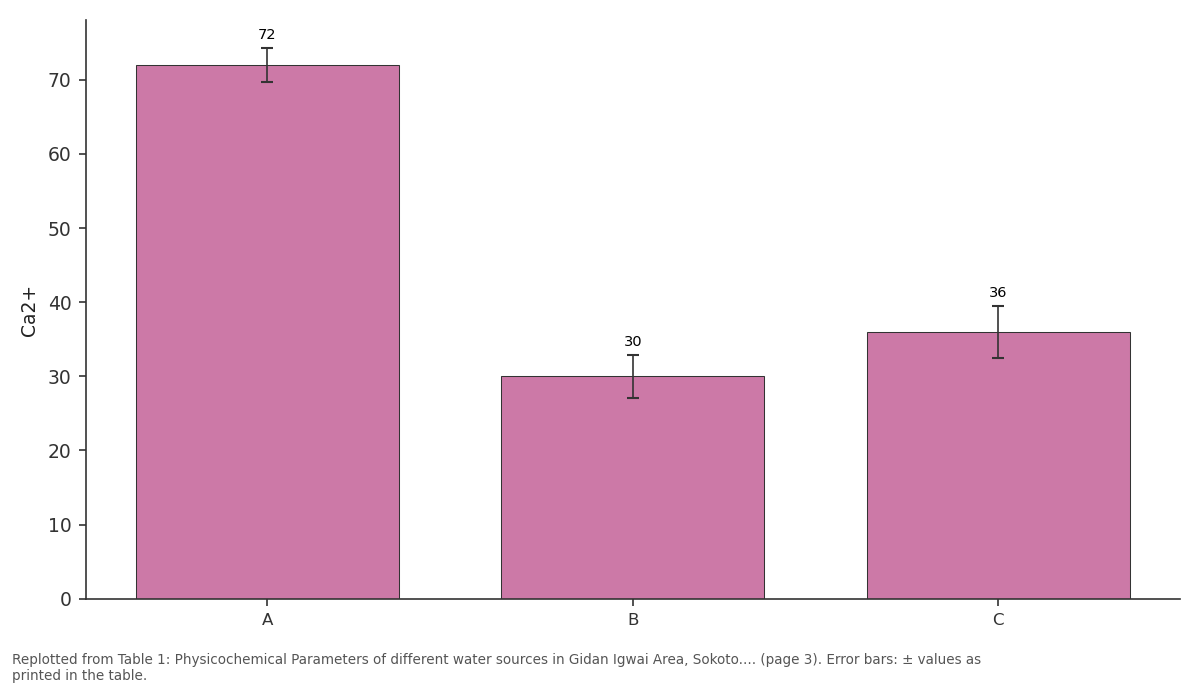
Ca2+: A vs B vs C
Replotted from Table 1 (page 3) of the original paper. Every bar is the paper's own table value.
View source evidence ↗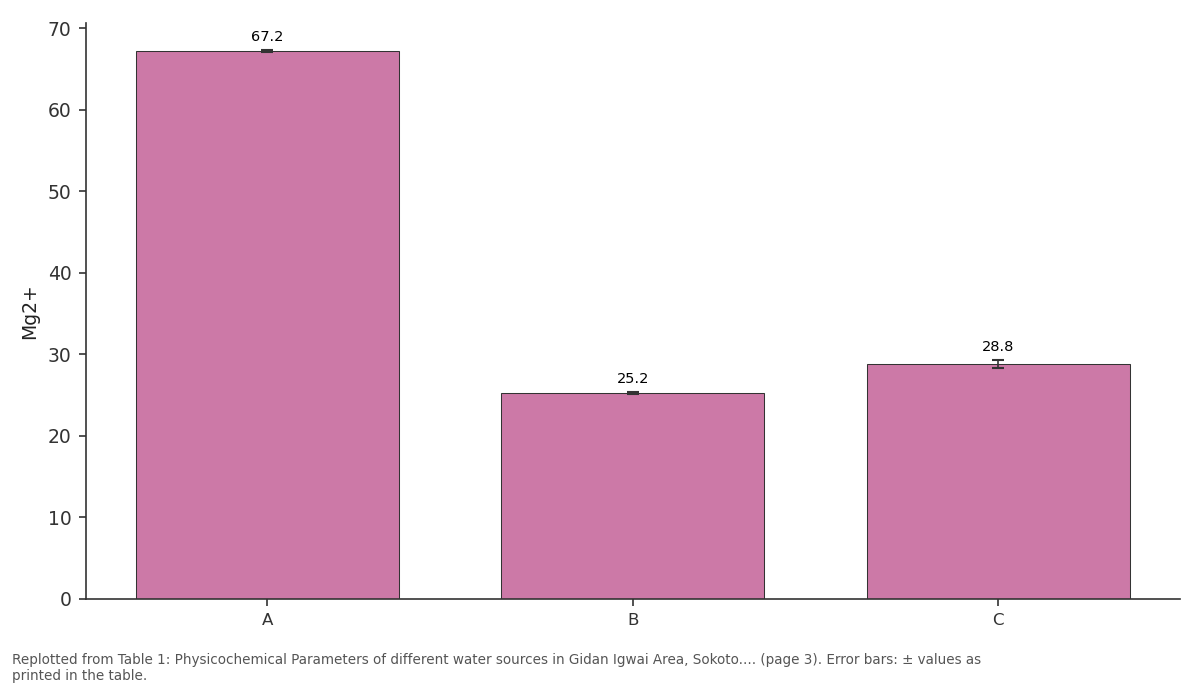
Mg2+: A vs B vs C
Replotted from Table 1 (page 3) of the original paper. Every bar is the paper's own table value.
View source evidence ↗Figures & tables
From the original paper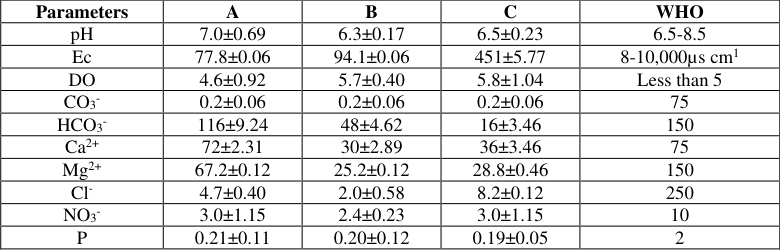 Table 1
Introduction
Water is an essential component of life and is regarded as a universal solvent. It is used for washing, cooking, agricultural and even for industrial activities. Water could be obtained from ground water and surface sources [13] . The groundwater sources include boreholes and hand dug wells while surface water sources include rivers, streams, and lakes. No matter the source of water, it is consumed and used on a day to day basis [15] . However, water sources are often contaminated. Contamination of water sources can emerge from leaching of rocks, industrial and agrochemical discharges that are washed into them especially during the rainy season [19] . These contaminations can affect the clarity and the chemical constituents of the water source. Essentially, they can distort the quality of the water and even add odour thereby impacting negatively on economic activities [17] . Clean water must comply with certain physical and chemical standards, which are designed as standards for good quality water. Good quality water for drinking is free from disease producing microorganisms and chemical substances deleterious to health. Water is grouped into marine and fresh water based on the concentration of salt. Marine water has high salt content, while fresh water is free or less salt content [15] . Fresh water resource is one of the major components of environmental resources that are under threat either from over exploitation or pollution, exacerbated by human activities on the earth's surface. Many developing regions suffer from either chronic shortages of fresh water or the pollution of readily accessible water resources [7] . According to [11] report, about 800 million people in Asia and Africa are living without access to safe drinking water. Consequently, this has caused many people to suffer from various water related diseases [8] . The provision of clean and safe drinking water is one of the major problems in community of Gidan Igwai Area Sokoto, Nigeria. Therefore, examination of the quality of the source of water in this community is necessary since water from these sources is used for domestic purpose in their raw state. Physicochemical characteristic is very vital water quality monitoring parameters due to their instability once water is extracted from its source. The addition of various kinds of pollutants and nutrients through sewage, industrial effluents, agricultural runoff etc. Into the water bodies brings about a series of changes in the physicochemical biological characteristic of water, which have been the subject of several investigations [5,18,12] . Cheng et al. (2018) studied the physico-chemical properties of river water in Phenom Penh and its suburban area and revealed that the mean DO concentration of the four rivers is in this increasing order Tonle Sap < Bassac < Lower Mekong < Upper Mekong. The mean pH of the Tonle Sap and Bassac were below the minimum regulation limit of pH (6.5 to 8.5) of WHO's drinking water guideline. The main rivers of Phnom Penh have lower pH, EC and TDS than rivers in other countries. Concurrently, DO concentrations in Cambodian rivers are lower than rivers in China, Korea and Nigeria. Nnamani et al. (2011) evaluated the physicochemical parameters of ISU and Calabar rivers in ebonyi State, Nigeria and compared to standard (WHO standard for drinking water). The result obtained showed; pH (6.5-6.8), turbidity (2.8-3.2 NTU), conductivity (120-160µs/cm), alkalinity (5.93-7.32 mg/l), TS (0.23-0.30mg/l), TDS (0.10-0.19 mg/l), TSS (0.09-0.13 mg/l), CI(0.14-0.18mg/l), SO 4 (0.25-0.32 mg/l), Nitrate (0.288-0.440 mg/l), phosphate (0.033-0.227 mg/l). These measured parameters conformed to the WHO drinking standard while parameter like Turbidity of ISU river with values from 5.98 to 5.93mg/l, was relatively above/higher that the WHO standard for drinking water. This present study is aimed at analysing physico-chemical parameters of different water Sources (Borehole Water, River Water and Underground Water) in Gidan Igwai Area, Sokoto, Nigeria.
Materials and Methods
Materials and Methods
Study Area
Sokoto State is located between latitude 13.005873 and longitude 5.247552. Sokoto is a large city in northwest Nigeria, near the rivers of Sokoto and Rima. The population of the city is approaching to a half million, and it is one of the most modern and advanced cities of the country, with high quality life and various cultural and social activities taking place there on a regular basis. Over 80 per cent of the local population is Muslim. Gidan Igwai Area being a town in Sokoto North local Government Area of Sokoto State is located between latitude 13°04'17.2"N (13.0714400°) and longitude 5°12'28.6"E (5.2079400°) .The city's economy relies on agriculture and manufacturing in its economic activities. The raining season is usually between July and October; however, rain sometimes starts in April or May. During the raining season, most farmers favour harvesting their crops, planting crops and repairing the farm.
Sample Collection and Preparation
Water samples were collected on February, March and April 2021, from Gidan Igwai Area located between latitude 13°04'17.2"N (13.0714400°) and longitude 5°12'28.6"E (5.2079400°) . The samples were collected from the same site of Gidan Igwai Area. They are represented with letter A, B and C respectively. Water from borehole, River and underground sources were collected in a 4 litre gallon each and preserved with 2M HNO 3 to prevent it against bacteria attack. 100ml of the sample was measured into a 250ml beaker. 5ml of 1:1 HCI was added and the beaker was placed on a steam bath and allowed to stand for 30minutes. The solution was filtered through a whatman No 1 filter paper into 100ml volumetric flask and the solution made up to mark with distilled water and then analysed.
Method Determination of pH
The pH was determined using a standard Techmel pH meter. 50ml of the sample was measured into a 100ml beaker and the pH electrode was dipped into the solution. The measurement was recorded.
Electrical Conductivity
EC was measured using combined TDS/conductivity meter model 4200 by shifting one of the four buttons of instrument. Before measuring, the probes were rinsed with distil water and purity of distil water was checked. Then the probe was immersed in beaker containing water sample and moved up and down taped on the beaker to be free the electrodes from any bubbles. Then data was recorded for each sample.
Alkalinity for carbonates determination
To each 50 ml of the water samples, 3 drops of phenolphthalein indicator was added. The sample was titrated with 0.02N H 2 SO 4 to pH 8.3 and phenolphthalein alkalinity was estimated (phenolphthalein indicator changed colour from pink to colourless at pH 8.3). Finally the phenolphthalein alkalinity of water was calculated as follows, Phenolphthalein alkalinity (mg/L) as Where A = volume of H 2 SO 4 in ml, N = normality of H 2 SO 4 used to titrate, V = volume of sample used in ml Alkalinity for bicarbonates determination: Three drops of bromocresol green indicator was added to 50 mL of each the samples and titrated with 0.02 N H 2 SO 4 to pH 4.5 and total alkalinity was estimated (bromocresol green indicator was changed the colour from blue to yellow at pH 4.5). Amount of acid used at this moment starting phenolphthalein was used to react with hydroxide, carbonate and bicarbonate and it was constituted of total alkalinity. Finally total alkalinity was calculated as follows. Total alkalinity (mg/L) (as CaCO Determination of phosphate ion 50cm 3 of water sample was pipette into a 500cm 3 volumetric flask, 5cm 3 of Ammonium molybdate solution and 3.0cm 3 of ascorbic acid were added with swirling, the mixture was diluted to the mark with deionised water and was allowed to stand for 30 minutes for maximum colour development, the absorbance was then read at 660nm including the blank. The procedure was applied for the remaining samples.
Determination of Nitrate ion
10cm³ of the water sample was pipette into a 50cm³ volumetric flask. 10cm 3 of 13N sulphuric acid was added and mixed with swirling, the flask was allowed to come to a thermal equilibrium in cold water bath (0 -10)⁰C. 0.5cm³ of brocinesulfanilic acid was added and diluted to the mark with deionised water, the solution was then placed on the 100 0 C hot water bath for about 25 minutes for maximum colour development, the flask was then cooled to room temperature. The absorbance was read at 410nm including the blank. This procedure was repeated on the other samples.
Determination of calcium and Magnesium
Total hardness was determined by EDTA method. This was done by titrating 100mL of sample in a conical flask and adding 1mL of buffer solution with Erichrome Black-T indicator against standard EDTA (Ethylene diamine tetra acetic acid). The solution was changed from wine blue at the end point.
Total hardness (as CaCO 3 ), (mg/L) = Calcium hardness was determined by the same procedure as total hardness. Taking 50mL sample in a conical flask with 2ml of NaOH solution of 1N was titrated against EDTA solution using murexide indicator. At the end point, pink colour changed to purple. Calcium, mg/L (as CaCO 3 ) = Magnesium hardness Magnesium salts occur in significant concentration in natural waters which may be calculated as the difference between total hardness and calcium hardness.
Magnesium hardness, mg/L (as CaCO 3 ) = Total hardness -Calcium hardness.
Determination of Dissolved Oxygen
A specialized 300ml BOD bottles designed to allow full filling with no air space and provide an airtight seal were used. The bottles were filled with the sample to be tested .At least one bottle was filled with water (Distilled or deionised) as a control or blank. A DO meter is used to measure the initial dissolve oxygen concentration in each bottle. Each bottle is then placed into a dark incubator at 20⁰C for five days. After five days (+3 hours) the DO meter is used again to measure a final dissolved oxygen concentration.
Results and discussion
The mean values of different selected physicochemical parameters are tabulated in Tables 1.
Discussion pH:
The result of this study indicates that the different water sources for drinking in Gidan Igwai Area are acidic and the mean pH ranged from 6.3±0.17 to 7.0±0.69. The pH of the water sources is in this increasing order A C B .Sample A is neutral (pH 7.0±0.69). Thus, the pH of all the water samples analysed are within the [11] recommended pH values of 6.5 to 8, except B that is below WHO standards, the variation might be attributed to the introduction of sewages of humans and animals into the river wate because of the open nature of the water source. Sample A is the safest water to drink. Electrical Conductivity: The electrical Conductivity as presented in Table 1 showed that the mean value for the water samples ranged from 77.80.2±0.06 to 4510.2±5.77µscm 1 , The conductivity of the water sources is in this increasing order A B C, with sample A having the minimum mean value and Sample C with maximum mean value. The presence of a slightly high value of electrical conductivity in the water samples showed that contaminations due to dissolve ions are low, because electrical conductivity is directly proportional to the total dissolved solids. This may be due to the soil type and geology of the study area or the wastes entering from the surrounding to water sources. These values were found to be below the [11] permissible limit of 8-10,000µs cm 1 .The results for all the samples were also found to be in contrast with previous reports by [17,2] .
| Parameters | A | B | C | WHO |
|---|---|---|---|---|
| pH | 7.0±0.69 | 6.3±0.17 | 6.5±0.23 | 6.5-8.5 |
| Ec | 77.8±0.06 | 94.1±0.06 | 451±5.77 | 8-10,000µs cm1 |
| DO | 4.6±0.92 | 5.7±0.40 | 5.8±1.04 | Less than 5 |
| CO3- | 0.2±0.06 | 0.2±0.06 | 0.2±0.06 | 75 |
| HCO3- | 116±9.24 | 48±4.62 | 16±3.46 | 150 |
| Ca2+ | 72±2.31 | 30±2.89 | 36±3.46 | 75 |
| Mg2+ | 67.2±0.12 | 25.2±0.12 | 28.8±0.46 | 150 |
| Cl- | 4.7±0.40 | 2.0±0.58 | 8.2±0.12 | 250 |
| NO3- | 3.0±1.15 | 2.4±0.23 | 3.0±1.15 | 10 |
| P | 0.21±0.11 | 0.20±0.12 | 0.19±0.05 | 2 |
Table text extracted from the original PDF; superscript letters are shown inline. The original table image is below.
View original table image
Dissolve Oxygen: The mean results for dissolve oxygen for all the samples as depicted in Table 1 ranges from 4.67.0±0.92 to 5.87±1.04 mg/l. The dissolve oxygen of the water sources is in increasing order of A B C, with sample A having the lowest mean value of 4.67.0±0.92 mg/l and sample C with highest mean value of 5.8 7.0±1.04mg/l. Sample B and C were found be above the permissible limit of mg/l. The values were in contrast with previous report by [2,16] . The level of dissolved oxygen in natural water highly reduced with increasing of water temperature and high organic concentrations as a result of increased decomposer activities [2] .
Carbonates:
The mean value for carbonate ion as presented in Table 1 for all the water samples is 0.2±0.06 and was found to be below the WHO standard limits (75mg/l) [9] .
Bicarbonates : For the bicarbonates, the mean values ranged from 16±3.46 to 116±9.24 .The Bicarbonates of the water sources is in increasing order of C B A, and the values were below the [9] guideline of 150mg/l. The values were in agreement with previous report by [14] .
Calcium:
The mean value for Calcium ion as presented in Table 1 ranged from 30±2.89 to 72±2.31 mg/l. The calcium of the water sources is in this increasing order B C A with sample B having the minimum mean value of 30±2.89 mg/l and sample A with maximum mean value 72±2.31 mg/l. The [10] guidelines for calcium is 75mg/l and these samples were found to fall below the guideline. The values were in agreement with previous report by [13,17,1,2] . Calcium ion can occur naturally in natural water through the dissolution of carbonate minerals and the decomposition of the sulphate, phosphate, and silicate minerals. High calcium concentrations in water may lead to the formation of solid scales in pipes and kitchen utensils and increased soap consumption.
Magnesium
The mean value for Magnesium ion as presented in Table 1 for the water samples ranged from 25.2±0.12 to 67.2±0.12 mg/l. The Magnesium of different water sources is in this order B C A with sample B having the minimum mean value of 25.2±0.12 mg/l and sample A with maximum value of 67.2±0.12 mg/l. The [11] guidelines for calcium is 150mg/l and these samples were found to fall below the guideline. The values were in agreement with previous report by [13,17,1,2] . The higher magnesium content in sample A may be attributed to geological sources such as dolomite and other magnesium containing compounds in sediments and soils of the water sample.
Chloride:
The mean value for chloride ion in the water samples as presented in the Table 1 ranged from 2.0±0.58 to 8.2±0.12 mg/l. The Chloride of different water sources is in this increasing order B A C and the values were found to be below the [11] permissible limit of 250mg/l for chloride ion in natural water and the values were in agreement with previous report by [1,17,2] . The slight variations in the concentrations might be due to levels of chloride salts in the soil and sediments or a result of differences in degree of wastes entering into the water sources.
Nitrates: The Nitrates ion as shown in Table 1 for the water samples ranged from 2.4±0.23 to 3.0±1.15 mg/l. The Nitrates of different water sources is in this increasing order B with sample B having the minimum mean value of 2.4±0.23 mg/l and sample A and C with maximum mean value 3.0±1.15 of mg/l. These values fall below the [10] permissible limit of 10 mg/l for nitrates ion. The values were in agreement with previous reports by [1,17,2] .
Phosphate:
The mean value for phosphate ion for the water samples as presented in Table 1 ranged from 0.19±0.05 to 0.21±0.11 mg/l. The Nitrates of different water sources is in this increasing order C A. The analysed samples were found to fall below the [9] permissible limit of 2mg/l for phosphate ion in Natural water. The low concentration of the phosphate in the sample A water might be due to the geology of the area.
Conclusion
This work has presented the levels of physico-chemical parameters such as pH, conductivity, dissolve oxygen, carbonates, bicarbonates, calcium, magnesium, chloride, phosphates and nitrates in the natural water samples collected from three different sources in Gidan Igwai Area, Sokoto, Sokoto State, Nigeria.The analysis was carried out in triplicate and reported in mean value. All the three samples analysed for all the parameters were observed to fall below the World Health Organisation Standard except for sample B in pH determination as well as sample B and C in dissolve oxygen.The results showed that most of the parameters determined did not exceed the acceptable limit of the world Health Organization Standard. However, determination of heavy metal concentration is required which is what our subsequent research will explore.
References
21 in the original paper- Nnamani EV, Akpagu FC, Eze CG. The Analysis of selected physico-chemical parameters of water (A case study of ISU and Calabar Rivers in Ebonyi State, Nigeria). Journal of Applied Chemistry. 2015;8:21-25.
- Kiros GG, Goitom GB, Amanual HT, Samuel EG. Assessment of Some Physicochemical Parameters and Heavy Metals in Hand-Dug Well Water Samples of Kafta Humera Woreda, Tigray, Ethiopia. International Journal of Analytical Chemistry, 2021, Article ID 8867507, 9 pages
- Ezzati M, Lopez AD, Rogers A, Hoorn S, Marray CJ. Selected major risk factors and global and regional burden of disease. Lancet 2002;360:1343-1360.
- Guilbert J.J. The World Health Report 2002. Reducing risks, promoting health life. Educational Health. 2003;16:230-235.
- Lamikanra A. Essential microbiology for students and practitioner of pharmacy, 1999.
- Nikolazdze GDM, Akastal S. Water Treatment for Public and Industrial, 1989.
- Lannik PM, Zubenko IB. Role of bottom sediments in the secondary pollution of aquatic environments by heavy metal compounds lakes and Reservoirs Res. Manag. 2000;5:11-21.
- Abida B, Harikrishna D. Study on the Quality of water in some Streams of Cauvery River. Journal of Chemistry. 2008;5(2):377-384.
- Lehloesa LJ, Muyima NYO. Evaluation of the impact of the household treatment procedures on the quality of ground water supplies in the rural community of the Victoria district, Eastern Cape. Water SA 2000;26:285-290.
- Tanwir Saboor FA, Shan MH. Water Contamination, health hazards and public awareness a case of the urban Punjab, Pakistan International Journal of Agricuture and Biology, 2003, 460-462.
- World Health Organization (WHO) Guidelines for drinking water quality, 3rd edn. World Health Organization, Geneva, 2011.
- World Health Organization (WHO). Background document for development of Food and Agriculture Organization (FAO) (1997). Chemical analysis manual for food and water, 5th Ed. FAO ROME. 2004, p. 20-26.
- World Health Organization (WHO). Background document for development of WHO Guidelines for Drinking Water Quality, 3rd ed., 2004, 1 Geneva
- Lwanga MS, Kansiime F, Denny P, Scullion J. Heavy metals in Lake George, Uganda with relation to metal concentrations in tissues of common fish species. Hydrobiology. 2003;499:83-93.
- Faiza T, Yenny R, Djati MS, Bagyo Y, Leksono AS. The Analysis of the Physical and Chemical Properties of the Water Quality in the Rainy Season in the Sumber Maron River -Kepanjen, Malang -Indonesia. Journal of Resources and Environment. 2018;8(1):1-5.
- Chadetrik R, Arabinda S. Assesment of drinking water quality: Acase study of Ambala cantonment areas, Haryana, India. International Journal of Environmental Sciences. 2011;2(2):933-945.
- Daniel K. Quality Evaluation of domestic water sources within ziope community of the volta Region. A thesis submitted to the department to the department of Environmental Science and Technology,Kumasi in partial fulfilment of the requirements for the degree of Master of science in environmental science. College of Science, 2011.
- Ranjana B. Analysis of the physico-chemical and Bacteriological Parameters of Bottled water availability in Kathmandu Valley. A thesis submitted to the department of Environment Science Tribhuwan University Kirtipur in partial fulfilment of the requirements for the degree of Master of science in environmental science, 2010.
- Ezeribe AI, Osheieke KC, Jauro A. Physico-chemical Properties of Well water samples from some villages in Nigeria with cases of stained and mottle Teeth. Science World Journal. 2012;7(1):1-3.
- Campbell LM. Mercury in Lake Victoria (East Africa): Another emerging issue for a Beleaguered Lake? PhD, Thesis. Waterloo, Ontario, Canada, 2001.
- Obaro IO, Abubakar U, Haruna MA, Elinge MC. Evaluation of some heavy metals in River Argungu.Journal of fisheries and Aquatic Science, 2015;6(10):581-586.
Cited by 3
From OpenAlex, OpenCitations and reference lists read by Scinovex
- Physicochemical analysis of Mohan Ram Talab of Shahdol (M.P.) ↗
Bramhanand Shukla, Nidhi Shukla · International Journal of Advanced Academic Studies · 2022
This paper deals with the study of physico-chemical parameters of Mohan Ram Talab in Shahdol district, Madhya Pradesh, India. Monthly changes in physical and chemical parameters such as Water temp, pH, CO3-2, HCO3-, Cl, DO, BOD, COD, O.M., T.H., Ca++, Mg++, SO4-2, PO4-3, NO3-, NO2-, T.S., D.S., S.S., Na+, K+ were analyzed for a period of one year from April…
❝ 4PDF - Spatial evolution of the diversity of macroinvertebrate-Odonate larva population dynamics in relation to the environmental variables of the Niete hydrosystem (South Cameroon) ↗
Messoe William Aurélien, Acha Yannick Acha, Ajeagah Gidéon Aghaindum · Journal of Entomology and Zoology Studies · 2023
A study was carried out in the Niété, a tributary of the Lobé, to evaluate the quality of it’s water through a follow-up of the longitudinal evolution of the various abiotic (physico-chemical) and biotic (Odonate larva) parameters of this aquatic ecosystem. The results of the physico-chemical analysis of the water of the Niété, according to the grid of the water…
❝ 0PDF - Examination of physicochemical and bacteriological properties of available bottled water ↗
K Zielonka, N Lihareva · International Journal of Pharmaceutical and Clinical Research · 2021
This study aims to analyze the physicochemical and bacteriological characteristics of various commercially available bottled water brands. The research focuses on evaluating parameters such as pH, mineral content, presence of contaminants, and bacterial load to assess the quality and safety of bottled water for consumer use. This comprehensive analysis provides insights into the compliance of bottled water with health and
❝ 0Found by Scinovex