
Research article · 2020 · Full text
International Journal of Advanced Chemistry ResearchSynthesis of doped nano-composite ceramic oxide materials their applications
Volume 2(2) · Pages 21–31 · DOI: 10.33545/26646781.2020.v2.i2a.24 ↗
Research areasAdvancements in Solid Oxide Fuel CellsCatalytic Processes in Materials ScienceElectrocatalysts for Energy Conversion
Abstract
Author-writtenDoped ceria nanocomposite ceramic oxide materials have been successfully developed using economically cheap method, i.e., chemical precipitation method. TGA patterns obtained on the precursor samples revealed the formation of product and the removal of molecules. The conductivity data obtained on all the samples revealed optimum conductivity and the samples proposed in this research work may be suitable for electrolyte application in SOFC systems. Among the six types studied, the sample Ce0.8Gd0.2O2-δ-Ce0.8Sm0.2O2-δ has shown improved oxide ion conductivity at 600 °C when compared with other samples.
Summary
Source-checkedPlain-language reading of the full paper, prepared with AI and checked against the text. Each point links to the authors' own words.
Why it matters
- Nanocrystalline materials are of significant interest for fundamental research because they can be used to develop new materials with unusual properties. View evidence ↗
- Doped ceria is a promising electrolyte material because its ionic conductivity is nearly ten times higher than that of stabilized zirconia under similar conditions. View evidence ↗
The question
- The study aimed to develop doped ceria nanocomposite ceramic oxide materials using an economically cheap chemical precipitation method. View evidence ↗
What they did
- The materials were synthesized by adding cerium, gadolinium, and either yttrium or samarium nitrate solutions dropwise to a magnesium hydroxide solution containing 2 ml of 10% CTAB surfactant to prevent agglomeration. View evidence ↗
- The synthesized materials underwent calcination at temperatures of 300 °C, 450 °C, 600 °C, and 800 °C for 2 hours each. View evidence ↗
- Circular compacts (2 mm thick, 10 mm diameter) were formed under 1.2 tons of pressure and sintered in air at 800 °C for 3 hours. View evidence ↗
What they found
- Thermo gravimetric analysis (TGA) showed that weight loss in all precursor samples began at the initial stage of 25 °C. View evidence ↗
- The TGA data indicated that the formation of phase-pure doped nanocomposite ceramic materials occurred when weight loss stabilized around 700 °C. View evidence ↗
- The study found an inverse relationship between activation energy and oxide ion conductivity, where activation energy increased as conductivity decreased. View evidence ↗
What it means
- The authors conclude that the developed doped ceria nanocomposite materials exhibit optimum conductivity and are suitable for use as electrolytes in SOFC systems. View evidence ↗
Visual summary
1 visualsIllustrations explain the paper; they do not show study data.
Synthesis Workflow
AI-generated conceptual illustration (doped nano-composite ceramic oxide pellets). It explains the idea and does not show study data.
View source evidence ↗Figures & tables
From the original paper Table 1
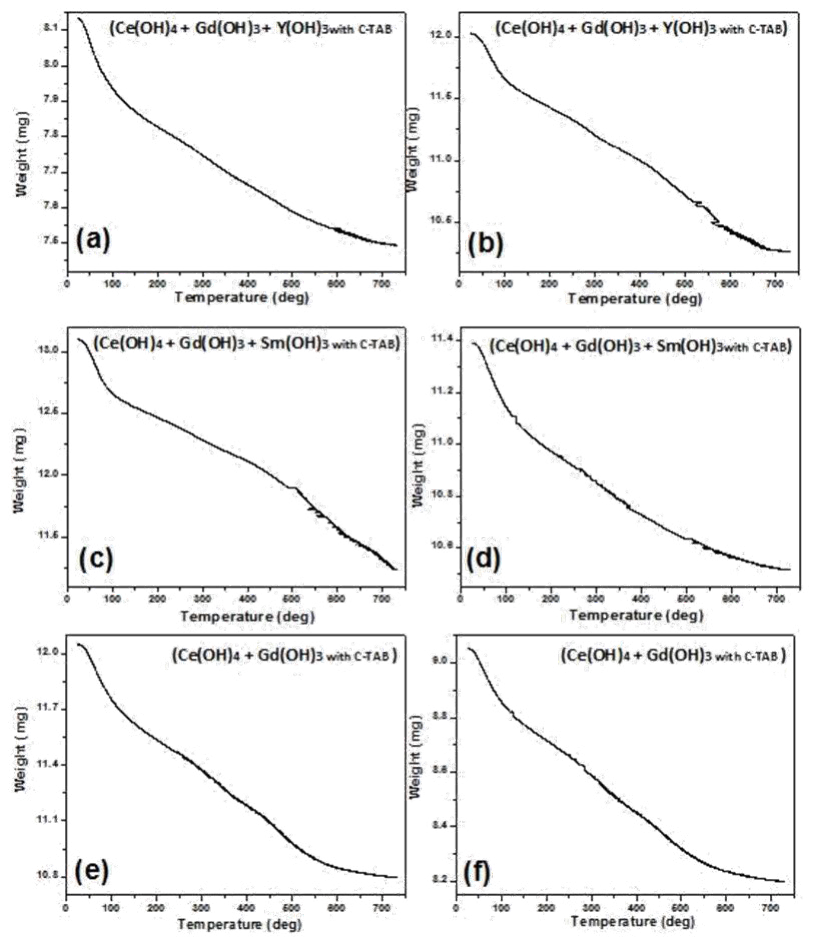 Figure 1
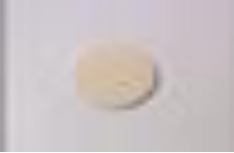 Figure 2
 Figure 3
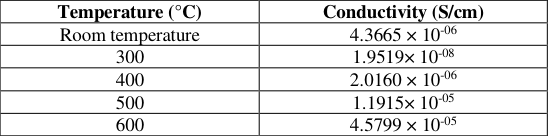 Table 2
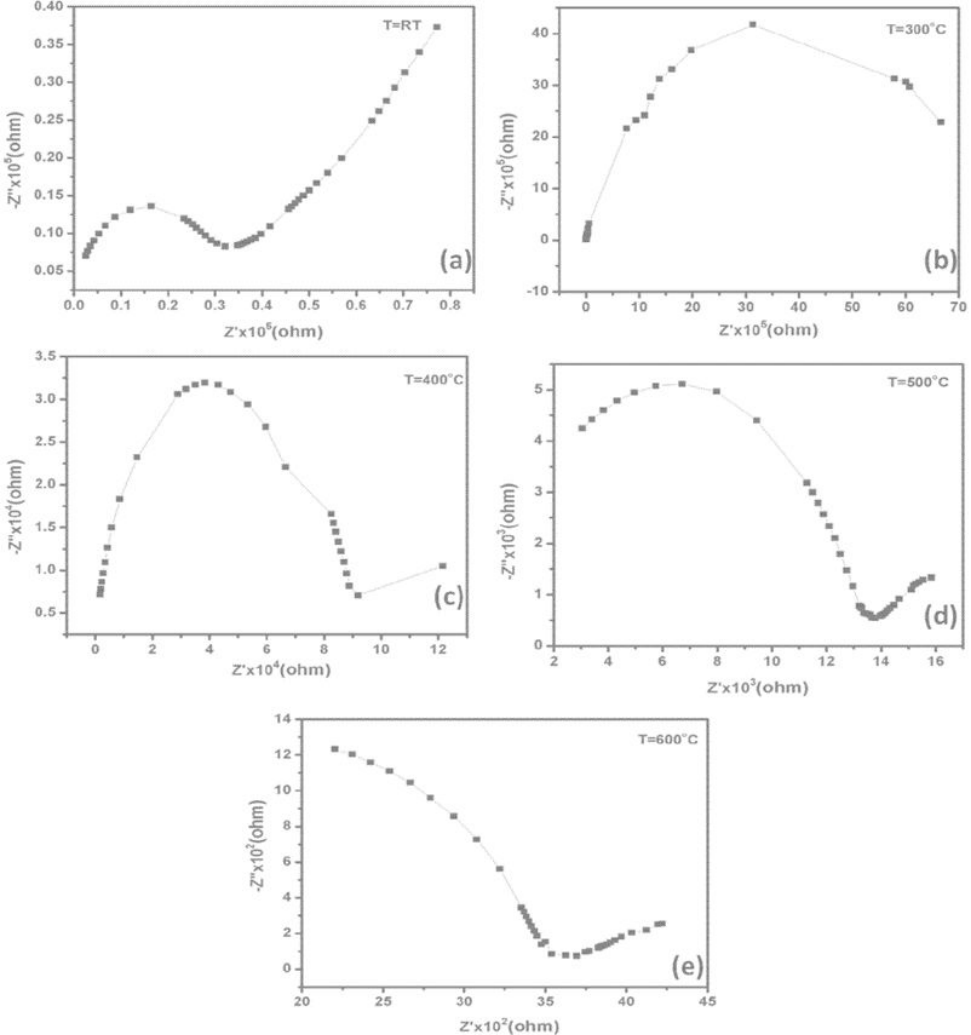 Figure 4
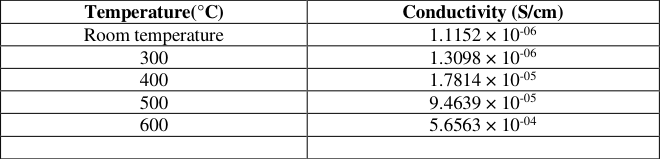 Table 3
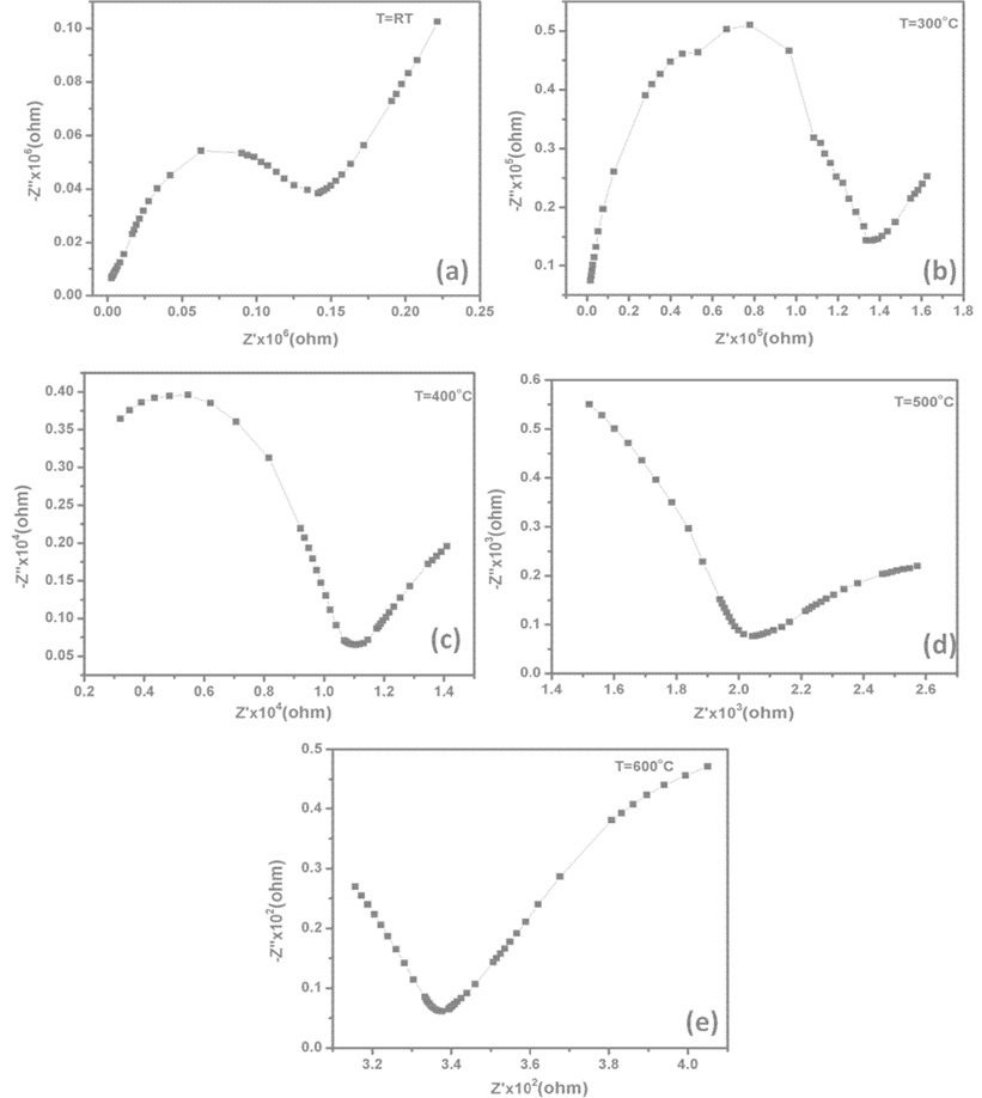 Figure 5
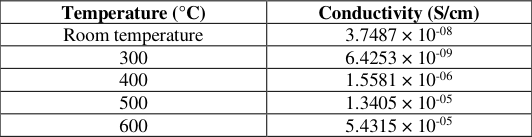 Table 4
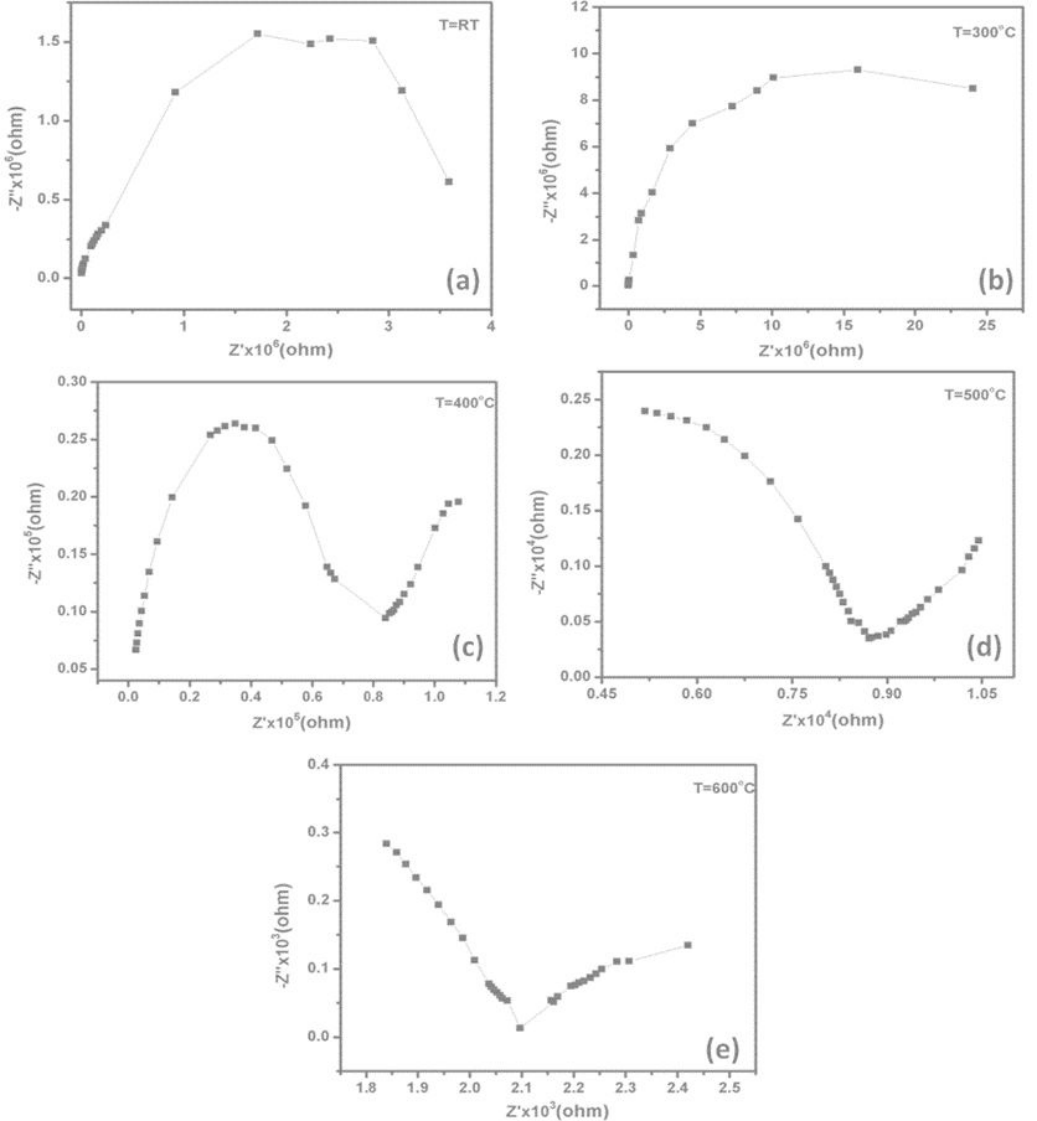 Figure 6
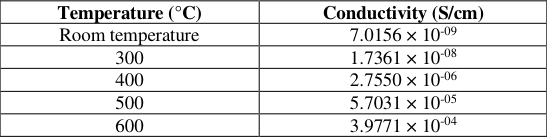 Table 5
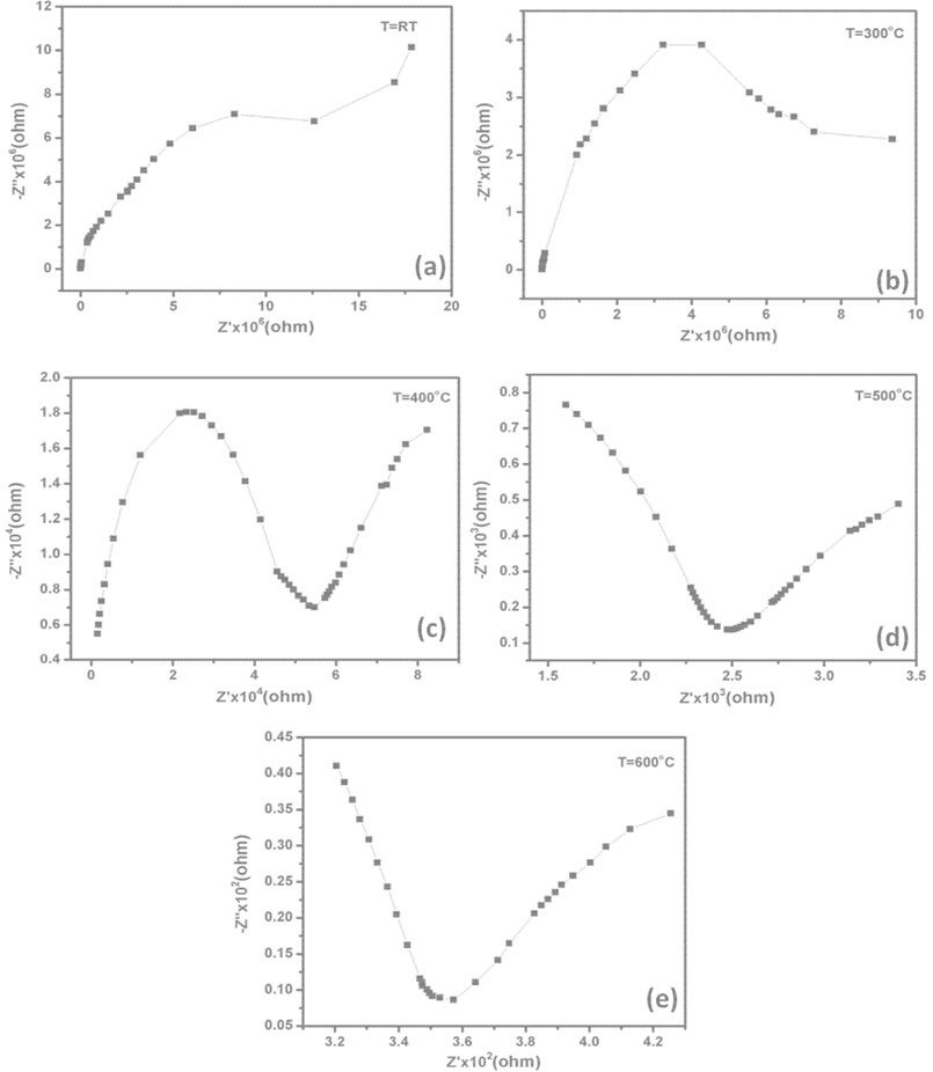 Figure 7
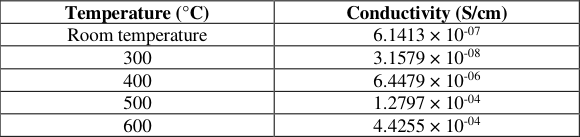 Table 6
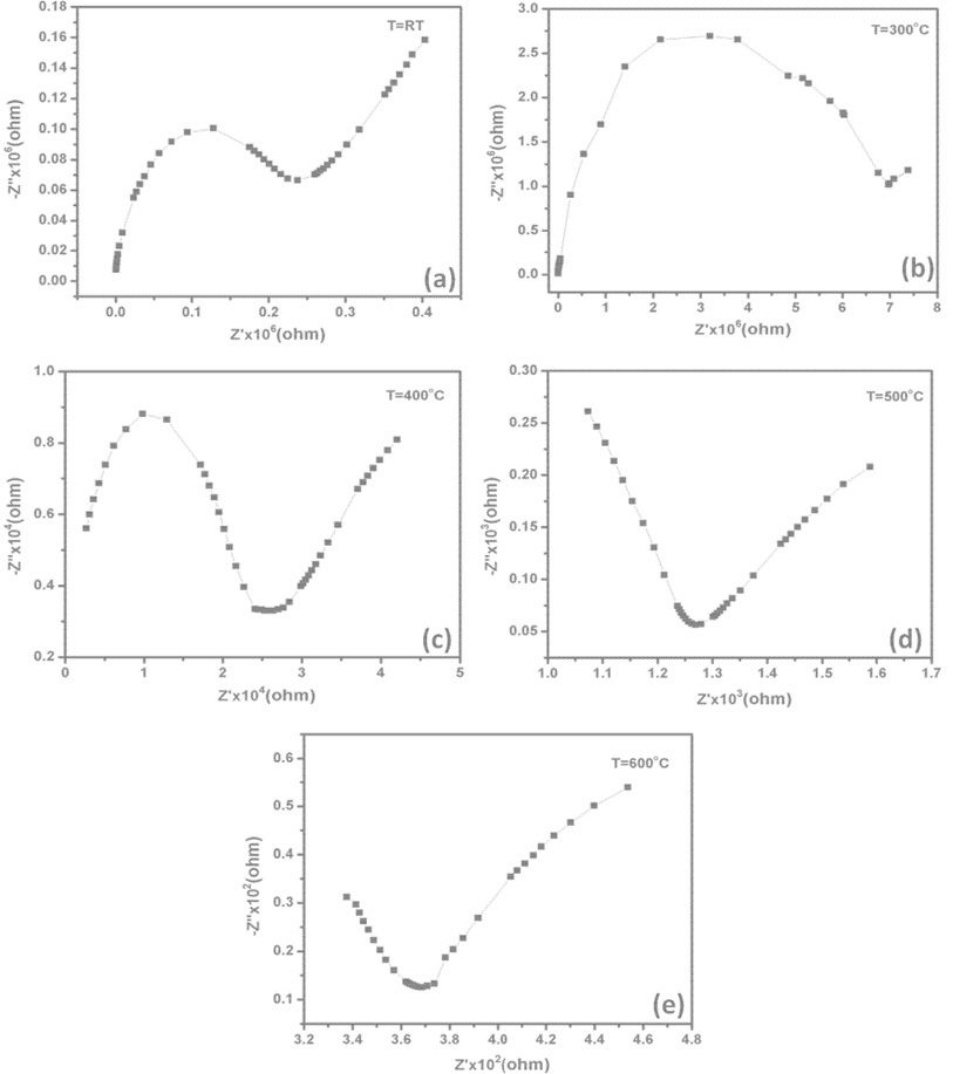 Figure 8
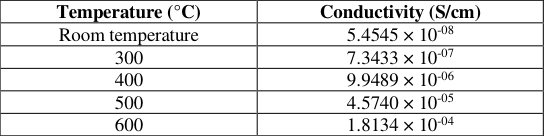 Table 7
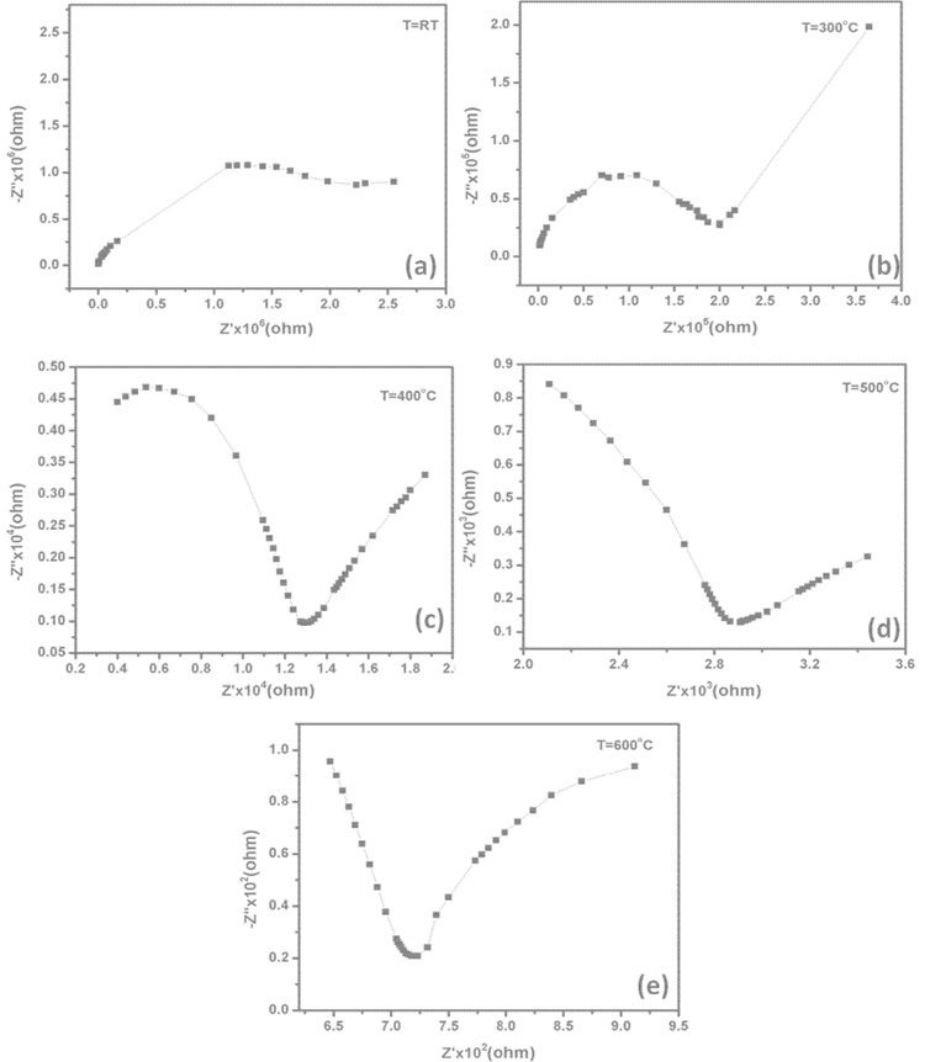 Figure 9
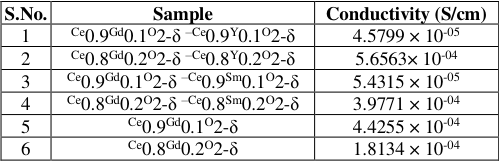 Table 8
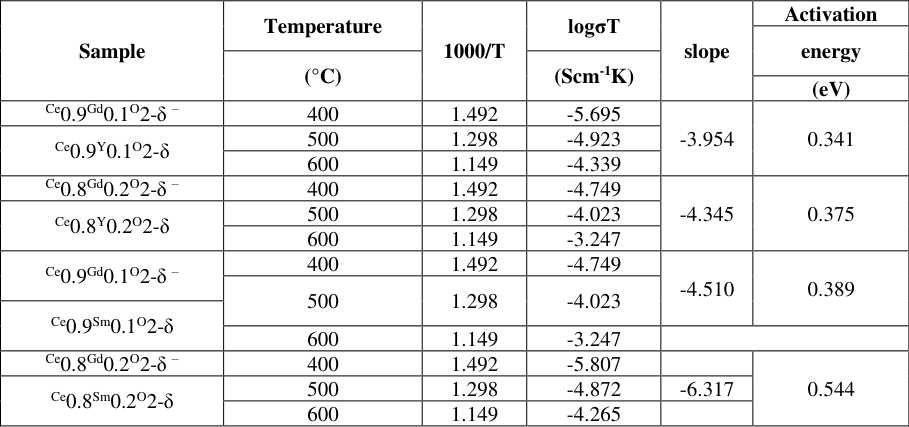 Table 9
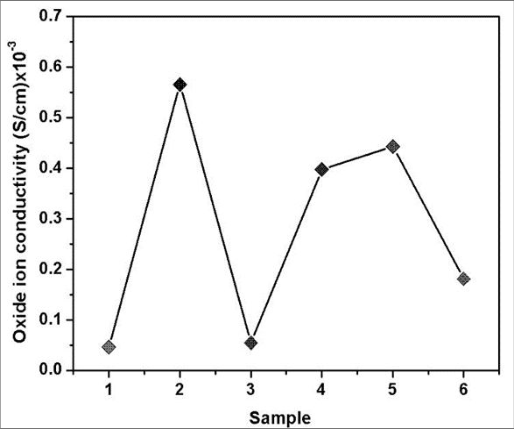 Figure 10
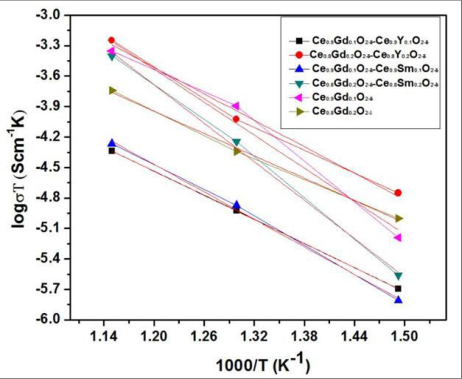 Figure 11
Introduction
Nanocrystalline materials are interesting from the point of view of fundamental research for studying interface characteristics. Nanocrystalline materials are expected to play an important role in developing new materials exhibiting unusual properties [1] .
Fig 1:
TGA spectra obtained with the doped ceria precursor materials (a) Ce 0.9 Gd 0.1 O 2-δ -Ce 0.9 Y 0.1 O 2-δ , (b) Ce0 .8 Gd 0.2 O 2-δ -Ce 0.8 Y 0.2 O 2-δ , (c) Ce 0.9 Gd 0.1 O 2-δ -Ce 0.9 Sm 0.1 O 2-δ , (d) Ce 0.8 Gd 0.2 O 2-δ -Ce 0.8 Sm 0.2 O 2-δ , (e) Ce 0.9 Gd 0.1 O 2-δ and (f) Ce 0.8 Gd 0.2 O
2-δ
The TGA of the doped ceria precursor materials represented the curve of weight loss. From the figures, the total weight loss at the temperatures between of 25 °C to 800 °C was found to be in different percentages for different compositions. From the curves of all the samples, it was understood that the weight loss begins to appear from the initial stage i.e., from 25 °C. From curve the thermal decomposition of the molecule can be split into four separate sections [5] . The first one is related to the evaporation of the absorbed water between 50 and 100 °C, at which most of the water will be evaporated.
In the second section, the residue water will be evaporated at temperature rate. In third section the structural water, which has band structure with metal and oxygen atoms inside the molecule, will be eliminated before 650 °C. During heat treatments, the compound may lead to form phase pure doped ceria nanocomposite materials. In the last section, the molecule will be stable and the weight of molecule is nearly constant without any change in weight loss. Thermo gravimetric analysis data obtained from the precursor materials is given in Table : 1 From the Table : 1, it was understood that the weight loss of about 2-3% is found at around 100 °C, which may be due to the removal of water molecule from the samples. Then, the total weight loss is found to be different (1-2 %) for all samples at around 250 °C and which may be attributed to the removal of organics present in the samples. The further weight loss observed in the sample until 700 °C may be due to the decomposition of remaining carbon/nitrogen-based compounds from the sample. At around 700 °C, the weight loss is stable, which indicates the formation of phase-pure doped nanocompostie ceramic materials.
Conductivity studies
Doping ceria with certain rare earth oxides can remarkably reduce the enthalpy of association. These rare earth oxides are Gd2O3, Sm2O3 and Y2O3. When they are properly doped, ceria can have an ionic conductivity one order of magnitude larger than YSZ. At low oxygen partial pressure, ceria exhibits mixed ionic and electronic conductivity [6] .
Especially the ionic contribution is high up to a temperature of 800 °C.
That is actually the reason why ceria is considered as an interesting electrolyte material for intermediate temperature SOFCs.
The proposed ceria based nanocomposite ceramic oxide materials were subjected to ionic conductivity measurements as per the details mentioned below.
Preparation of circular compacts
The circular compacts of doped ceria nanocomposite ceramic oxide electrolyte materials (with 2 mm thickness and 10 mm diameter) were prepared using a hydraulic machine by applying a pressure of 1.2 ton. The circular compacts were sintered at 800 °C for 3h in air before subjecting the same for conductivity studies. A sample sintered circular compact is indicated in Figure 2. From the obtained oxide ion conductivity values, a graph has been drawn to compare the oxide ion conductivity values of different compositions of doped ceria nanocomposite ceramic oxide materials at 600 °C which is shown in Figure 10. The comparative table showing the oxide ion conductivity values of doped ceria based electrolyte materials is shown in Table 8. From the Table 8 and Figure 10, it was understood that the sample Ce0.8Gd0.2O2-δ -Ce0.8Sm0.2O2-δ has shown better oxide ion conductivity when compared with other samples.
| S.No. | Sample | Conductivity (S/cm) |
|---|---|---|
| 1 | Ce0.9Gd0.1O2-δ –Ce0.9Y0.1O2-δ | 4.5799 × 10-05 |
| 2 | Ce0.8Gd0.2O2-δ –Ce0.8Y0.2O2-δ | 5.6563× 10-04 |
| 3 | Ce0.9Gd0.1O2-δ –Ce0.9Sm0.1O2-δ | 5.4315 × 10-05 |
| 4 | Ce0.8Gd0.2O2-δ –Ce0.8Sm0.2O2-δ | 3.9771 × 10-04 |
| 5 | Ce0.9Gd0.1O2-δ | 4.4255 × 10-04 |
| 6 | Ce0.8Gd0.2O2-δ | 1.8134 × 10-04 |
Table text extracted from the original PDF; superscript letters are shown inline. The original table image is below.
View original table image
Activation energy measurements
In this research work, the samples were sintered at 800 °C for 3 hours. By using the sintering temperature, the oxide ion conductivity can be improved. The Arrhenius plots obtained on doped nanocomposite ceramic oxide materials are shown in Figure 11. From the Arrhenius plots, it was understood that the ionic conductivity of doped ceria electrolytes is influenced not only by the concentration and the distribution of oxygen vacancy levels, but also by the lattice strain.From the results, it was found that partial substitution of Gd with Y and Sm in ceria might cause two reverse effects. First one is the suppression of ordering of the oxygen vacancy levels and which may lead to the decrease in the activation energy of conductivity and increase in the ionic conductivity. Second one is the deviation of the lattice parameter from pure CeO2 and which may lead to the increase in the activation energy of conduction and the decrease in ionic conductivity. Therefore, the electrolyte with the higher ionic conductivity and lower activation energy must be with an appropriate dopant concentration.The activation energies calculated for doped nanocomposite ceramic oxide materials are indicated in Table . 9 From the observation, it was found that the activation energy increases with the decrease in oxide ion conductivity values.
Conclusion
In this work, a set of nanocrystalline electrolyte materials (Ce0.9Gd0.1O2-δ-Ce 0.9 Y 0.1 O 2-δ , Ce 0.8 Gd 0.2 O 2-δ -Ce 0.8 Y 0.2 O 2δ ,Ce 0.9 Gd 0.1 O 2-δ -Ce 0.9 Sm 0.1 O 2-δ , Ce0.8Gd0.2O2-δ-Ce0.8Sm0.2O2-δ, Ce0.9Gd0.1O2-δ andCe0.8Gd0.2O2-δ) for SOFC was developed. The following conclusions are drawn from the results achieved from this research activity. Doped ceria nanocomposite ceramic oxide materials have been successfully developed using economically cheap method, i.e., chemical precipitation method. TGA patterns obtained on the precursor samples revealed the formation of product and the removal of molecules. The conductivity data obtained on all the samples revealed optimum conductivity and the samples proposed in this research work may be suitable for electrolyte application in SOFC systems. Among the six types studied, the sample Ce0.8Gd0.2O2-δ-Ce0.8Sm0.2O2-δ has shown improved oxide ion conductivity at 600 °C when compared with other samples.
Acknowledgement
AcknowledgementAuthor wants to thanks the Dean, Faculty of Science, Motherhood University, Roorkee for the kind support and help.
Figures and tables from the paper
| Sample | Initial weight | Final weight | Total | Total |
|---|---|---|---|---|
| weight loss | weight loss | |||
| (mg) at 25 °C | (mg) at 800 °C | |||
| (mg) | (%) | |||
| Ce0.9Gd0.1O2-δ - | 8.13 | 7.49 | 0.64 | 7% |
Table text extracted from the original PDF; superscript letters are shown inline. The original table image is below.
View original table image
| Temperature (°C) | Conductivity (S/cm) |
|---|---|
| Room temperature | 4.3665 × 10-06 |
| 300 | 1.9519× 10-08 |
| 400 | 2.0160 × 10-06 |
| 500 | 1.1915× 10-05 |
| 600 | 4.5799 × 10-05 |
Table text extracted from the original PDF; superscript letters are shown inline. The original table image is below.
View original table image
| Temperature(°C) | Conductivity (S/cm) |
|---|---|
| Room temperature | 1.1152 × 10-06 |
| 300 | 1.3098 × 10-06 |
| 400 | 1.7814 × 10-05 |
| 500 | 9.4639 × 10-05 |
| 600 | 5.6563 × 10-04 |
Table text extracted from the original PDF; superscript letters are shown inline. The original table image is below.
View original table image
| Temperature (°C) | Conductivity (S/cm) |
|---|---|
| Room temperature | 3.7487 × 10-08 |
| 300 | 6.4253 × 10-09 |
| 400 | 1.5581 × 10-06 |
| 500 | 1.3405 × 10-05 |
| 600 | 5.4315 × 10-05 |
Table text extracted from the original PDF; superscript letters are shown inline. The original table image is below.
View original table image
| Temperature (°C) | Conductivity (S/cm) |
|---|---|
| Room temperature | 7.0156 × 10-09 |
| 300 | 1.7361 × 10-08 |
| 400 | 2.7550 × 10-06 |
| 500 | 5.7031 × 10-05 |
| 600 | 3.9771 × 10-04 |
Table text extracted from the original PDF; superscript letters are shown inline. The original table image is below.
View original table image
| Temperature (°C) | Conductivity (S/cm) |
|---|---|
| Room temperature | 6.1413 × 10-07 |
| 300 | 3.1579 × 10-08 |
| 400 | 6.4479 × 10-06 |
| 500 | 1.2797 × 10-04 |
| 600 | 4.4255 × 10-04 |
Table text extracted from the original PDF; superscript letters are shown inline. The original table image is below.
View original table image
| Temperature (°C) | Conductivity (S/cm) |
|---|---|
| Room temperature | 5.4545 × 10-08 |
| 300 | 7.3433 × 10-07 |
| 400 | 9.9489 × 10-06 |
| 500 | 4.5740 × 10-05 |
| 600 | 1.8134 × 10-04 |
Table text extracted from the original PDF; superscript letters are shown inline. The original table image is below.
View original table image
| Sample | Temperature | 1000/T | logσT | slope | Activation |
|---|---|---|---|---|---|
| energy | |||||
| (°C) | (Scm-1K) | ||||
| (eV) | |||||
| Ce0.9Gd0.1O2-δ – | 400 | 1.492 | -5.695 | -3.954 | 0.341 |
| Ce0.9Y0.1O2-δ | 500 | 1.298 | -4.923 | ||
| 600 | 1.149 | -4.339 | |||
| Ce0.8Gd0.2O2-δ – | 400 | 1.492 | -4.749 | -4.345 | 0.375 |
| Ce0.8Y0.2O2-δ | 500 | 1.298 | -4.023 | ||
| 600 | 1.149 | -3.247 | |||
| Ce0.9Gd0.1O2-δ – | 400 | 1.492 | -4.749 | -4.510 | 0.389 |
| 500 | 1.298 | -4.023 | |||
| Ce0.9Sm0.1O2-δ | |||||
| 600 | 1.149 | -3.247 | |||
| Ce0.8Gd0.2O2-δ – | 400 | 1.492 | -5.807 | 0.544 | |
| Ce0.8Sm0.2O2-δ | 500 | 1.298 | -4.872 | -6.317 | |
| 600 | 1.149 | -4.265 |
Table text extracted from the original PDF; superscript letters are shown inline. The original table image is below.
View original table image
References
9 in the original paper- Komarneni S. "Feature article: Nanocomposites", Journal of Materials Chemistry. 1992; 2:1219-1230.
- Zhu B, Mat MD. "Studies on dual phase ceria-based composites in electrochemistry," International Journal of Electrochemical Sciences. 2006; 1:383-402
- Ketzial JSSJ, Radhika D, Nesaraj AS. "Low temperature preparation and physical characterization of doped BaCeO3 nano particles by chemical precipitation", International Journal of Industrial Chemistry, 2013, 4-18.
- Song X, Jiang N, Li Y, Xu D, Qiu G. "Synthesis and characterization of Y-doped mesoporous CeO2 using a chemical precipitation method", Journal of rare earths. 2007; 25:428-433
- Mahaleh Y, Sadrnezhaad SK, Hosseini D. "NiO Nanoparticles synthesis by chemical precipitation and effect of applied surfactant on distribution of particle Size", Journal of Nanomaterials. 2008; 4:470595.
- Zhu WZ, Deevi SC. "A review on the status of anode materials for solid oxide fuel cells", Materials Science and Engineering. 2003; 362:228-239.
- Inaba H, Tagawa H. "Review ceria-based solid electrolyte", Solid State Ionics. 1996; 83:1-16.
- Yamamura H, Katoh E, Ichikawa M, Kakinuma K, Mori T, Haneda H, et al. "Multiple doping effect on the electrical conductivity in the (Ce1-x-yLaxMy) O2-δ (M = Ca, Sr) system", Electrochemistry. 2000; 68:455-459.
- Yoshida H, Deguchi H, Miura K, Horiuchi M, Inagaki T. "Investigation of the relationship between the ionic conductivity and the local structures of singly and doubly doped ceria compounds using EXAFS measurement", Solid State Ionics. 2001; 140:191-199.