
Research article · 2020 · Full text
International Journal of Advanced Chemistry ResearchEffect of irrigation with Amalai paper mill effluent on the organic carbon and organic matter in the soil
Volume 2(2) · Pages 18–20 · DOI: 10.33545/26646781.2020.v2.i2a.23 ↗
Research areasWastewater Treatment and Reuse
Abstract
Author-writtenThe study was undertaken to investigate the Effect of irrigation with Amalai Paper Mill Effluent On the Organic Carbon and Organic Matter in the soil. The effluent sample from orient paper mill were analysed. For this soil samples were collected from four different places from within the area of Anuppur district. This was done so to have representative sample of all the soil types found within the area of Anuppur district. Organic matter content of the soil being a value multiplied by a similar factor to the organic carbon had similar values as the organic carbon with higher average values for site 4 and site 1 as compared to the values for site 2 and 3.
Summary
Source-checkedPlain-language reading of the full paper, prepared with AI and checked against the text. Each point links to the authors' own words.
Why it matters
- The paper industry produces effluents containing various organic and inorganic components, including cellulosic wastes and chlorine compounds. View evidence ↗
- Directly discharging paper mill effluents can significantly alter the biological and physico-chemical properties of the soil. View evidence ↗
- Using treated paper industry effluent for crop irrigation has been shown to cause serious changes in soil chemistry. View evidence ↗
The question
- The study aimed to investigate how irrigation with effluent from the Amalai Paper Mill affects organic carbon and organic matter in the soil. View evidence ↗
What they did
- Soil samples were collected from four different locations in the Anuppur district to represent all soil types in that area. View evidence ↗
- Organic carbon was determined using the Walkley and Black titrimetric method, which was then used to estimate organic matter content. View evidence ↗
- The percentage of organic matter was calculated by multiplying the percentage of organic carbon by a factor of 1.724. View evidence ↗
What they found
- Organic carbon levels in the soil varied nearly three-fold, ranging from 0.24% to 0.69% across different sites and months. View evidence ↗
- On average, sites 4 and 1 exhibited organic carbon values nearly double those found at sites 2 and 3. View evidence ↗
- The mean organic carbon percentages for sites S1, S2, S3, and S4 were 0.58%, 0.26%, 0.27%, and 0.62%, respectively. View evidence ↗
- The mean organic matter percentages for sites S1, S2, S3, and S4 were 1.01%, 0.45%, 0.48%, and 1.07%, respectively. View evidence ↗
- Organic matter content followed a similar pattern to organic carbon, with higher average values at sites 4 and 1 compared to sites 2 and 3. View evidence ↗
- While the chemical properties of the soils at the four sites were similar to hill soil types, their physical properties and appearance differed. View evidence ↗
What it means
- The authors conclude that by using four representative soil types, the impact of paper mill effluent can be predicted for any soil within the district. View evidence ↗
Visual summary
3 visualsIllustrations explain the paper; charts are replotted from the paper's own table values.
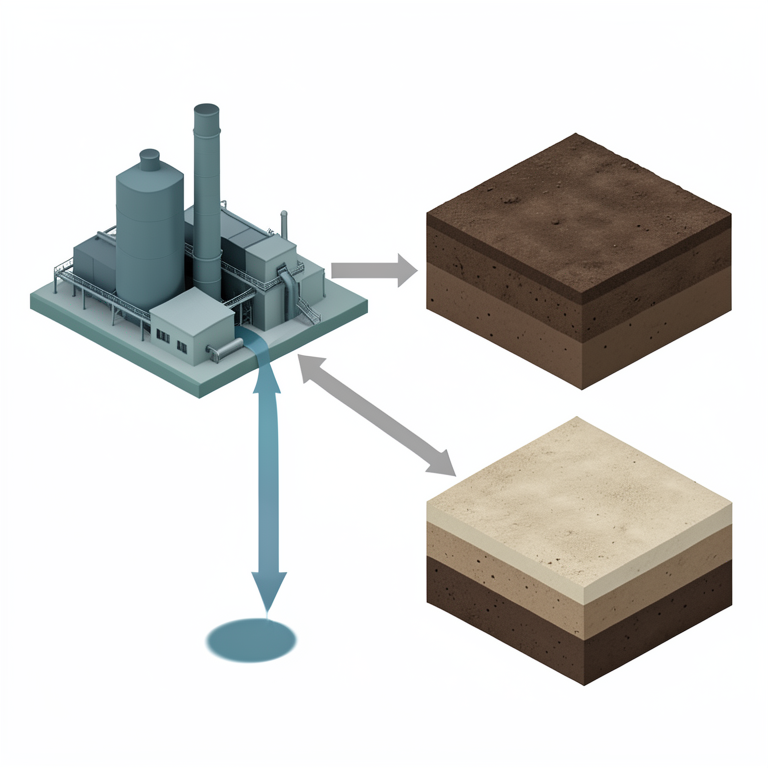
Study Design Overview
AI-generated conceptual illustration (soil profiles and a paper mill facility). It explains the idea and does not show study data.
View source evidence ↗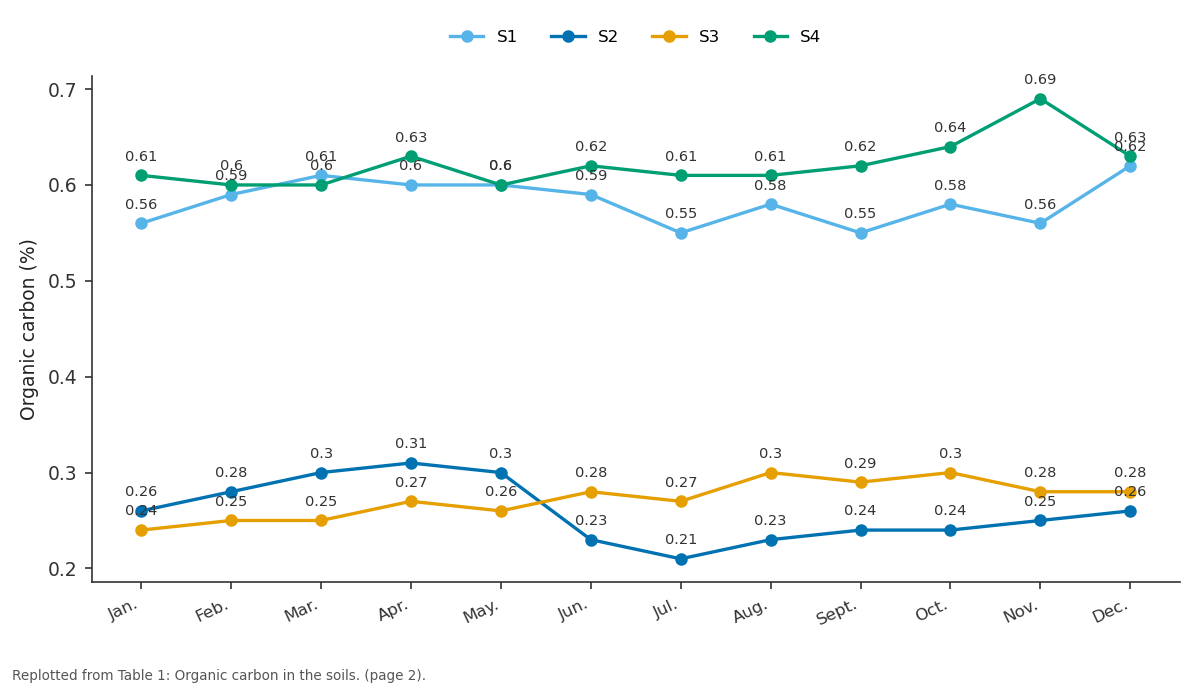
S1 and S2 and more: Jan. vs Feb. vs Mar. vs Apr. vs May.
Replotted from Table 1 (page 2) of the original paper. Every bar is the paper's own table value.
View source evidence ↗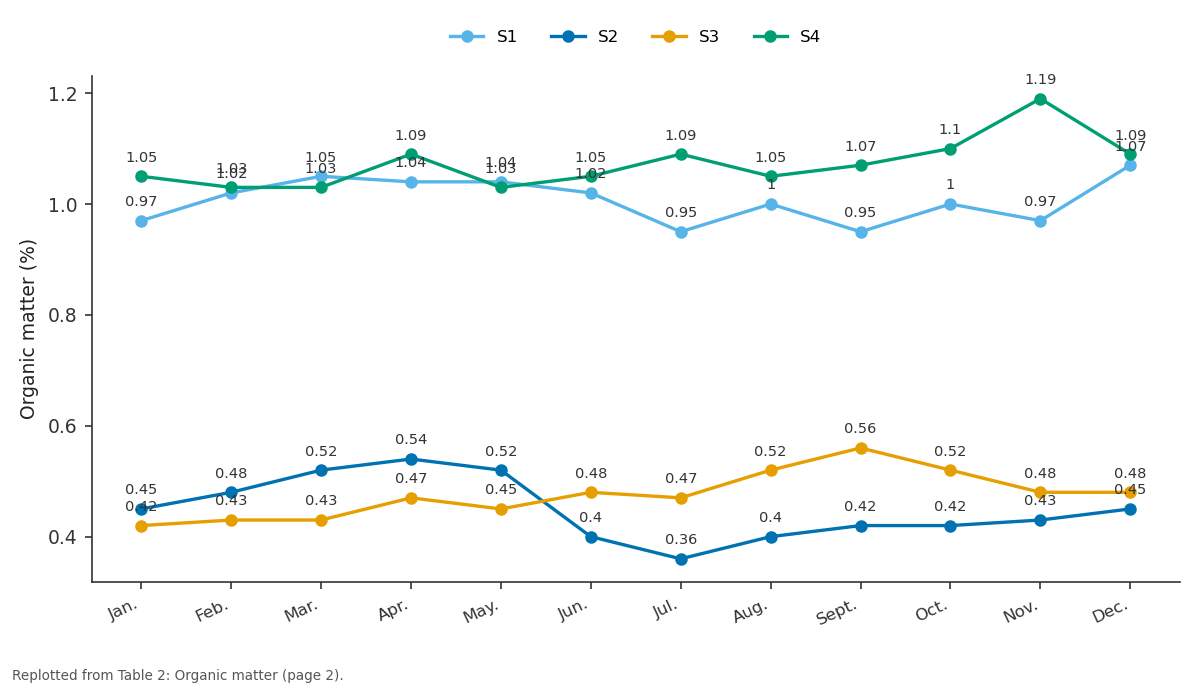
S1 and S2 and more: Jan. vs Feb. vs Mar. vs Apr. vs May.
Replotted from Table 2 (page 2) of the original paper. Every bar is the paper's own table value.
View source evidence ↗Figures & tables
From the original paper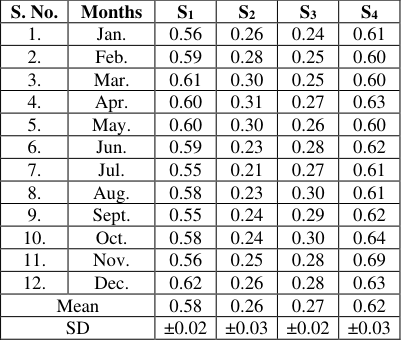 Table 1
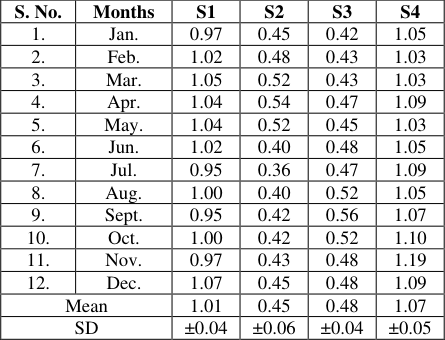 Table 2
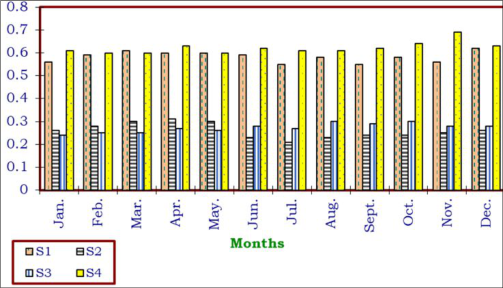 Figure 1
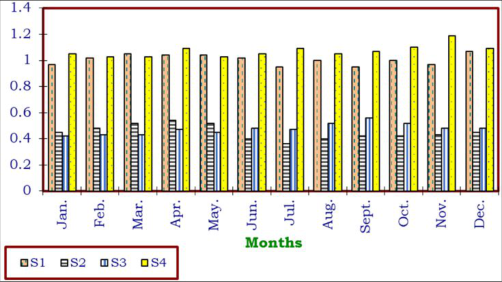 Figure 2
Introduction
Soil may be defined as a thin layer of earth's crust which serves as a natural medium for the growth of plants. It is the unconsolidated mineral matter that has been subjected to, and influenced by genetic and environmental factorsparent material, climate, organisms and topography all acting over a period of time. Soil differs from the parent material in the morphological, physical, chemical and biological properties. Also, soils differ among themselves in some or all the properties, depending on the differences in the genetic and environmental factors. Thus, some soils are red, some are black; some are deep and some are shallow; some are coarse-textured and some are fine-textured. They serve in varying degree as a reservoir of nutrients and water for crops, provide mechanical anchorage and favourable tilth. The components of soils are mineral material, organic matter, biota, water and air, the proportions of which vary and which together form a system for plant growth. Paper industry is an agro based industry, effluents generating from this industry contain considerable amounts of organic and inorganic chemical components such as fibers, cellulosic wastes, wood dust, chlorine compounds, carbonates and bicarbonates (Mishra and Sunandashao, 1989) [1] . Paper mill effluent has health impacts such as diarrhea, vomiting, headache, nausea and eye irritation on humans (Akhan, 2008 and APHA, 1998) [2,3] . Direct discharge of effluents from this industry may have profound influence on soil physico-chemical and biological properties. The treated paper industry effluent, used for crop irrigation showed serious changes in the chemistry of the soil. Presence of toxic pollutants affect aquatic system (Makris and Banerjee, 2002, and Owens, et al. 1994) [4,5] . Khodabakhsh, (2013) [6] have recorded significant increase in electrical conductivity (salinity), organic carbon, soluble Ca and Mg, available soil phosphorus and potassium but the percentage of total neutralizing value (T.N.V) of soil decreased. Variation in physico-chemical properties of soil around industrial area and agricultural area has been reported by Sumithra, et al. (2013) [7] . Also, plots irrigated with wastewater showed important structural damage in sub surface zone where soil pore network collapsed.
Material and Methods
The study site lies between 23°6'0" N Latitude and 81°41'1" E Longitude in Anuppur district. The district is situated in the north eastern part of Madhya Pradesh. This District came into existence on 15 th of August 2003 by re-organising Shahdol District. Anuppur District has total area of 3701 sq.km., extends 80 km from east to west and 70 km from north to south. For this soil samples were collected from four different places from within the area of Anuppur district. This was done so to have representative sample of all the soil types found within the area of Anuppur district. Places of collection of the soil were given site number, as follows:
Soil samples were collected by the compositing method.
Compositing is the mixing of sample units to form a single sample, which is used for Chemical Analysis (Tan, 1995) [8] . In compositing, the fundamental assumption is that analysis of the composited sample yields a valid estimate of the mean, which would be obtained by averaging the result of analysis from each of the sampling units contributing to the composite. The organic matter content of soil is estimated from the organic carbon, determined by using Titrimetric determination (Walkley and Black, 1934) [9] method. The method is also known as "Wetdigestion method" involves a rapid titration procedure for the estimation of organic Carbon content of soil. Carbon was oxidized by K 2 Cr 2 O 7 followed by back titration, against a standard solution of ferrous ammonium sulphate.
Titration Procedure
1g soil was taken in a 500 mL conical flask. 10 mL of 1N K 2 Cr 2 O 7 solution was mixed and shaken. Then, added 20 mL of con. H 2 SO 4 and swirl the flask 2 or 3 minute, allowed the flask to cool for 30 minutes. Poured 200 mL of distilled water, 10 mL of H 3 PO 4 (85%) or 0.5 gm of NaF and 1 mL (10 drops approximately) of diphenyl amine indictor were then added and swirled to mix well. The solution was titrated with 0.5N Ferrous Ammonium Sulphate solution on Auto-Tritrator (Systronics-351) till the colour changed from blue violet to green. A blank solution made as described above (without soil sample) was titrated and the same process was repeated for all the soil samples.
Calculation
Where, B = Titre value for the blank solution T = Titre value with the solution containing the soil sample % of organic Matter = % Organic Carbon x 1.724
Results and Discussion
The results have been given in table 1. Organic matter of the soils of all the sites have been reported in table 2. Organic carbon percent in the soil had almost three-fold variation from 0.24 to 0.69, between the months and sites. On the average site 4 and site 1 had almost double the values as compared to the values for site 2 and 3. Organic matter content of the soil being a value multiplied by a similar factor to the organic carbon had similar values as the organic carbon with higher average values for site 4 and site 1 as compared to the values for site 2 and 3. A comparison of the present work, which was concentrated on the soil types of the study area has been worked out earlier also by Friedel et al.
| S. No. | Months | S1 | S2 | S3 | S4 |
|---|---|---|---|---|---|
| 1. | Jan. | 0.97 | 0.45 | 0.42 | 1.05 |
| 2. | Feb. | 1.02 | 0.48 | 0.43 | 1.03 |
| 3. | Mar. | 1.05 | 0.52 | 0.43 | 1.03 |
| 4. | Apr. | 1.04 | 0.54 | 0.47 | 1.09 |
| 5. | May. | 1.04 | 0.52 | 0.45 | 1.03 |
| 6. | Jun. | 1.02 | 0.40 | 0.48 | 1.05 |
| 7. | Jul. | 0.95 | 0.36 | 0.47 | 1.09 |
| 8. | Aug. | 1.00 | 0.40 | 0.52 | 1.05 |
| 9. | Sept. | 0.95 | 0.42 | 0.56 | 1.07 |
| 10. | Oct. | 1.00 | 0.42 | 0.52 | 1.10 |
| 11. | Nov. | 0.97 | 0.43 | 0.48 | 1.19 |
| 12. | Dec. | 1.07 | 0.45 | 0.48 | 1.09 |
| Mean | 1.01 | 0.45 | 0.48 | 1.07 | |
| SD | ±0.04 | ±0.06 | ±0.04 | ±0.05 |
Table text extracted from the original PDF; superscript letters are shown inline. The original table image is below.
View original table image
| S. No. | Months | S1 | S2 | S3 | S4 |
|---|---|---|---|---|---|
| 1. | Jan. | 0.56 | 0.26 | 0.24 | 0.61 |
| 2. | Feb. | 0.59 | 0.28 | 0.25 | 0.60 |
| 3. | Mar. | 0.61 | 0.30 | 0.25 | 0.60 |
| 4. | Apr. | 0.60 | 0.31 | 0.27 | 0.63 |
| 5. | May. | 0.60 | 0.30 | 0.26 | 0.60 |
| 6. | Jun. | 0.59 | 0.23 | 0.28 | 0.62 |
| 7. | Jul. | 0.55 | 0.21 | 0.27 | 0.61 |
| 8. | Aug. | 0.58 | 0.23 | 0.30 | 0.61 |
| 9. | Sept. | 0.55 | 0.24 | 0.29 | 0.62 |
| 10. | Oct. | 0.58 | 0.24 | 0.30 | 0.64 |
| 11. | Nov. | 0.56 | 0.25 | 0.28 | 0.69 |
| 12. | Dec. | 0.62 | 0.26 | 0.28 | 0.63 |
| Mean | 0.58 | 0.26 | 0.27 | 0.62 | |
| SD | ±0.02 | ±0.03 | ±0.02 | ±0.03 |
Table text extracted from the original PDF; superscript letters are shown inline. The original table image is below.
View original table image
(2000) [10] and Gales, et al. (1966) [11] . They have done with the objective to establish a relationship between the soil types of these regions for the use of the farmers of this region. Attempt was also made so that the present study could be a small academic contribution in this field. A perusal of the present study and earlier studies by Chhabra (1993) [12] , Raghwvansh (2002) [13] and Trilochan (2004) [14] indicates that the soil types are almost the same in the chemical properties with the soil types of the Hill. But except for a few sites the physical properties including the appearance of the soil types of all these four sites namely Pushprajgarh, Anuppur, Chachai and Amlai are different. The probable reason of the similarities between the chemical properties is perhaps because in the Pushprajgarh and Anuppur almost all the soils have come from the hills due to rains and with the rivers/streams which flow from hill tops, down to the plains. The difference in the physical properties as well as in the appearance is probably due to the temperature and climatic differences in these regions.
Conclusion
Soil from the four places, viz: Pusprajgarh, Anuppur, Chachai and Amlai, exhibit, generally, differences for most of the studied. For some of the parameters the differences in properties were very wide while for some of the parameters the differences were very insignificant. The experiment was arranged with four, representative soil type of the district, so that one can predict the impact of the paper mill effluent, applied to the soil anywhere within the area of the district.
Figures and tables from the paper
References
14 in the original paper- Mishra PC, Sunandashao. Agropotentiality of paper mill waste water. Soil pollution and Soil Organism, 1989, p.97120.
- Akhan JC. Physicochemical determination of pollutants in waste water and vegetable samples along the Jakara wastewater Channelin Kano Metropolis, Kano State, Niigeria, Europian Journal scientific Research, 2008; 23:122-23.
- APHA. Standard Methods for the Examination of water and Wastewater, Washington, D.C. 20th Edition, New York, 1998.
- Makris SP, Banerjee S. Fate of resin acids in pulp mills secondary treatment systems, Water Reseach, 2002; 36:2878-82.
- Owens JW, Swanson SM, Birkholz D. Environmental monitoring of bleached kraft pulp mill chlorophenolic compounds in a Northern Canadian River System. Chemosphere. 1994; 29(1):89-109.
- Khodabakhsh Panahi Kordlaghari. "Metals concentration of soil irrigated with treated municipal wastewater effluent (TMWE) of Yasouj", Annals of Biological Research. 2013; 4(12):115-122.
- Sumithra S, Ankalaiah C, Janardhana Rao D. "Case study of physio chemical characterization of soil around industrial and agricultural area of Yerraguntla, Kadapa District, A.P, India", International Journal of Geology, Earth & Environmental Sciences, 2013; 3:8-34.
- Tan Kim H. Soil Sampling, Preparation and Analysis, Marcel Dekker, Inc. New York, 1995.
- Walkley A, Black IA. An examination of degtijareff method for determining soil organic matter and a proposed modification of the chromic acid titration method. Soil Sci, 1934; 37:29-37.
- Friedel JK, Langer T, Siebe C, Stahr K. "Effects of long-term waste water irrigation on soil organic matter, soil microbial biomass and its activities in central Mexico", Biol. Fertile. Soils, 2000; 31:414-421.
- Gales ME, Jr, Julian EC, Kroner RC. Method for quantitative determination of total phosphorus in water: American Water Works Association Journal, 1966; 58:1363-1368.
- Chhabra Gulshan. Available Micronutrient Cations as related to the Properties of Hill, Tarai and Alluvial Soils from Gola-Kosi interbasin, Ph.D. Thesis, G.B. Pant University of Agriculture and Technology Pantnagar, 1993.
- Raghwvansh Prabhat. Potassium Distribution and Agricultural Evaluation of Some Bhabar Soil of Uttaranchal, Ph.D. Thesis, G.B. Pant University of Agriculture and Technology, Pantnagar, 2002.
- Trilochan. Physico-Chemical Characteristics of the main soil types of the Bhabar region of Kumaun, Ph.D. Thesis, Kumaun University, Nainital, 2004.