
Research article · 2022 · Full text
International Journal of Advanced Chemistry ResearchHeavy metal analysis and health risk assessment of the surface irrigation water and sediment of nimo vegetable growing site, Anambra state, southeastern Nigeria
Volume 4(1) · Pages 1–9 · DOI: 10.33545/26646781.2022.v4.i1a.40 ↗
Research areasHeavy metals in environment
Abstract
Author-writtenHeavy metals pollution has been a great concern generally due to their toxicity and persistence in environment. This study evaluated the level of pollution and health risks of heavy metals in surface irrigation water used for vegetable cultivation and sediment from Nimo vegetable farm. Three samples each from three different sampling points for water and sediment were collected in dry and rainy seasons and analyzed for Pb, Cd, Mn, Fe, Zn, Cu and Ni concentrations using Atomic Absorption Spectrophotometer. The result showed that heavy metal concentrations in the irrigation water ranged from 0.004 to 0.147mg/l, 0.119 to 0.773mg/l, 0.014 to 1.644mg/l, 0.006 to 0.056mg/l, 0.009 to 0.576mg/l, 0.040 to 0.181mg/l, 0.082 to 0.147mg/l, for Cd, Pb, Fe, Cu, Zn, Mn, and Ni respectively for the different seasons. In sediment, Cu had the lowest mean concentrations of 0.02 ± 0.01mg/l while iron had the highest mean concentrations of 6.86 ± 3.06 mg/l. The obtained results were compared with Food and Agriculture Organization and the Department of Petroleum Resources standards for surface irrigation water and sediment respectively. The heavy metal distribution in water was Fe>Pb>Mn>Cd>Ni>Cu=Zn in dry and Zn>Fe>Pb>Ni>Mn>Cu>Cd rainy seasons respectively. Overall, the heavy metals level in the water and sediment were low when compared to the standards. Computed contamination factors and pollution load index showed that the sediment were not polluted while in water, only Cu, Zn, Mn and Fe (in rainy season) showed low contamination, while Ni, Pb and Cd had moderate to very high contamination in both seasons. Hazard Index values for the heavy metals in adults and children via the water and sediment of this study is less than one (HI
Summary
Source-checkedPlain-language reading of the full paper, prepared with AI and checked against the text. Each point links to the authors' own words.
Why it matters
- Heavy metal pollution is a significant environmental concern because these metals are toxic and persist in the environment. View evidence ↗
- Humans can be exposed to heavy metals by eating contaminated food crops, such as vegetables. View evidence ↗
- High exposure to heavy metals can damage critical organs, including the liver, kidneys, and lungs, and disrupt the central nervous system. View evidence ↗
The question
- The study aimed to determine the level of heavy metal pollution in the surface irrigation water and sediment at the Nimo vegetable farm and compare these levels to established standards. View evidence ↗
What they did
- Water and sediment samples were collected from three different locations during the dry season (January) and the rainy season (August). View evidence ↗
- The researchers used an Atomic Absorption Spectrophotometer to analyze concentrations of lead (Pb), cadmium (Cd), manganese (Mn), iron (Fe), zinc (Zn), copper (Cu), and nickel (Ni). View evidence ↗
- Data were statistically analyzed using one-factor analysis of variance (ANOVA) with a significance level of p < 0.05. View evidence ↗
What they found
- Generally, the levels of heavy metals found in both the irrigation water and the sediment were low relative to the compared standards. View evidence ↗
- In the sediment, iron had the highest mean concentration (6.86 ± 3.06 mg/l), while copper had the lowest (0.02 ± 0.01 mg/l). View evidence ↗
- Sediment showed low contamination for all studied metals, but in water, only copper, zinc, manganese, and iron (during the rainy season) were low; other metals showed moderate to very high contamination. View evidence ↗
- The calculated Hazard Indices (HI) were generally less than 1, indicating that exposure to these heavy metals poses no adverse health risk to adults or children. View evidence ↗
- Significant positive correlations between metals suggest that most originate from a single source, while some come from mixed sources like agricultural activities, runoff, and atmospheric deposition. View evidence ↗
What it means
- The authors conclude that the water and sediment at the Nimo site are currently at safe levels, but they recommend constant monitoring to prevent future accumulation of heavy metals. View evidence ↗
Visual summary
1 visualsIllustrations explain the paper; they do not show study data.
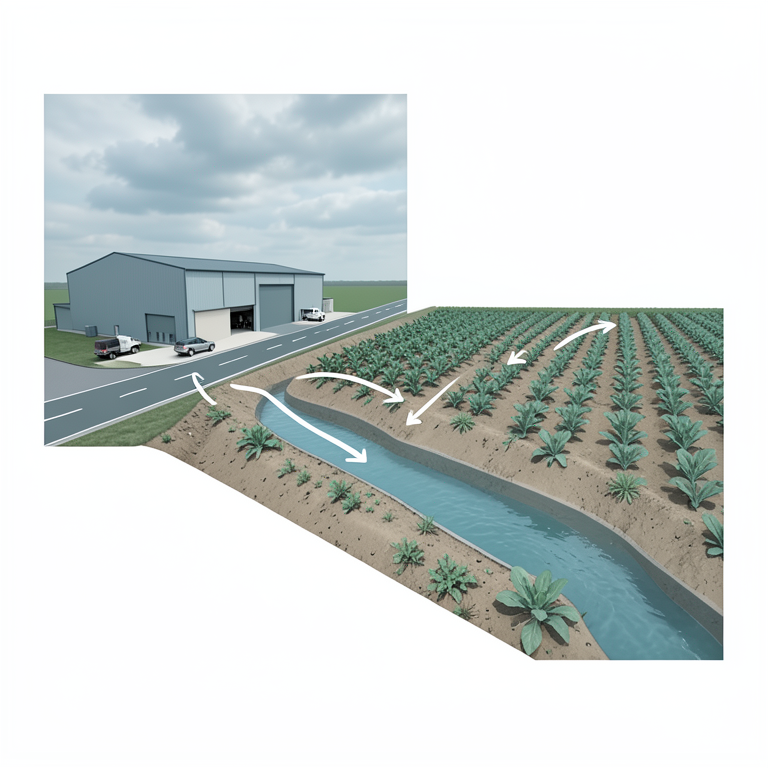
Sources of Heavy Metal Contamination
AI-generated conceptual illustration (vegetable farm with irrigation water and sediment). It explains the idea and does not show study data.
View source evidence ↗Figures & tables
From the original paper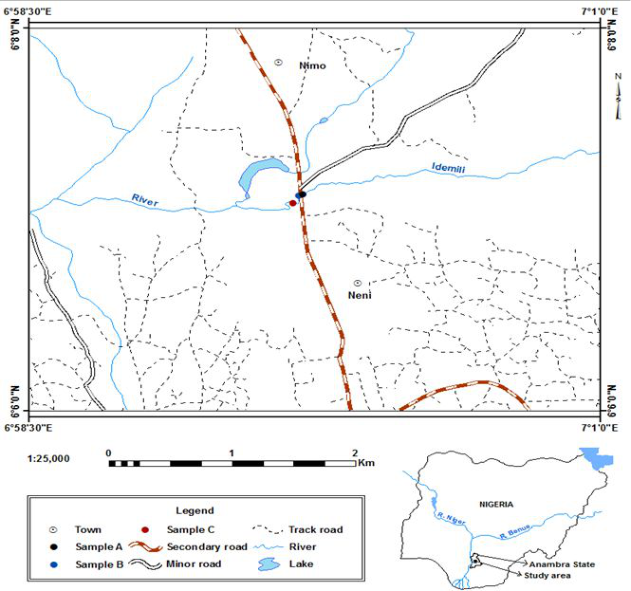 Figure 1
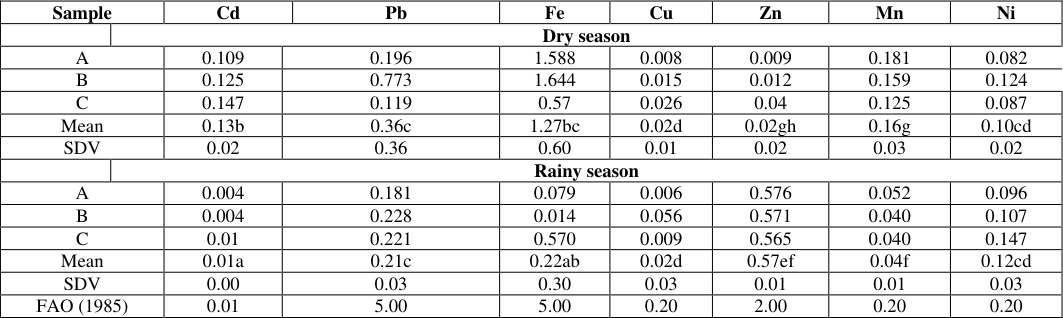 Table 1
 Table 2
 Table 3
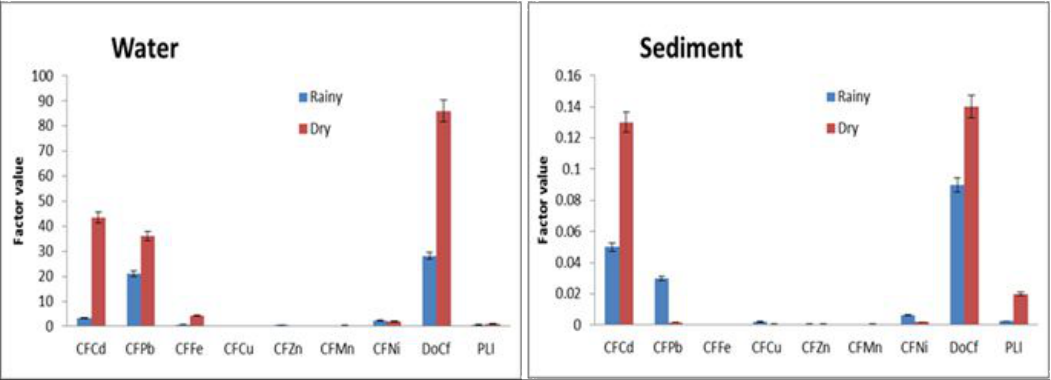 Figure 2
 Table 4
 Table 4
 Table 5
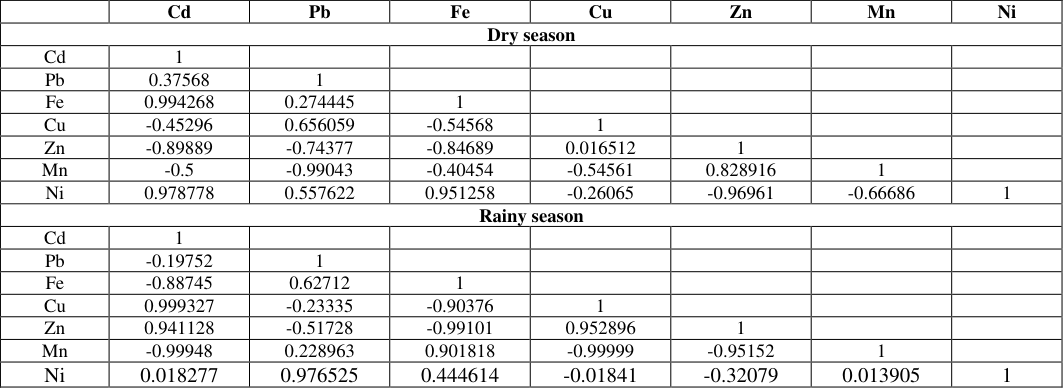 Table 6
 Table 7
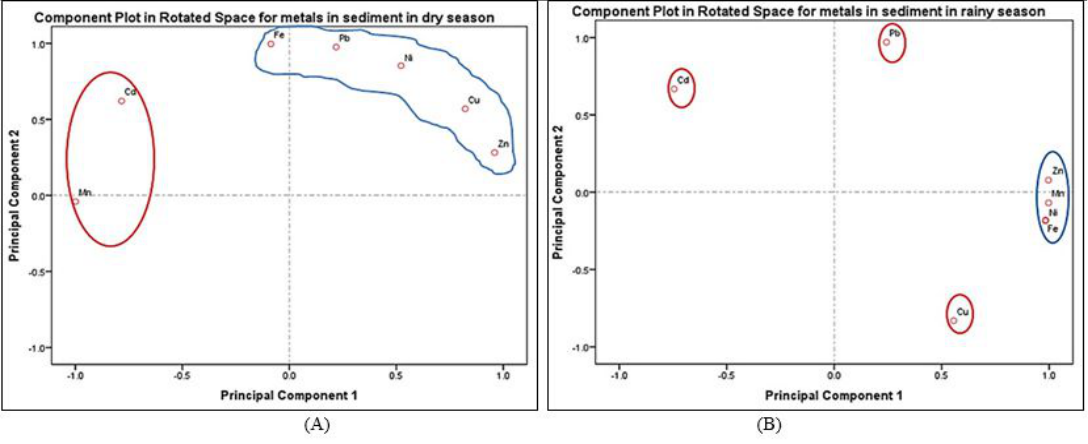 Figure 4
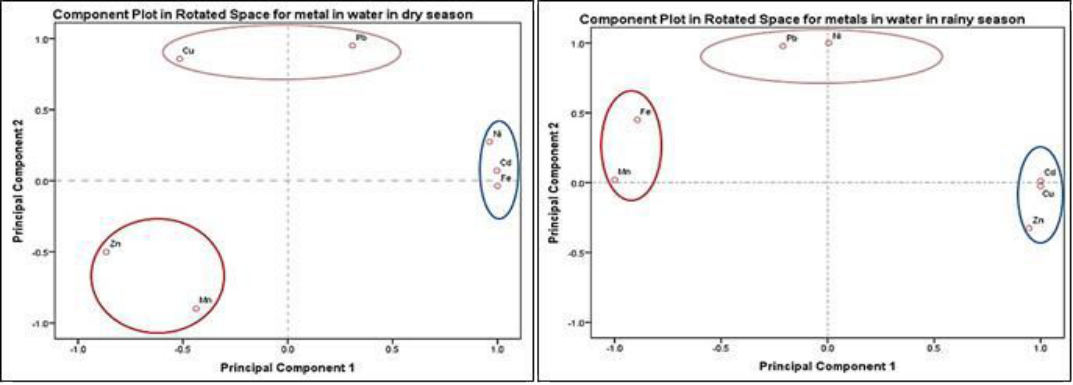 Figure 3
Introduction
Heavy metals are generally referred to as any metallic element which possess a specific density of more than about 5 g/cm3 or of high atomic weight and is toxic at low concentrations and adversely affect the environment and living organisms [1] . They are natural constituents of the Earth's crust which are release into the environment through natural and anthropogenic activities. These heavy metals are dangerous environmental pollutants because they are nonbiodegradable, bio-available and persistence in the environment [2] . Water is one of the widely distributed and abundant substances found in nature [3] . It is one of the prime necessities of life. The available natural freshwater resources today are threatened by hazard of pollution; particularly, rivers are greatly polluted due to release of untreated effluents and waste material from agricultural activities and industries located around them [4] . The contamination of soil and crops with heavy metals has been attributed to the water used for irrigation. The use of waste water for irrigation causes accumulation of heavy metals in the soil, though it can increase the crop productivity, but also increases the contamination of plants by heavy metals. Waste water from industries such as mining, electroplating, paint or chemical laboratories often contain high concentrations of heavy metals, example include cadmium (Cd), copper (Cu) and lead (Pb) [4] .
The use of waste water for irrigation without any treatment may cause adverse effect on the health of human, domestic animals, wildlife and environment [5] . Crops require sufficient irrigation for high production and irrigation water with contaminants can result to crops contamination as well. Consumption of heavy metal contaminated food crops such as vegetable is one of the routes through which human beings are exposed to heavy metals. While some heavy metals are essential in the body in small quantities such as zinc and manganese, some such as cadmium and mercury, are very toxic and have no nutritional value to man. High exposure of man to heavy metals can cause disruption or damage of the mental and central nervous systems, change blood composition, damage lungs, kidneys, livers, and other important organs [6,7,8,9] . So, it is essential to assess the status of irrigation water to ensure that it contains little or no heavy metals and other contaminants which when transferred to the crops might be harmful to health. Sediment is an important component of river line ecosystem which serves as both source and sink of heavy metals [10] . It therefore deserves a special consideration in the planning and design of pollution research studies. Sediments play an important role in the elemental cycling in the aquatic environment. They also mediate uptake, storage, release and transfer between environmental compartments. Heavy metals accumulation in the sediment directly affects benthic organisms and also influence many other organisms through food web [11] and endangers the wellbeing of aquatic ecosystem. It is therefore of great importance to assess the concentration of heavy metals in sediment. Nimo vegetable growing site supplies the public with its vegetable produce in both rainy and dry seasons. This continuous production all year round makes the Nimo vegetable site a major source of fresh produce to the surrounding areas. Also people go to this site to buy vegetables for ceremonies such as traditional marriage, burial ceremony and so on. Studies have shown that the irrigation water is often used in farms to grow vegetables and this water may be contaminated by heavy metals [12] . There have not been any existing studies on the Nimo vegetable farm site. Therefore there is a need to study this site to know the level of heavy metal pollution of the surface irrigation water and sediment which serves as the source of water for irrigation for the vegetable site and to compare it with other existing studies and standards.
Materials and method the study location
The Nimo vegetable growing site is situated along Nimo-Neni road, Nimo, in Njikoka Local Government Area, Anambra state. The irrigation water used in the site is a natural water body which is believed to be flowing from Agulu Lake, in Aniocha Local Government Area, Anambra State. The site is chosen for this study because of its extensive vegetable cultivation.
Samples collection
Water and sediment samples were collected from the surface irrigation water from three different locations of the site during the months of January (dry season) and August (rainy season). Water samples were collected by dipping 500 ml pre-cleaned polypropylene bottles into the bottom of the water body, at 30 cm depth and allowed to over flow before collecting and labeled. Sediment samples were collected by scooping with plastic hand trowel (at 0.5cm deep from the bottom of the water) and were transferred to plastic bags and labeled.
Water sample preparation and heavy metal analysis
The water samples collected were filtered using filter paper and 1 ml of 70% analytical grade concentrated trioxonitrate (V) acid was added to the water samples and stored in refrigerator until analysis.
Sediment samples preparation and heavy metal analysis. Sediment samples were air-dried for 14 days and oven dried at 70 o C to remove excess moisture until stable weights were obtained. The samples were crushed and sieved with a mesh of 2mm diameter. 0.5g of the samples each was weighed and placed in a 100ml PTFE beaker and digested using 9ml of freshly prepared aqua regia (HNO3 and HCl (1:3). After cooling, each digest was transferred to 50ml volumetric flask and made up the mark with deionized water and analyzed for Pb, Cd, Mn, Fe, Zn, Cu and Ni concentrations. The results obtained were statistically analyzed using one-factor analysis of variance (ANOVA) at p<0.05.
Contamination Factor and Pollution Load Index
The level of pollution of the samples with heavy metals was assessed by computing the contamination factor (CL) and pollution load index (PLI) adopted from [13] presented in equations 1 and 2.
Where CF is the contamination factor, PLI is pollution load index, Cm is the measured heavy metal concentration in the sample and RL is the recommended limit [14] and n is the number of metals considered in the study.
Quantitative Health Risk Assessment
An individual risk pathway as a result of human exposure to trace metals contamination could be through inhalation via the nose and mouth and dermal absorption through the skin. Therefore, the average daily dose (ADD) due to exposure to heavy metals resulting from ingestion of heavy metal contaminated water and sediment was determined using equation 3.
exposure frequency (365 days/year); DE is the exposure duration (70 years for adults and 6 years for children); BW is the average body weight (70 kg for adults; 15 kg for children); AT is the averaging time (365 days/year × 70 years for an adult; 365 days/year × 6 years for a child) as described in earlier reports [15,16] .
Hazard Quotient (HQ) and Hazard Index (HI)
Potential health risk of the population due to consumption of water and sediment samples was assessed using hazard quotient (HQ) and hazard Index (HI). HQ toxicity potential was evaluated as the ratio of average daily dose (ADD) to reference dose (RFD), expressed according to equation 4. The reference dose for the studied metals were Cu = 0.04 mg/kg/day, Mn = 0.14 mg/kg/day, Fe = 0.009 mg/kg/day, Pb = 0.0004 mg/kg/day, Ni = 0.02 mg/kg/day, Zn = 0.3 mg/kg/day, Cr = 0.003mg/kg/day and Cd =0.001 mg/kg/day [17] .
Generally, HQ ˂ 1 is assumed to be safe and taken as not significant non-carcinogenic, but HQ ˃ 1 may be a major potential health concern in association with over exposure of humans to the contaminants [18] .
Correlation analysis for metals
Using correlation analyses in environmental analytical studies have been well documented by many researchers [19] . The model furnishes important information regarding relationships between multiple parameters in a sample matrix. Heavy metals relationship in sample matrix is usually complex. Correlation analysis can help reveal information concerning the pollution and/or contamination sources of metals [20] . When correlations is high between parameter in a sample, it may suggest similar contamination or pollution source(s) e.g. petroleum-related industrial activities, dumping of waste along the river channel in the area. In this study, high and significant positive correlation (r>0.05) was observed among some of the metals.
Principal component analysis for metals
Principal component analysis was employed to determine metal pollution source(s). The study employed the Varimax rotation to maximize the sum of the variance of the factor coefficients which better explained the possible groups or sources that influence the groundwater system [21] . The classifications for the principal components (PC) loadings were done by [22] and were adopted in this study. When component loading value is > 0.75, it is regarded as "strong"; when it ranged from 0.75 to 0.50, it is considered moderate and when it ranged from 0.50 to 0.30, it is considered as "weak" [22] . Following the PCA analysis, three components (PC1, PC2, and PC3) were extracted based on their eigenvalues being greater than 1. All component plots in rotated are presented in Figures 3 and4. Where ADD is the average daily dose of metals through ingestion of sample (mg/kg/Bwday); Cw is the average concentration of the estimated metals in sample (mg/kg); RI is the ingestion rate (2.2 L/day for adults; 1.8 L/day for children) obtained; FE is.
Results and discussion Metal distribution Water
The results for heavy metal analysis in water in both dry and rainy season is presented in Table1. The obtained results were compared with [14] standards for surface irrigation water. For individual metals, Cd ranged from 0.109 mg/ l to 0.147 mg/l in dry season and from 0.004 mg/l to 0.01 mg/ l in rainy season. The mean concentrations were 0.13±0.02 mg/l (dry season) > 0.01±0.00 mg/l (rainy season), but showed significant differences (p < 0.05). Cd level in the water were high only in dry season when compared to the standard. The values obtained in the present study were similar to 0.10 mg/l obtained by [23] . Pb ranged from 0.119 mg/ l to 0.773 mg/ l in dry season and from 0.181 mg/ l to 0.228 mg/ l in rainy season. The mean concentrations were 0.36 ±0.36 mg/ l (dry season) > 0.21±0.03 mg/ l (rainy season), which also showed significant differences (p < 0.05). Overall, mean Pb level in the water were low in both season when compared to the standard. The range 1.00 to 2.00 mg/l obtained by [23] was higher than the result obtained in this study. Fe ranged from 0.57 mg/ l to 1.644 mg/l in dry season and from 0.014 mg/ l to 0.570 mg/ l in rainy season. The mean concentrations were 1.27±0.60 mg/ l (dry season) >0.22±0.30 mg/l (rainy season), which showed significant differences (p < 0.05). Overall, mean Fe level in the water were low in both seasons compared to the standard and 5.00 to 84.00 mg/l concentration range obtained by [23] . Cu ranged from 0.008 mg/ l to 0.026 mg/l in dry season and from 0.006 mg/ l to 0.056 mg/l in rainy season. The mean concentrations were 0.02±0.01 mg/L in dry and 0.02±0.03 mg/l in rainy season, which showed no significant differences (p> 0.05). Overall, Cu level in the water were low when compared to the standard, also lower than 0.30 mg/l obtained by [23] . Zn ranged from 0.009 mg/l to 0.04 mg/l in dry season and from 0.565 mg/l to 0.576 mg/l in rainy season. The mean concentrations were 0.02 ±0.02mg/l (dry season) < 0.57 ± 0.01mg/l (rainy season), which showed significant differences (p< 0.05). Overall, mean Zn level in the water were low in both seasons when compared to the standard. Mn ranged from 0.125 mg/l to 0.181 mg/l in dry season and from 0.040 mg/l to 0.052 mg/l in rainy season. The mean concentrations were 0.16 ± 0.03mg/l (dry season) > 0.04 ± 0.01mg/l (rainy season), which showed significant differences (p< 0.05). Overall, Mn level in the water were low in both seasons when compared to the standard. Ni ranged from 0.082 mg/l to 0.124 mg/l in dry season and from 0.096 mg/l to 0.147 mg/l in rainy season. The mean concentrations were 0.10 ± 0.02mg/l (dry season) < 0.12 ± 0.03 mg/l (rainy season), which showed significant differences (p < 0.05). Overall, Ni concentrations in water were low in both seasons when compared to the standard. The overall heavy metal distribution in water was Fe>Pb>Mn>Cd>Ni>Cu=Zn in dry season and Zn>Fe>Pb>Ni>Mn>Cu>Cd in rainy season.
| Sample | — | Cd | — | Pb | Fe | Cu | Zn | Mn | Ni |
|---|---|---|---|---|---|---|---|---|---|
| Dry season | |||||||||
| A | 0.109 | 0.196 | 1.588 | 0.008 | 0.009 | 0.181 | 0.082 | ||
| B | 0.125 | 0.773 | 1.644 | 0.015 | 0.012 | 0.159 | 0.124 | ||
| C | 0.147 | 0.119 | 0.57 | 0.026 | 0.04 | 0.125 | 0.087 | ||
| Mean | 0.13b | 0.36c | 1.27bc | 0.02d | 0.02gh | 0.16g | 0.10cd | ||
| SDV | 0.02 | 0.36 | 0.60 | 0.01 | 0.02 | 0.03 | 0.02 | ||
| Rainy season | |||||||||
| A | 0.004 | 0.181 | 0.079 | 0.006 | 0.576 | 0.052 | 0.096 | ||
| B | 0.004 | 0.228 | 0.014 | 0.056 | 0.571 | 0.040 | 0.107 | ||
| C | 0.01 | 0.221 | 0.570 | 0.009 | 0.565 | 0.040 | 0.147 | ||
| Mean | 0.01a | 0.21c | 0.22ab | 0.02d | 0.57ef | 0.04f | 0.12cd | ||
| SDV | 0.00 | 0.03 | 0.30 | 0.03 | 0.01 | 0.01 | 0.03 | ||
| FAO (1985) | 0.01 | 5.00 | 5.00 | 0.20 | 2.00 | 0.20 | 0.20 |
Table text extracted from the original PDF; superscript letters are shown inline. The original table image is below.
View original table image
Sediment
The results for heavy metal analysis in sediment in both dry and rainy season is presented in Table 2. The obtained results were compared with a standard [24] . For individual metals, Cd ranged from 0.081 mg/kg to 0.111 mg/kg in dry season and from 0.024 mg/kg to 0.056 mg/kg in rainy season. The mean concentrations were 0.10 ± 0.02 mg/kg (dry season) >0.04 ±0.02mg/kg (rainy season), but showed significant differences (p < 0.05). Cd level in the sediment were low in both seasons when compared to the standard and also to 0.20-0.28mg/kg obtained by [25] . Pb ranged from 0.005 mg/kg to 0.296 mg/kg in dry season and from 2.463 mg/kg to 2.803 mg/kg in rainy season. The mean concentrations were 0.15±0.15 mg/kg (dry season) < 2.62 ± 0.17mg/kg (rainy season), which also showed significant differences (p < 0.05). Overall, mean Pb level in the sediment were low in both season when compared to the standard and to 10.71-14.26 mg/kg obtained by [25] . Fe ranged from 4.787 mg/kg to 10.377 mg/kg in dry season and from 4.674 mg/kg to 7.434 mg/kg in rainy season. The mean concentrations were 6.86 ± 3.06mg/kg (dry season) > 5.67±1.53 mg/kg (rainy season), which showed significant differences (p< 0.05). Overall, the mean Fe concentrations in the sediment were low in both seasons when compared to the standard. Cu ranged from 0.004 mg/kg to 0.027 mg/kg in dry season and from 0.056 mg/kg to 0.100 mg/kg in rainy season. The mean concentrations were 0.02±0.01mg/kg in dry < 0.08±0.02 mg/kg rainy season, which showed significant differences (p< 0.05). Overall, Cu level in the sediment were low when compared to the standard. Zn ranged from 0.006 mg/kg to 0.098 mg/kg in dry season and from 0.012 mg/kg to 0.123 mg/kg in rainy season. The mean concentrations were 0.05 ± 0.05mg/kg (dry season) >0.07 ± 0.06 mg/kg (rainy season), which showed no significant differences (p> 0.05). Overall, mean concentrations of Zn in the sediment were low in both seasons when compared to the standard. Mn ranged from 0.275 mg/kg to 0.628 mg/kg in dry season and from 0.194 mg/kg to 0.296 mg/kg in rainy season. The mean concentrations were 0.42 ±0.19 mg/kg (dry season) >0.25 ±0.05 mg/kg (rainy season), which showed significant differences (p < 0.05). Overall, Mn level in the sediment were low when compared to the standard. Ni ranged from 0.030 mg/kg to 0.165 mg/kg in dry season and from 0.193 mg/kg to 0.241 mg/kg in rainy season. The mean concentrations were 0.07 ± 0.08 mg/kg (dry season) < 0.22 ± 0.02 mg/kg (rainy season), which showed significant differences (p< 0.05). Overall Ni level in the sediment were low when compared to the standard.
| Sample | Cd | — | — | Pb | Fe | Cu | Zn | Mn | Ni |
|---|---|---|---|---|---|---|---|---|---|
| Dry season | |||||||||
| A | 0.111 | 0.296 | 5.417 | 0.004 | 0.039 | 0.354 | 0.030 | ||
| B | 0.098 | 0.005 | 4.787 | 0.019 | 0.006 | 0.275 | 0.014 | ||
| C | 0.081 | 0.141 | 10.377 | 0.027 | 0.098 | 0.628 | 0.165 | ||
| Mean | 0.10b | 0.15bc | 6.86bb | 0.02ad | 0.05a | 0.42dd | 0.07ef | ||
| SDV | 0.02 | 0.15 | 3.06 | 0.01 | 0.05 | 0.19 | 0.08 |
Table text extracted from the original PDF; superscript letters are shown inline. The original table image is below.
View original table image
Contamination and pollution modeling
The contamination factors, degree of contamination and pollution load index for the studied metals are presented in Figures 2a andb. The contamination factors were categorized according to [26]. Values with CF< 1 are low contamination, 1≤CF<3 are moderately contaminated, 3≤ CF ≤ 6 are considerably contaminated and CF≥ 6 very highly contaminated. In water, only Cu, Zn, Mn and Fe (in rainy season) showed low contamination, other metals had moderate to very high contamination in both seasons (Figure 2a) while the sediment showed low contamination for the studied metals. These suggest that the bottom sediment are yet to be contaminated by heavy metals and may pose no risks from usage.
Quantitative health risk assessment Average daily dose (ADD)
The ADD of the studied metals for adult and children was computed and results presented in Table 3. Higher heavy metal intake from the consumption was calculated for adult than for children. Heavy metal consumption increased in the order Fe >Pb> Zn > Ni >Mn> Cu > Cd for both adult and children. Many studies have shown that children are mostly at higher risk of exposure to heavy metals from different media more than adult, mainly due to their body sizes [8,11] .
| Media | Metals | — | — | — | — | — | — | — | — | — | — | — | — | — |
|---|---|---|---|---|---|---|---|---|---|---|---|---|---|---|
| Cd | Pb | Fe | Cu | Zn | Mn | Ni | ||||||||
| Adult | Children | Adult | Children | Adult | Children | Adult | Children | Adult | Children | Adult | Children | Adult | Children |
Table text extracted from the original PDF; superscript letters are shown inline. The original table image is below.
View original table image
The ADD obtained from this study would however not pose any significant health risk to adults and children as they are all less than 1 except for Fe in sediment in dry season (1.78).
Hazard quotient (HQ) and hazard index (HI)
The result for the calculated HQ and HI is presented in Table 4 and 5, which generally showed higher values for adult than children. For HQ and HI > 1, it indicate potential adverse health effect of a single heavy metal to adult and/or children from intake via the different pathways while for HI, it indicate potential non-carcinogenic risk concern for all heavy metals intake by adult or children. All metal HQs were generally less than 1 (Table 4), which indicated no potential adverse health risk associated with the studied heavy metals. For sediment, the highest and lowest HQs were shown by Fe and Mn while higher HQs were obtained in the dry season than in rainy season. For water, the highest and lowest HQs were shown by Pb and Mn while higher HQs was obtained in the dry season compared to rainy season. The calculated hazard indices (HI) were generally less than 1 (Table 5). These indicated no adverse health risk associated with exposure of the studied heavy metals to adult and children. 6). Some studies have obtained similar results for some of the metal relationships in water [20,27] . 7). Some studies have obtained similar results for some of the metal relationships in sediment [19]. strong correlations which are likely from the same source while other metals were from mixed sources including atmospheric deposition, agricultural activities and runoff from roads during rainfall. Similar relationships were exhibited by the metals in both seasons shown in Figure 3.
| Media | Hazard Index(HI) | — |
|---|---|---|
| Adults | Children | |
| Dry season | ||
| Water | 3.62E-01 | 3.11E-01 |
| Sediment | 6.17E-01 | 2.33E-01 |
| Rainy season | ||
| Water | 8.56E-01 | 5.51E-02 |
| Sediment | 1.01E+00 | 8.57E-01 |
Table text extracted from the original PDF; superscript letters are shown inline. The original table image is below.
View original table image
| — | — | — | Metals | — | — | — | — | — | — | — | — | — | — | — |
|---|---|---|---|---|---|---|---|---|---|---|---|---|---|---|
| Media | Cd | Pb Fe Cu | Zn | Mn | Ni | |||||||||
| Adults | Adults Children Adults ChildrenAdults | Adults | Adults | Adult | Children | |||||||||
| Dry season | ||||||||||||||
| Water | 3.14E-3 1.2E-3 | 0.15 0.05 7E-1 3E-3 1.57E-4 | 6E-4 | 7.14E-5 7.14E-5 | 2E-3 | 0.50E-3 | ||||||||
| Sediment | 0.01 4.8E-3 | 0.82 0.78 0.18 0.07 7.5E-4 | 6.67E-5 2.8E-5 | 5.71E-4 2.86E-4 | 3.5E- | 1.5E-3 | ||||||||
| Rainy season | ||||||||||||||
| Water | 0.04 | 0.01 | 0.28 | 0.10 | 0.0 | 0.2 | 1.57E- | 6E-5 | 2.27E- | 8E-6 | 3.57E | 1.43E- | 1.5E- | 0.45E-3 |
| Sediment | 6.28E | 2.4E-3 | 0.13 | 0.05 | 0.4 | 0.18 | 1.57E- | 6E-5 | 6.67E- | 2E-5 | 1.43E | 4.29E- | 3.14E | 0.12E-3 |
Table text extracted from the original PDF; superscript letters are shown inline. The original table image is below.
View original table image
| Dry season | — | — | — | — | — | — | — | — | — | — | — | — | — | — |
|---|---|---|---|---|---|---|---|---|---|---|---|---|---|---|
| Water | 3.14E-3 | 1.2E-3 | 0.06 | 0.02 | 0.07 | 0.03 | 6.28E-3 | 2.4E-3 | 0.18 | 0.07 | 0.01 | 4.8E-3 | 0.04 | 0.01 |
| Sediment | 0.01 | 4.8E-3 | 0.82 | 0.31 | 1.78 | 0.68 | 0.03 | 8.5E-3 | 0.02 | 8.4E-3 | 0.08 | 0.04 | 0.07 | 0.03 |
| Rainy season | ||||||||||||||
| Water | 0.04 | 0.01 | 0.11 | 0.04 | 0.39 | 0.15 | 6.28E-3 | 2.4E-3 | 6.28E-3 | 2.4E-3 | 0.05 | 0.02 | 0.03 | 9E-3 |
| Sediment | 6.28E-3 | 2.4E-3 | 0.05 | 0.02 | 0.48 | 0.18 | 6.28E-3 | 2.4E-3 | 0.02 | 6E-3 | 0.02 | 6E-3 | 6.28E-3 | 2.4E-3 |
Table text extracted from the original PDF; superscript letters are shown inline. The original table image is below.
View original table image
Sediment
Two components of metals were extracted; PC1 had 67.981 % and 72.169 % of total variance in dry and rainy season respectively while total variance was 100 % for PC2 in both seasons respectively. Again in sediment, Fe, Pb, Cu, Ni and Zn showed strong correlations which are likely from the same source while other metals were from mixed sources including atmospheric deposition, agricultural activities and runoff from roads during rainfall (Figure 4). In rainy season Zn, Mn, Ni and Fe showed strong correlations while other metals were from mixed sources shown in Figure 4.
Conclusion
The study has successfully characterized the level of heavy metal (Fe, Pb, Mn, Zn, Ni, Cu and Cd) pollution of water and sediment collected from a vegetable cultivation site in Nimo, Anambra State. The concentrations of heavy metals generally vary seasonally with general higher concentrations in dry season. The sediment heavy metal concentrations were generally low in both seasons when compared to DPR standard. The highest and lowest concentrations were shown by Fe and Ni respectively. The possible sources of pollution of the surface irrigation water were from anthropogenic origin (municipal wastes, atmospheric deposition and agricultural activities) were deposited on the site or were brought to the site by the water from its source. The contamination factors for metals were low in sediment. In water, only Cu, Zn, Mn and Fe (in rainy season) showed low contamination, other metals had moderate to very high contamination in both seasons. The average daily dose estimation showed higher heavy metal intake which increased in the order Fe >Pb> Zn > Ni >Mn> Cu > Cd for both adult and children. The hazard quotient and index of metals via the different media were generally less than 1 showing no potential health risks of heavy metals to adult and children. Correlation analysis for metals in water and sediment showed significant and positive relationships amongst the metals which indicated that the most of the metals originate from the same source while few originate from mixed sources mainly from agricultural activities, atmospheric deposition and runoff into the irrigation water. Overall, the sediment and water from Nimo vegetable site are at safe levels currently but needed constant examination to avoid future heavy metal accumulation.
Figures and tables from the paper
| — | Cd | Pb | Fe | Cu | Zn | Mn | Ni |
|---|---|---|---|---|---|---|---|
| Dry season | |||||||
| Cd | 1 | ||||||
| Pb | 0.37568 | 1 | |||||
| Fe | 0.994268 | 0.274445 | 1 | ||||
| Cu | -0.45296 | 0.656059 | -0.54568 | 1 | |||
| Zn | -0.89889 | -0.74377 | -0.84689 | 0.016512 | 1 | ||
| Mn | -0.5 | -0.99043 | -0.40454 | -0.54561 | 0.828916 | 1 | |
| Ni | 0.978778 | 0.557622 | 0.951258 | -0.26065 | -0.96961 | -0.66686 | 1 |
| Rainy season | |||||||
| Cd | 1 | ||||||
| Pb | -0.19752 | 1 | |||||
| Fe | -0.88745 | 0.62712 | 1 | ||||
| Cu | 0.999327 | -0.23335 | -0.90376 | 1 | |||
| Zn | 0.941128 | -0.51728 | -0.99101 | 0.952896 | 1 | ||
| Mn | -0.99948 | 0.228963 | 0.901818 | -0.99999 | -0.95152 | 1 | |
| Ni | 0.018277 | 0.976525 | 0.444614 | -0.01841 | -0.32079 | 0.013905 | 1 |
Table text extracted from the original PDF; superscript letters are shown inline. The original table image is below.
View original table image
| — | Cd | Pb | Fe | Cu | Zn | Mn | Ni |
|---|---|---|---|---|---|---|---|
| Dry season | |||||||
| Cd | 1.000 | .434 | .686 | -.291 | -.577 | .758 | .120 |
| Pb | 1.000 | .953 | .736 | .485 | -.258 | .947 | |
| Fe | 1.000 | .496 | .198 | .046 | .805 | ||
| Cu | 1.000 | .949 | -.844 | .915 |
Table text extracted from the original PDF; superscript letters are shown inline. The original table image is below.
View original table image
References
28 in the original paper- Jarup L. Hazards of heavy metal contamination. British Medical Bulletin. 2003:68:167-182.
- Briffa, J, Sinagra E, Blundell R. Heavy metal pollution in the environment and their toxicological effects on humans. Heliyon. 2020:6(9):2405-8440.
- Mullen KCPG. Information on Earth's water. National Ground Water Association 601 Dempsey road, Wester Ville, United States. From ngwa.Org, 2012,
- Suruchi k, Khanna P. Assessment of heavy metal contamination in different vegetables grown in and around urban areas. Research Journal of Environmental Toxicology. 2011:5:162-179.
- Sharma KP, Sharma K, Bhardwaj SM, chaturvedi RK. Environment impact assessment of textile printing industries in sanganer, Jaipur: A case study. Journal of Indian Botanical Society. 1999:78:71.
- Cope CM, Mackenzie AM, Wilde D, Sinclair LA. Effects of level and form of dietary zinc on dairy cow performance and health. Journal of Dairy Science. 2009:92(5):2128-2135.
- Kampa M, Castanas E. Human health effects of air pollution. Journal of Environmental Pollution,2008:151:362-367.
- Reglero MM, Taggart MA, Monsalve-González L, Mateo R. Heavy metal exposure in large game from a lead mining area: effects on oxidative stress and fatty acid composition in liver. Journal of Environmental Pollution,2009:157:1388-1395.
- Sadik NA. Effects of daily sulfide and zinc on testicular steroidogenesis in cadmium-treated male rats. Journal of Biochemical and Molecular Toxicology,2008:22:(5):345-53.
- Pejman A, Bidhendi GN, Ardestani M, Saeedi M, Baghvand A. A new index for assessing heavy metals contamination in sediments: A case study. Journal of Ecological Indicators. 2015:58:365-373.
- Fu J, Zhao C, Lou Y, Liu C, Kyzas GZ, Luo Y et al. Heavy metals in surface sediments of the Jialu River, China: their relations to environmental factors, Journal of Hazardous Materials,2014:270:102-109.
- Isiuku BO, Enyoh CE. Monitoring and medeling of heavy metal contents in vegetables collected from markets in Imo State, Nigeria. Journal of Environmental Analysis, Health and Toxicology,2020:35:1.
- Forstner U, Ahlf W, Calmono W. Sediment quality objectives and criteria development in Germany. Journal of Water Resources and Technology,1993:28(89):307-316.
- FAO. Water Quality for Agriculture, Food and Agriculture Organization, Rome, Italy, 1985. http://www.fao.org/3/To2344/T0234E00.htm.
- Lele KC, Verla AW, Amobi CE, Ajero AI, Enyoh CE, Verla EN. Health risks of consuming untreated borehole water from uzoubi Umunna Orlu, Imo State Nigeria. Journal of Environment and Analytical Chemistry,2018:55(4):1-7.
- Ibe FC, Opara AI, Ibe BO, Adindu BC, Ichu BC. Environmental and Health Implications of trcae metal concentrations in street dust around some electronic repair workshops in Owerri South eastern Nigeria. Environmental monitoring and Assessment,2019:190(696):1-14.
- USEPA. Lead and Copper Rule Revisions white paper. US-Environmental Protection Agency, Washington DC: Office of water,2016:10:26.
- Bleam WF. Risk Assessment. Soil and Environmental Chemistry. Elsevier, 2012.
- Verla AW, Verla EN, Chigbo MA, Kelechi CL, Ngozi OS, Enyoh CE. Biomonitoring of heavy metals in blood and urine of African children from Owerri Metropolis, Eastern Nigeria. Journal of Chemical Health Risks,2019:9(1):11-26.
- Enyoh CE, Verla AW, Egejuru NJ. Ph variations and chemometric assessment of borehole water in Orji, Owerri, Imo State, Nigeria. Journal of Environment Analytical Chemistry,2018:5(2):1-9.
- Eze VC, Onwukeme VI, Enyoh CE. Pollution status, ecological and human health risks of heavy metals in soil from some selected active dumpsites in Southeastern, Nigeria using energy dispersive X-ray spectrometer, International Journal of Environmental Analytical Chemistry, 2020.
- Eze VC, Enyoh CE, Ndife CT. Soil Cationic Relationships, Structural and Fertility Assessment within selected active dumpsites in Nigeria, Chemistry Africa, 2020. https://doi.org/10.1007/s42250-02000194-9
- Liu CW, Lin KH, Kuo YM. Application of factor analysis in the assessment of ground water quality in a Blackfoot disease area in Taiwan. Science of the Total Environment,2003:313:77-89.
- Maleki A, Gharibi F, Alimohammadi M, Daraei H, Zandsalimi Y. Concentration levels of heavy metals in irrigation water and vegetables grown in peri-urban areas of Sanandaj, Iran. Journal of Advances in Environmental Health Research,2014:1(2):81-88.
- DPR. Environmental guidelines and standard for the petroleum industry in Nigeria. Department of Petroleum and Resources (AGASPIN), 2002, 320.
- Sigh H, Pandey R, Sigh SK, Shukla DN. Assessment of heavy metal contamination in the sediment of the River Ghaghara, a major tributary of the River Ganga in Northern India. Journal of Applied Water Science. 2017;7(7):4133-4149.
- Verla EN, Verla AW, Enyoh CE. Pollution assessment models of surfcae soil in Port Harcourt City, Rivers State, Nigeria. World News Natural Science. 2017;12:1-20.
- Eze VC, Ndife CT, Muogbo MO. Carcinogenic and non-carcinogenic health risk assessment of heavy metals in Njaba River, Imo State, Nigeria. Braz J Anal Chem; 2021.
Cited by 1
From OpenAlex, OpenCitations and reference lists read by Scinovex
- Domestic water quality associated with heavy metals and impact on human health according to body mass index (BMI) in Kebbi state, Nigeria ↗
Dimas Skam Joseph, Dimas Skam Joseph, Rabiu Nasiru, Nuraddeen Nasiru Garba, Muhammad Isma’il, Joseph Dlama Zira et al. · Results in Chemistry · 2024
Heavy metals pollution is associated with various forms of deleterious effects to the ecosystem. The aim of this study was to quantify Cu, Mn, Cd, Zn, Ni, Pb, Co, Fe, Cr, and As in ground water and assess its impact on human health when used for domestic purpose. Eighteen ground water samples were collected, prepared and analyzed using Agilent technology…
❝ 5PDF