
Research article · 2022 · Full text
International Journal of Advanced Chemistry ResearchEconomic analysis of processing of green gram mill’s in Maharashtra
Volume 4(2) · Pages 242–247 · DOI: 10.33545/26646781.2022.v4.i2d.105 ↗
Research areasAgricultural Economics and Practices
Abstract
Author-writtenAgriculture and industry have traditionally been viewed as two separate sectors both in terms of their characteristics and their role in economic growth. The agro-processing industries place a huge demand on agricultural raw materials. The primary data was collected by personal interviewing processor. Therefore the attempt was done to estimate per unit cost and returns of processing unit. An attempt, also been done to determine the break-even point of agro processing unit and optimum size of value addition in green gram. In the light of the empirical evidences brought out from the study, the following result are drawn. In almost all size groups of green gram mills, the investment in land constituted the main items of investment followed by machinery and factory building. Per quintal total cost was decrease with increase in size of green gram mills. The net return per quintal for green gram processing was found to be higher in case of large size mills as compared to medium and small mills. Benefit cost ratio was also found to be higher in large sized mills. Benefit cost ratio of agriculture industry is less because of huge initial investment in the processing industry but actual profit is more because of bulk quantity of production. To estimated break – even quantity was increase with the increase in the size of processing mills. Value addition in processing of green gram was higher in large sized followed medium and small green gram mills.
Summary
Source-checkedPlain-language reading of the full paper, prepared with AI and checked against the text. Each point links to the authors' own words.
Why it matters
- India is a leading global producer of green gram, cultivating approximately 36 lakh hectares to produce about 17 lakh tonnes of grain. View evidence ↗
- Green gram is a significant pulse crop valued for being a rich source of high-quality protein. View evidence ↗
- Agro-processing industries drive agricultural development in India by creating high demand for raw materials. View evidence ↗
The question
- The study aimed to estimate the per-unit cost and returns, determine the break-even point, and analyze value addition for green gram processing units. View evidence ↗
What they did
- Data was collected via personal interviews and surveys from randomly selected processors in the Akola, Latur, Amravati, and Buldhana districts of Maharashtra. View evidence ↗
- Ten processing units were randomly selected and categorized by capacity: small (5-30 q/day), medium (30-60 q/day), and large (60-120 q/day). View evidence ↗
What they found
- Land was the primary capital investment across all mill sizes, contributing 53.53% in small, 54.19% in medium, and 41.48% in large mills. View evidence ↗
- Processing costs decreased as mill capacity increased, falling from Rs. 307.57 per quintal in small units to Rs. 177.43 per quintal in large units. View evidence ↗
- Net returns per quintal were highest in large mills (Rs. 218.49), followed by medium (Rs. 193.91) and small mills (Rs. 187.40). View evidence ↗
- The benefit-cost ratio increased with mill size, ranging from 1.030 for small units to 1.037 for large units. View evidence ↗
- The break-even quantity as a percentage of actual processed volume decreased as mill size increased, from 52.08% in small mills to 35.18% in large mills. View evidence ↗
- Value addition per quintal was highest in large mills (Rs. 548.62 or 10.15% of raw material cost), compared to medium (Rs. 477.80) and small mills (Rs. 449.71). View evidence ↗
What it means
- The authors conclude that green gram milling exhibits economies of scale, as total cost per quintal decreases with increased installed capacity. View evidence ↗
- The authors recommend that the government provide subsidies for processing machinery and improve infrastructure to support processors. View evidence ↗
- The study notes that capacity utilization was limited by the seasonal and inadequate availability of raw green gram. View evidence ↗
Visual summary
2 visualsIllustrations explain the paper; charts are replotted from the paper's own table values.
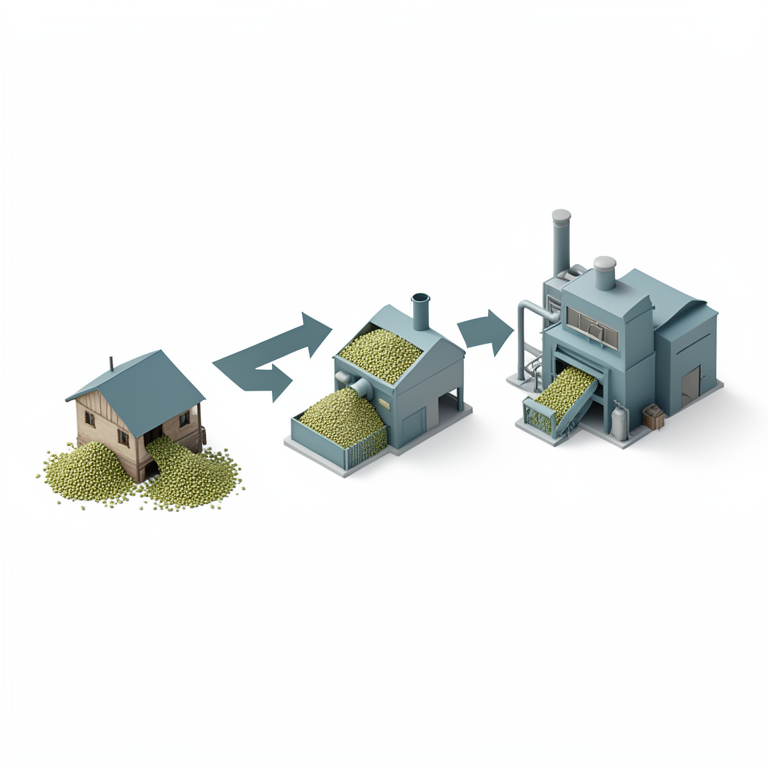
Economies of Scale in Green Gram Processing
AI-generated conceptual illustration (green gram processing mills). It explains the idea and does not show study data.
View source evidence ↗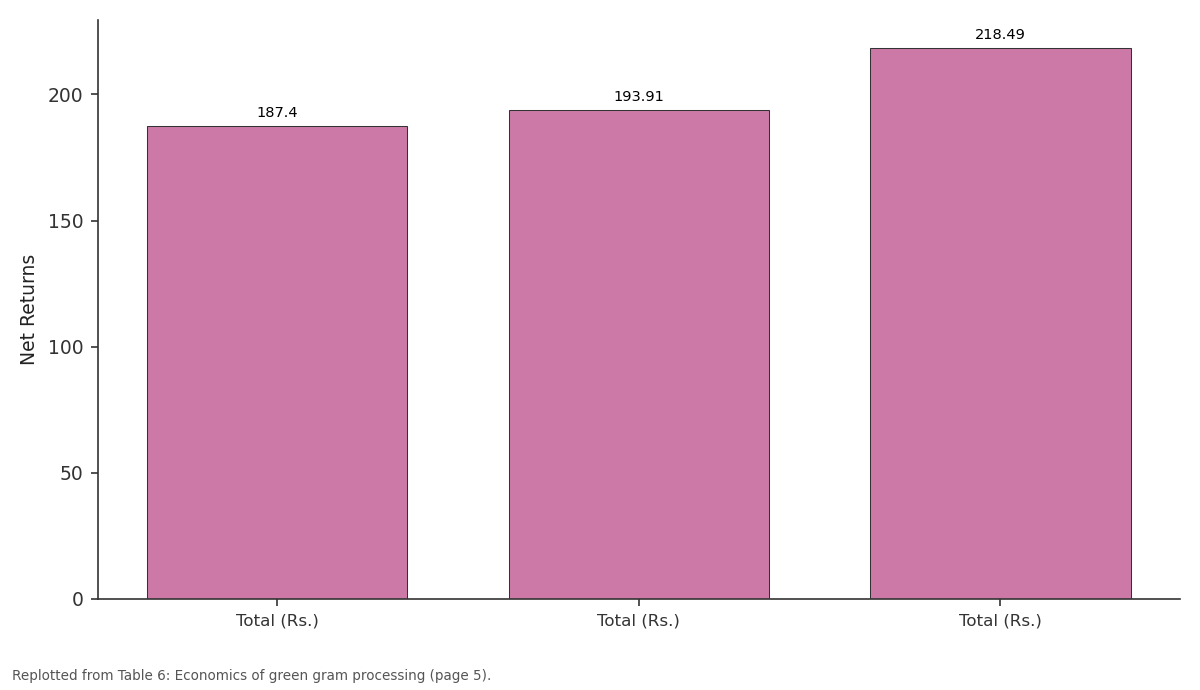
Net Returns: Total (Rs.) vs Total (Rs.) vs Total (Rs.)
Replotted from Table 6 (page 5) of the original paper. Every bar is the paper's own table value.
View source evidence ↗Figures & tables
From the original paper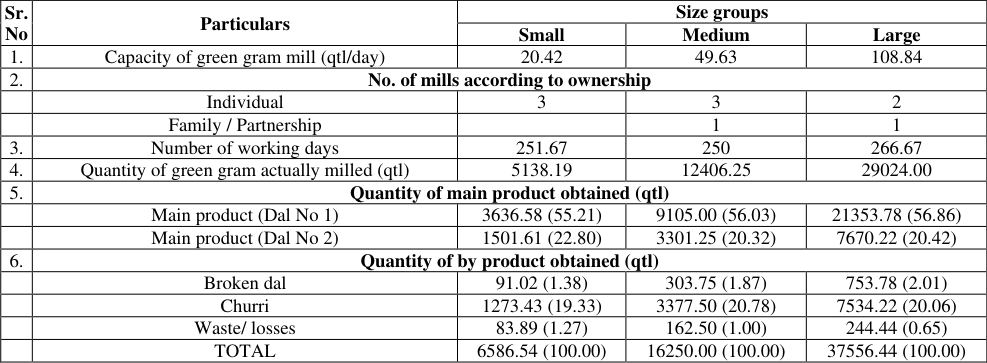 Table 1
 Table 2
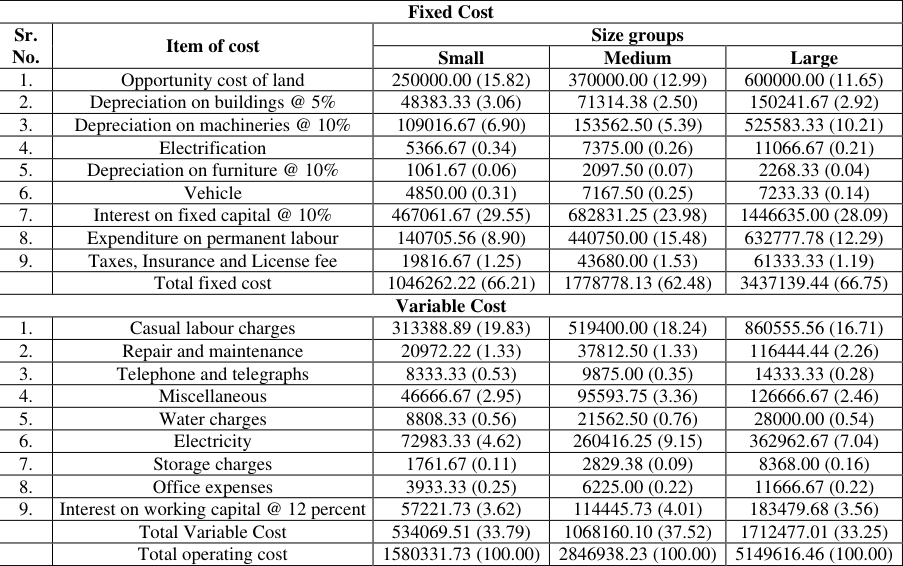 Table 3
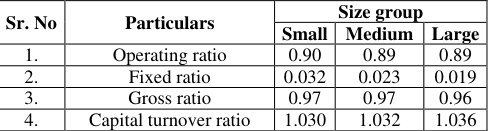 Table 4
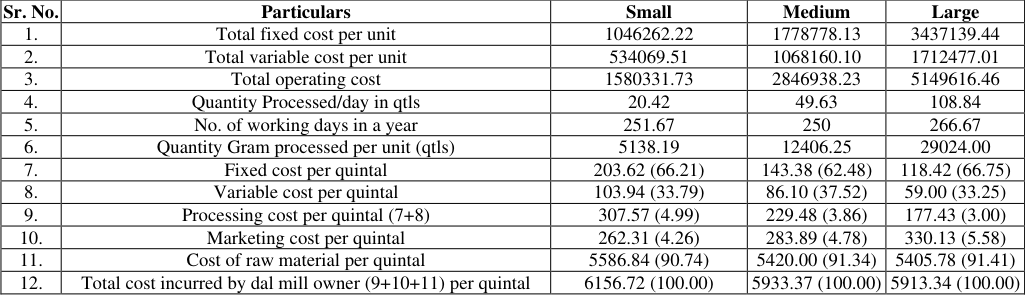 Table 5
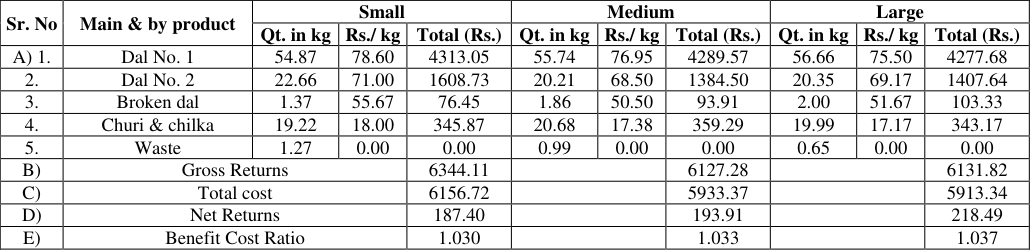 Table 6
 Table 7
 Table 8
Introduction
India is the major producer of green gram in the world and grown in almost all the States. It is grown in about 36 lakh hectares with the total production of about 17 lakh tonnes of grain with a productivity of about 500 kg/ha. Green gram is important pulse crop. It is very rich source of high quality protein. It is quite common in India and Central Asia. Green gram is an excellent source of high quality protein with easy digestibility, consumed as whole The primary data in respect of cost of processing by processors in production was collected. Small processing unit with a capacity 5-30 q/day. Medium processing unit with a capacity 30 to 60 q/day and large processing unit with a capacity 60-120q/day. Ten processing units were selected randomly from the available processing units.
Techniques of Data Analysis
The cost and return of processing unit was worked out by using simple tabular analysis and benefit-cost ratio. The financial test ratio viz. operating ratio, fixed ratio, gross ratio and capital turn-over ratio. The break-even volume of output is determined with the help of following formula.
TFC Q = -------------(P-AVC)
Where Q = Quantity of processed green gram in quintals required for break-even. TFC = Total fixed cost P = Price (Processing charges) per quintal AVC = Average variable cost of processing per quintal Value addition is a difference between price for which a processing industry sold its green gram product and the cost incurred on the purchased inputs by it. This difference represented the value addition by the productive activities of the processing unit. Value addition is calculated with the help of following formula.
Value addition = Selling price of the product -Cost of the total inputs.
Result Discussion
The present study was undertaken with a view to workout costs and returns, break-even point and value addition in green gram.
Economics of processing of green gram
Industries require huge capital investment, the ownership reflects the availability of capital to install the industry. The capacity and ownership structure plays vital role in processing of green gram as it has direct impact on cost and quantity involved in processing of green gram. Therefore an attempt was made to study the capacities and ownership structure of green gram dal processing mills and results are presented in table 1.
| Sr. No | Particulars | Size groups | — | — |
|---|---|---|---|---|
| Small | Medium | Large | ||
| 1. | Capacity of green gram mill (qtl/day) | 20.42 | 49.63 | 108.84 |
| 2. | No. of mills according to ownership | |||
| Individual | 3 | 3 | 2 | |
| Family / Partnership | 1 | 1 | ||
| 3. | Number of working days | 251.67 | 250 | 266.67 |
| 4. | Quantity of green gram actually milled (qtl) | 5138.19 | 12406.25 | 29024.00 |
| 5. | Quantity of main product obtained (qtl) | |||
| Main product (Dal No 1) | 3636.58 (55.21) | 9105.00 (56.03) | 21353.78 (56.86) | |
| Main product (Dal No 2) | 1501.61 (22.80) | 3301.25 (20.32) | 7670.22 (20.42) | |
| 6. | Quantity of by product obtained (qtl) | |||
| Broken dal | 91.02 (1.38) | 303.75 (1.87) | 753.78 (2.01) | |
| Churri | 1273.43 (19.33) | 3377.50 (20.78) | 7534.22 (20.06) | |
| Waste/ losses | 83.89 (1.27) | 162.50 (1.00) | 244.44 (0.65) | |
| TOTAL | 6586.54 (100.00) | 16250.00 (100.00) | 37556.44 (100.00) |
Table text extracted from the original PDF; superscript letters are shown inline. The original table image is below.
View original table image
Annual cost structure of green gram mills
Table 3, presents the item wise annual cost structure of the average green gram dal mills belonging to different size groups. The examination of the annual cost structure of the average green gram dal mill over the size group revealed that the per dal mill absolute amount of cost on account of almost all the items of cost increased with the increase in size of dal mills, so also, the relative share of individual items of cost in the total cost, also found to be increase except the depreciation on building and cost of water and storage charges. It is thus quite evident that the proportionate share of fixed cost in the total cost of green gram milling showed the increasing trend, while that of variable cost showed the decreasing trend. This could be related to the actual quantity processed by the mills over the size group. As the quantity processed over the size group found to be increasing so as the total fixed cost found to be increasing. The increased quantum of green gram processed over the size group lowered the total variable cost over the size group indicated the cost-efficiency in variable cost which was quite obvious.
| Fixed Cost | — | — | — | — |
|---|---|---|---|---|
| Sr. No. | Item of cost | Size groups | ||
| Small | Medium | Large | ||
| 1. | Opportunity cost of land | 250000.00 (15.82) | 370000.00 (12.99) | 600000.00 (11.65) |
| 2. | Depreciation on buildings @ 5% | 48383.33 (3.06) | 71314.38 (2.50) | 150241.67 (2.92) |
| 3. | Depreciation on machineries @ 10% | 109016.67 (6.90) | 153562.50 (5.39) | 525583.33 (10.21) |
| 4. | Electrification | 5366.67 (0.34) | 7375.00 (0.26) | 11066.67 (0.21) |
| 5. | Depreciation on furniture @ 10% | 1061.67 (0.06) | 2097.50 (0.07) | 2268.33 (0.04) |
| 6. | Vehicle | 4850.00 (0.31) | 7167.50 (0.25) | 7233.33 (0.14) |
| 7. | Interest on fixed capital @ 10% | 467061.67 (29.55) | 682831.25 (23.98) | 1446635.00 (28.09) |
| 8. | Expenditure on permanent labour | 140705.56 (8.90) | 440750.00 (15.48) | 632777.78 (12.29) |
| 9. | Taxes, Insurance and License fee | 19816.67 (1.25) | 43680.00 (1.53) | 61333.33 (1.19) |
| Total fixed cost | 1046262.22 (66.21) | 1778778.13 (62.48) | 3437139.44 (66.75) | |
| Variable Cost | ||||
| 1. | Casual labour charges | 313388.89 (19.83) | 519400.00 (18.24) | 860555.56 (16.71) |
| 2. | Repair and maintenance | 20972.22 (1.33) | 37812.50 (1.33) | 116444.44 (2.26) |
| 3. | Telephone and telegraphs | 8333.33 (0.53) | 9875.00 (0.35) | 14333.33 (0.28) |
| 4. | Miscellaneous | 46666.67 (2.95) | 95593.75 (3.36) | 126666.67 (2.46) |
| 5. | Water charges | 8808.33 (0.56) | 21562.50 (0.76) | 28000.00 (0.54) |
| 6. | Electricity | 72983.33 (4.62) | 260416.25 (9.15) | 362962.67 (7.04) |
| 7. | Storage charges | 1761.67 (0.11) | 2829.38 (0.09) | 8368.00 (0.16) |
| 8. | Office expenses | 3933.33 (0.25) | 6225.00 (0.22) | 11666.67 (0.22) |
| 9. | Interest on working capital @ 12 percent | 57221.73 (3.62) | 114445.73 (4.01) | 183479.68 (3.56) |
| Total Variable Cost | 534069.51 (33.79) | 1068160.10 (37.52) | 1712477.01 (33.25) | |
| Total operating cost | 1580331.73 (100.00) | 2846938.23 (100.00) | 5149616.46 (100.00) |
Table text extracted from the original PDF; superscript letters are shown inline. The original table image is below.
View original table image
Financial viability of green gram mills
The performance of the processing industry can be accessed through the income analysis by gainfully using two important parameters viz; costs and returns. Still, the financial test ratios help processors in developing standard norms of investment and expenditure and also indicate the viability of the processing unit. Therefore, an attempt was made to compute some of the financial test ratios viz; operating ratio, fixed ratio, gross ratio and capital turn over ratio, respectively for different sized green gram dal mills processing and the result thereof are given in table 4. From the results, it was revealed that the operating ratio of green gram milling was for the small, medium and large size group; it was 0.90, 0.89 and 0.89 respectively. The fixed ratio of green gram dal processing in small, medium and large size group of green gram mills was 0.032, 0.023 and 0.019, respectively. The gross ratio in small, medium and large size group was 0.97, 0.97 and 0.96, respectively. From the gross ratio, it was revealed that the large sized green gram dal mills are financially more viable in processing green gram, followed by the medium and small sized green gram dal mills while milling green gram. All the three ratios, in all the size groups, were less than one indicated that green gram milling into green gram dal was a profitable activity to the miller. The capital turnover ratio was the least (1.030) in small sized dal mills and was the highest (1.036) in the large sized dal mills processing green gram, this confirmed the fact that the large sized dal mills are efficient to turn there investments into income to the larger extent. 59.00, respectively in small, medium and large sized green gram dal mills. From, the results, it was revealed that the per quintal total cost of green gram processing was decreasing with increase in installed capacity of dal processing. Economics of green gram dal processing showed that total quantity processed per unit was 5138.19, 12406.25 and 29024.00 quintals respectively in small, medium and large group. Processing cost varies according to the size group and total quantity processed. Cost of raw material is taken at the market rates at the time to which data pertain. Total cost incurred by green gram dal mill owner is calculated by adding processing cost, marketing cost and cost of raw material. It was Rs. 6156.72, 5933.37 and 5913.34 per quintal in small, medium and large unit respectively. The cost of processing was highest for small sized units, i.e. Rs. 307.57 per quintal and lowest for large sized units i.e Rs. 177.43. The benefit cost ratio was 1.030, 1.033, and 1.037 in small, medium and large units respectively. The benefit cost ratio was the highest in large size dal mills followed by medium and small size dal mills.
| Sr. No | Particulars | Size group | — | — |
|---|---|---|---|---|
| Small | Medium | Large | ||
| 1. | Operating ratio | 0.90 | 0.89 | 0.89 |
| 2. | Fixed ratio | 0.032 | 0.023 | 0.019 |
| 3. | Gross ratio | 0.97 | 0.97 | 0.96 |
| 4. | Capital turnover ratio | 1.030 | 1.032 | 1.036 |
Table text extracted from the original PDF; superscript letters are shown inline. The original table image is below.
View original table image
Break even analysis of green gram mills
The break-even quantity of green gram for dal mills was estimated to justify the feasibility of green gram dal mills in green gram milling for different size groups of green gram dal mills. The results on this behalf are presented in table 7. From the above discussion it quite evident that the per cent break-even quantity is decreasing over the size group, which could obviously related to the increased installed capacities of dal mills over the size group. The foregoing discussion thus reveals that in the entire size group, the green gram dal mills operate at a level higher than their break even volume but still at a lower level than their intake capacity. This might be due to less availability of raw material.
| Group | Total fixed cost (AFc) | Selling price (Ps) | Variable cost (Vc) | Actual quantity of processed | Break even quantity |
|---|---|---|---|---|---|
| Small | 1046262.22 | 6344.11 | 5953.09 | 5138.19 | 2675.72 (52.08) |
| Medium | 1778778.13 | 6127.28 | 5789.99 | 12406.25 | 5273.77 (42.51) |
| Large | 3437139.44 | 6131.82 | 5794.91 | 29024.00 | 10201.90 (35.15) |
Table text extracted from the original PDF; superscript letters are shown inline. The original table image is below.
View original table image
Value addition in green gram:
It is obtained by subtracting cost of raw material and processing cost from returns obtained from main and byproducts per quintal. The study of performance of green gram crop in Maharashtra reveals that the area and production of green gram was decreasing, it is because the area under soybean cultivation is increasing day by day replacing area under other pulses such as gram, red gram, black gram and green gram, etc. The per cent capacity utilization in green gram milling was very less and was attributed to the seasonal and less availability of green gram for processing. The increased quantum of green gram over the size group provided the cost efficiency to the green gram mills. The per quintal total cost was decreasing with increase in installed capacity of dal mills in green gram milling underlined the economies of scale in green gram milling.
Conclusions
Per quintal total cost was decrease with increase in size of green gram mills. The net return per quintal for green gram processing was found to be higher in case of large size mills as compared to medium and small size mills. Benefit cost ratio was also found to be higher in large sized green gram mills. Benefit cost ratio of agriculture industry is less because of huge initial investment in the processing industry but actual profit is more because of bulk quantity of production. To estimated breakeven quantity was increase with the increase in the size of processing green gram mills. Break-even point decrease based on green gram mills growth. Value addition in processing of green gram was higher in large sized followed medium and small green gram mills.
Policy Implication
There is need to increase the production of green gram through using high yielding variety. Government should provide subsidies to some extend for purchasing of processing machineries and equipment. The Government should focus on increasing infrastructure facility to improve the financial condition of processor.
Figures and tables from the paper
| Sr. No. | Capital items | Size group | — | — |
|---|---|---|---|---|
| Small | Medium | Large | ||
| 1. | Land | 2500000.00 (53.53) | 3700000.00 (54.19) | 6000000.00 (41.48) |
| 2. | Factory building | 967666.67 (20.72) | 1426287.50 (20.89) | 3004833.33 (20.77) |
| 3. | Machinery and other accessories | 1090166.67 (23.34) | 1535625.00 (22.49) | 5255833.33 (36.33) |
| 4. | Electrification | 53666.67 (1.15) | 73750.00 (1.08) | 110666.67 (0.76) |
| 5. | Furniture and fixtures | 10616.67 (0.23) | 20975.00 (0.31) | 22683.33 (0.16) |
| 6. | Vehicle | 48500.00 (1.04) | 71675.00 (1.05) | 72333.33 (0.50) |
| Total | 4670616.67 (100.00) | 6828312.50 (100.00) | 14466350.00 (100.00) |
Table text extracted from the original PDF; superscript letters are shown inline. The original table image is below.
View original table image
| Sr. No. | Particulars | Small | Medium | Large |
|---|---|---|---|---|
| 1. | Total fixed cost per unit | 1046262.22 | 1778778.13 | 3437139.44 |
| 2. | Total variable cost per unit | 534069.51 | 1068160.10 | 1712477.01 |
| 3. | Total operating cost | 1580331.73 | 2846938.23 | 5149616.46 |
| 4. | Quantity Processed/day in qtls | 20.42 | 49.63 | 108.84 |
| 5. | No. of working days in a year | 251.67 | 250 | 266.67 |
| 6. | Quantity Gram processed per unit (qtls) | 5138.19 | 12406.25 | 29024.00 |
| 7. | Fixed cost per quintal | 203.62 (66.21) | 143.38 (62.48) | 118.42 (66.75) |
| 8. | Variable cost per quintal | 103.94 (33.79) | 86.10 (37.52) | 59.00 (33.25) |
| 9. | Processing cost per quintal (7+8) | 307.57 (4.99) | 229.48 (3.86) | 177.43 (3.00) |
| 10. | Marketing cost per quintal | 262.31 (4.26) | 283.89 (4.78) | 330.13 (5.58) |
| 11. | Cost of raw material per quintal | 5586.84 (90.74) | 5420.00 (91.34) | 5405.78 (91.41) |
| 12. | Total cost incurred by dal mill owner (9+10+11) per quintal | 6156.72 (100.00) | 5933.37 (100.00) | 5913.34 (100.00) |
Table text extracted from the original PDF; superscript letters are shown inline. The original table image is below.
View original table image
| Sr. No | Main & by product | Small | — | — | Medium | — | — | Large | — | — |
|---|---|---|---|---|---|---|---|---|---|---|
| Qt. in kg | Rs./ kg | Total (Rs.) | Qt. in kg | Rs./ kg | Total (Rs.) | Qt. in kg | Rs./ kg | Total (Rs.) | ||
| A) 1. | Dal No. 1 | 54.87 | 78.60 | 4313.05 | 55.74 | 76.95 | 4289.57 | 56.66 | 75.50 | 4277.68 |
| 2. | Dal No. 2 | 22.66 | 71.00 | 1608.73 | 20.21 | 68.50 | 1384.50 | 20.35 | 69.17 | 1407.64 |
| 3. | Broken dal | 1.37 | 55.67 | 76.45 | 1.86 | 50.50 | 93.91 | 2.00 | 51.67 | 103.33 |
| 4. | Churi & chilka | 19.22 | 18.00 | 345.87 | 20.68 | 17.38 | 359.29 | 19.99 | 17.17 | 343.17 |
| 5. | Waste | 1.27 | 0.00 | 0.00 | 0.99 | 0.00 | 0.00 | 0.65 | 0.00 | 0.00 |
| B) | Gross Returns | 6344.11 | 6127.28 | 6131.82 | ||||||
| C) | Total cost | 6156.72 | 5933.37 | 5913.34 | ||||||
| D) | Net Returns | 187.40 | 193.91 | 218.49 | ||||||
| E) | Benefit Cost Ratio | 1.030 | 1.033 | 1.037 |
Table text extracted from the original PDF; superscript letters are shown inline. The original table image is below.
View original table image
| Sr. No | Particulars | Small | Medium | Large |
|---|---|---|---|---|
| 1 | Cost of raw material | 5586.84 | 5420.00 | 5405.78 |
| 2 | Processing cost | 307.57 | 229.48 | 177.43 |
| 3 | Gross returns | 6344.11 | 6127.28 | 6131.82 |
| 4 | Value addition | 449.71 (8.04) | 477.80 (8.82) | 548.62 (10.15) |
Table text extracted from the original PDF; superscript letters are shown inline. The original table image is below.
View original table image
References
8 in the original paper- Banerjee G, Palke LM. Economics of pulses production and processing of India. Occasional paper, Deptt. of Economic Analysis and Research, NABARD, Mumbai. 2010;51:1-80.
- Desale PG, Navadkar DS, Birari KS, Thakur VP. Processing of pulses by private mills in Jalgaon district of Maharashtra state: An Economic analysis. Indian Journal of Agricultural Marketing. 2002;16(3):44-45.
- Honoré Samuel Ntavoua. Impact of agricultural exports on economic growth in Cameroon. Int. J Agric. Extension Social Dev. 2021;4(1):49-53.
- Prakash B. Processing and value addition of pulses for earning more profit. Indian Journal of Agricultural Marketing. 2002;16(3):44-45.
- Sharma KD, Pathania MS, Harbans Lal. Value Chain Analysis and Financial Viability of Agro-Processing Industries in Himachal Pradesh. Agril. Economics Research Review (Conference Number). 2010;23:515522.
- Sharma KG, Srivastava A. Marketing and processing of gram in Narsinghpur district of Madhya Pradesh. Indian Journal of Agricultural Marketing. 2002;16(3):45.
- Sharma KG, Athavale MC. Economics of processing of gram and emerging problems: a Case study. Indian Journal of Agricultural Economics. 2003;58(3):617618.
- Gauraha AK, Srivastava RSL, Mathur P. An economic analysis of processing of pulses in Durg district of Chhattisgarh. Indian Journal of Agricultural Economics. 2003;58(3):612.
Cited by 8
From OpenAlex, OpenCitations and reference lists read by Scinovex
- Effect of agricultural exports on India's economic development ↗
Arianna Ornaghi, Maria Budani · International Journal of Financial Management and Economics · 2024
This paper examines the role of agricultural exports in the economic development of India, a country with a significant agrarian sector. Despite rapid industrialization and the growth of the service sector, agriculture remains a crucial part of the Indian economy, contributing significantly to GDP, employment, and export earnings. This study analyzes the trends, challenges, and impacts of agricultural exports on…
❝ 1PDF - Design interventions: A pathway to elevate tharu applique ↗
Twinkle Rastogi, Salam Manisana Devi, Madhavi Kushwah, Kajal Thakuriya, Neysa Vas, Kalpana Munjal et al. · International Journal of Home Science · 2024
This research paper explores design interventions to enhance the marketability of Tharu appliqué products. Tharu appliqué is a traditional craft practiced by the Tharu tribes in the Terai region of India and Nepal. While rich in cultural significance, the craft faces challenges in the modern market. This study aims to document the craft, analyze the socio-economic conditions of artisans, and
- Integrated nutrient management on economics of green gram (Vigna radiata L.)
Akash Tripathi, Sanjay Lilhare, Amit Singh Tiwari · International Journal of Research in Agronomy · 2022
An experiment was conducted at Research Farm, Department of Agronomy, Faculty of Agriculture, AKS University, Sherganj, Satna (M.P.) during Kharif season of 2021-22. The experiment consisted of randomize block design three replications. In this experiment, 12 treatment combinations viz., RDF (NPK @ 20: 60: 20 kg/ha) – T1, 100% nitrogen through FYM – T2, 100% nitrogen through vermicompost –T3, 100% nitrogen through poultry manure - T4, 75% nitrogen through FYM + 25% nitrogen through vermicompost – T5, 75% nitrogen through vermicompost + 25% nitrogen through poultry manure – T6, 75% nitrogen thr
- Green innovation in product design: A systematic review ↗
Ahmad Bilal Farooqi, Md. Rashid Farooqi · Asian Journal of Management and Commerce · 2025
This review analyses green product design innovations in India, focusing on identifying mounting environmental pressures while aligning with the country’s sustainable development goals. By synthesising existing studies, the research highlights key innovations, including material substitutions, energy efficiency improvements, waste reduction strategies, and the integration of circular economy principles. These innovations were identified in the context of India’s unique socio-economic landscape,
- Knowledge and adoption patterns of improved green gram varieties among farmers: Insights from KVK’s CFLDs
Tadepalli Yamini, Srinivas Lokikere Devendrappa, Shashank L Reddy, Vineeth HT · International Journal of Agriculture Extension and Social Development · 2024
Introduction: In Indian agriculture, the green revolution of the 1960s is pivotal and would not have occurred without the utilization of high yielding wheat and paddy varieties; therefore, variety plays an important role in replicating such a revolution in any other crop today. All other factors, such as increased crop output, reduced water consumption, fertilizer and pesticide use and reduced environmental effect, are dependent on variety. Realizing the importance of improved varieties in boostening up the Indian agriculture and enhancing the farmer’s income, the KVK- Dharwad has been promoti
- Green synthesis and characterization with in vitro antibacterial and antioxidant profiling of gold nano-conjugates using Citrus limon and Citrus aurantifolia leaf ↗
Moumita Saha, Sirshendu Chatterjee · International Journal of Chemical and Biological Sciences · 2023
Background: Nanotechnology, concerned with the nanoparticles having a size of 1-100 nm in one dimension is one of the ultimate expeditiously advanced areas of technology that has opened up many new edges of research for modern day society. These nano-conjugates can be synthesized via different methods. Although, the green approach is the most favoured one as it is way more
- Study of gene action for yield and its contributing traits in green gram (Vigna radiata L. Wilczek)
Aranav Yadav, RK Yadav, Mahak Singh, SHWETA SHWETA, CL Maurya, Yogendra Singh · International Journal of Statistics and Applied Mathematics · 2023
The present investigation was carried out at Student’s Instructional Farm, Chandra Shekhar Azad University of Agriculture and Technology, Kanpur- 2080 02 (U.P.) during 2020-23. This region has a subtropical climate. Sandy loam is the kind of soil. Roughly 1270 mm of rain falls there each year. Kanpur district has a semi-arid climate with scorching summers and chilly winters. Geographically, Kanpur is situated in latitude 26.400 N and longitude 80.100 E, respectively, with elevation 127 meters above mean sea level. The estimate of additive genetic component ( ) was significant for all the chara
- Optimizing growth and yield in Mung Bean (Vigna radiata L.) through combined nutrient management strategies ↗
S.W. Schroeder, GE Hautz · International Journal of Pharmacognosy and Clinical Research · 2022
This paper explores the effectiveness of integrated nutrient management (INM) approaches in enhancing the growth, yield, and nutritional quality of mung bean (Vigna radiata L.), a crucial legume crop in sustainable agriculture. By combining organic and inorganic nutrient sources, INM aims to improve soil health, increase crop productivity, and minimize environmental impacts. Field experiments were conducted across diverse agro-ecological zones