
Research article · 2022 · Full text
International Journal of Advanced Chemistry ResearchStudy on vulnerability assessment in different districts of Chhattisgarh plains Zone-II
Volume 4(2) · Pages 273–277 · DOI: 10.33545/26646781.2022.v4.i2d.111 ↗
Research areasAgricultural risk and resilienceClimate change impacts on agricultureAgricultural Economics and Practices
Abstract
Author-writtenThe present research work entitled "Study on vulnerability assessment in different districts of Chhattisgarh Plains Zone-II" was conducted at Department of Agrometeorology, Raipur during 2021-22. Climate change vulnerability is a complex, multidimensional process influenced by indicators. The data of agricultural, Climatic, Demographic, Geographic and occupational indicator of respective districts for period 2004-2020 were collected and analysed for the study and their Garrett’s ranking was done. The composite vulnerability index and Garrett ranking was observed high in Bilaspur district and lowest index for vulnerability was found in Kabirdham district.
Summary
Source-checkedPlain-language reading of the full paper, prepared with AI and checked against the text. Each point links to the authors' own words.
Why it matters
- Agriculture is identified as one of the most vulnerable sectors to climate change. View evidence ↗
- Vulnerability assessments are necessary to identify specific locations that require adaptation measures to handle climate change impacts. View evidence ↗
The question
- The study aimed to assess the vulnerability of different districts within the Chhattisgarh Plains Zone-II. View evidence ↗
What they did
- The assessment targeted eight districts: Balod, Bemetara, Bilaspur, Janjgir-Champa, Kabirdham, Korba, Mungeli, and Raigarh. View evidence ↗
- The study analyzed agricultural, climatic, demographic, geographic, and occupational indicators from 2004 to 2020 using Garrett's ranking. View evidence ↗
- The researchers used the Iyengar and Sudarshan technique for the Composite Vulnerability Index and the Hiremath and Shiyani formula for Dimension and Average Indices. View evidence ↗
What they found
- Bilaspur had the highest agricultural vulnerability index (1.94), while Korba had the lowest (0.64). View evidence ↗
- Korba was the most climatically vulnerable district (0.73), and Bemetara was the least (0.18). View evidence ↗
- Regarding demographic vulnerability, Balod showed the maximum index (1.00) and Mungeli the minimum (0.19). View evidence ↗
- Geographical vulnerability was highest in Korba (1.00) and lowest in Mungeli (0.14). View evidence ↗
- Bilaspur had the highest occupational vulnerability index (1.99), while Kabirdham had the lowest (0.16). View evidence ↗
- Bilaspur was the most vulnerable overall, with the highest Composite Vulnerability Index (CVI) of 1.10. View evidence ↗
- Kabirdham was the least vulnerable district, with a CVI of 0.45. View evidence ↗
What it means
- The authors recommend prioritizing Bilaspur, Janjgir-Champa, Raigarh, and Bemetara to reduce susceptibility. View evidence ↗
- To improve adaptive capacity, the authors suggest implementing water conservation, rainwater harvesting, better education, and infrastructure development. View evidence ↗
Visual summary
2 visualsIllustrations explain the paper; charts are replotted from the paper's own table values.
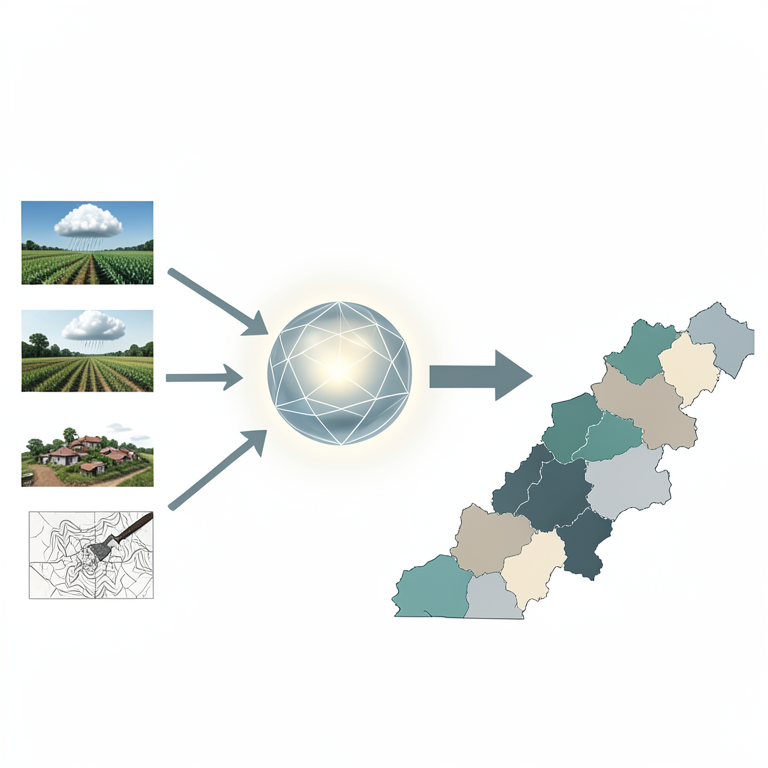
Vulnerability Index Framework
AI-generated conceptual illustration (The landscape of Chhattisgarh plains Zone-II, India). It explains the idea and does not show study data.
View source evidence ↗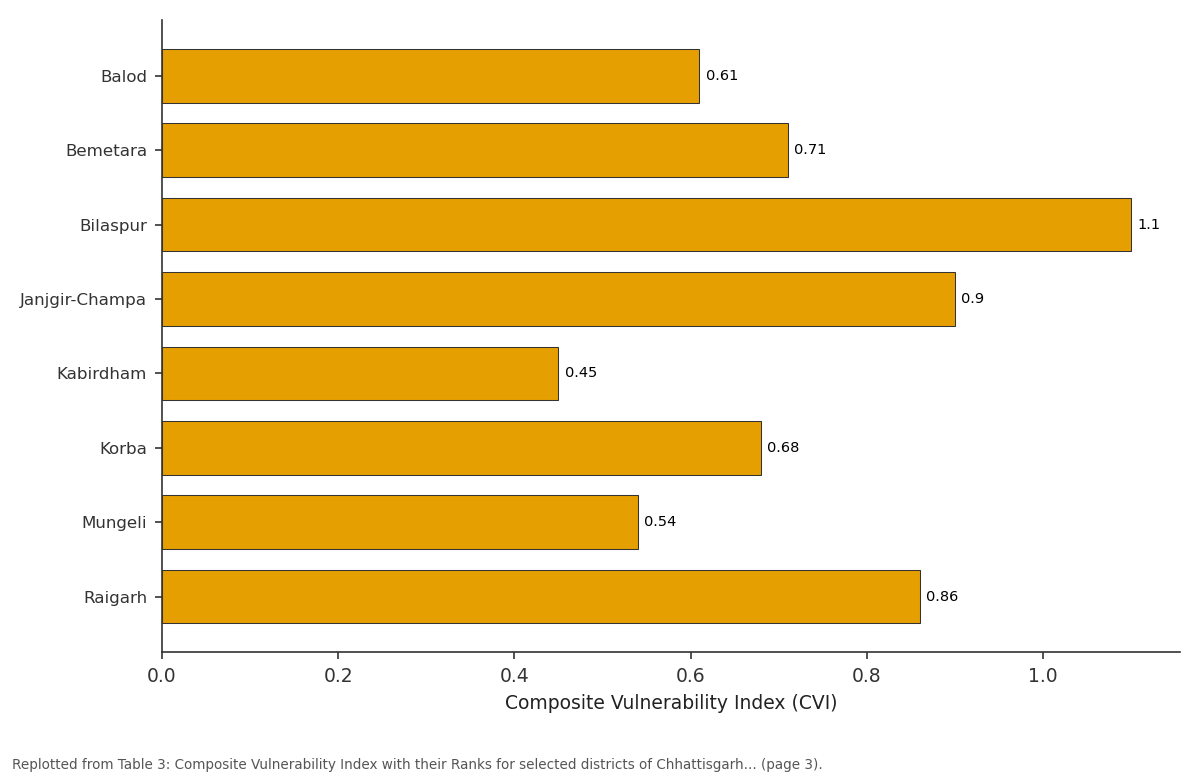
Composite Vulnerability Index (CVI): Balod vs Bemetara vs Bilaspur vs Janjgir-Champa vs Kabirdham
Replotted from Table 3 (page 3) of the original paper. Every bar is the paper's own table value.
View source evidence ↗Figures & tables
From the original paper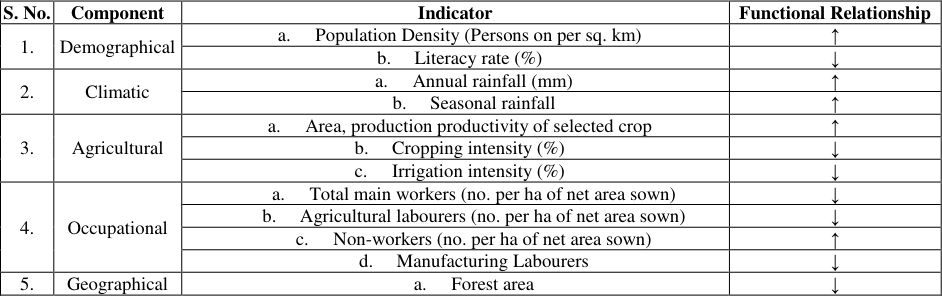 Table 1
 Table 2
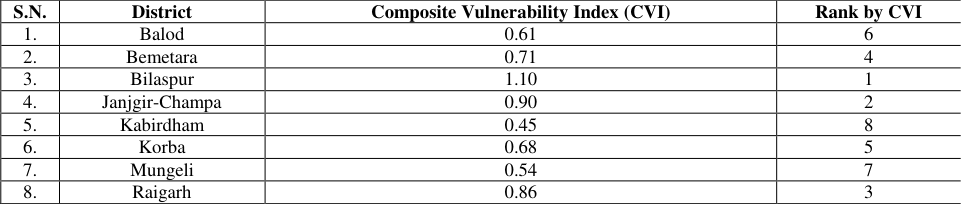 Table 3
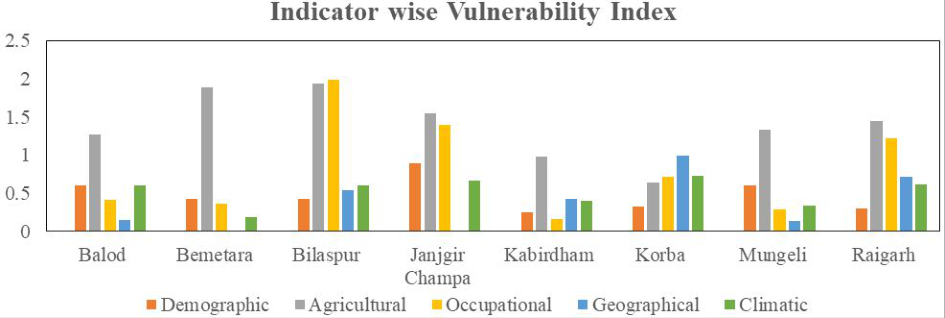 Fig. 1
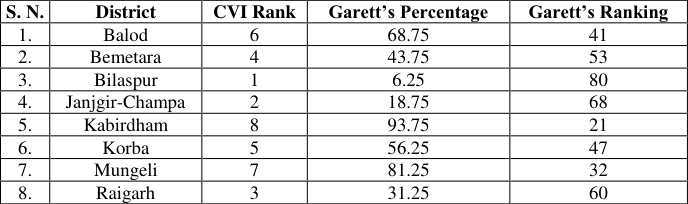 Table 4
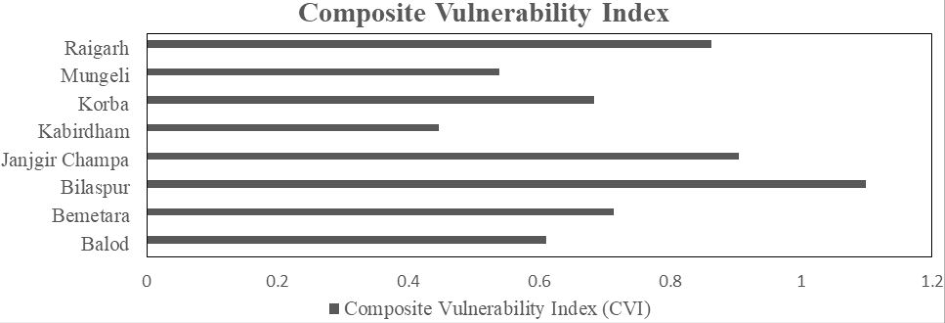 Figure 2
Introduction
Agriculture is one of the sectors most vulnerable to changes in the climate. At the global level the Intergovernmental Panel on Climate Change (IPCC) note that yields are generally expected to decline most severely in countries at lower latitudes. The IPCC Report described vulnerability as "a function of the character, magnitude and rate of climate variation to which a system is exposed, its sensitivity, and its adaptive capacity". It defined vulnerability as "the degree to which a system is susceptible to or unable to cope with, adverse effects of climate change, including climate variability and extremes". The IPCC has declared that climate change has played a key role in intensifying and triggering extreme events, such as floods, droughts, heatwaves, and tropical cyclones, which are all likely to increase in the future (IPCC 2012) [4] . Vulnerability assessment describes a diverse set of methods used to systematically integrate and examine interactions between humans and their physical and social surroundings. The field of climate vulnerability assessment has emerged to address the need to quantify how communities will adapt to changing environmental conditions. Therefore, assessment of vulnerability is necessary to identify locations that will be in need for adaptation measures to cope up with impacts of climate change. It comprises an assessment of the region's or sector's ability to adapt. Similar work was also done by Jeganathan et al. (2021) [5] and they investigated the socio-economic vulnerability based on sustainable development goals (SDG) in the state of Tamil Nadu in the context of climate risks. Their result showed that Ariyalur was the most vulnerable district due to its high sensitivity and low adaptive capacity to climate risks. The other top vulnerable districts were Nagapattinam, Ramanathapuram, Thiruvarur, Thiruvallur, Thanjavur, Perambalur, Pudukottai, and Thiruvannamalai. Hiremath and Shiyani (2013) [3] also reported the vulnerability in various agro-climatic zone of Gujarat and they revealed that Amreli area (North Solastra agro climatic area) was the most vulnerable and Panchmahals area was least vulnerable to climate change. The assessment of vulnerability will give a comprehensive picture of current and future climate change risks with more stress factors to be anticipated. It will help identify opportunities arising from climate change, and provide information on how to assess adaptive capacity and cope with uncertainty. Keeping this fact, the present research "study on Vulnerability assessment in different districts of Chhattisgarh Plains Zone-II" was carried out.
The study was carried out at the Department of Agrometeorology, College of Agriculture, I.G.K.V., and Raipur. The data of various socio-economic indicators were collected and compiled from different sources. Agricultural data (2004-2020) i.e., area, production & productivity of horticultural crops was collected from Directorate Horticulture and Farm Forestry, Chhattisgarh. Decadal demographic data (population density and literacy rate), occupational data of agricultural workers and geographical data regarding forest area for the period 2001 and 2011 were collected from the Census department of Madhya Pradesh and Chhattisgarh (Census India). [3] for Dimension Index and Average Index.
Garrett's Ranking Technique will be used for arranging districts as per their degree of vulnerability. The functional relationship of indicators to vulnerability was shown in table 1.
| S. No. | Component | Indicator | Functional Relationship |
|---|---|---|---|
| 1. | Demographical | a. Population Density (Persons on per sq. km) | ↑ |
| b. Literacy rate (%) | ↓ | ||
| 2. | Climatic | a. Annual rainfall (mm) | ↑ |
| b. Seasonal rainfall | ↑ | ||
| 3. | Agricultural | a. Area, production productivity of selected crop | ↑ |
| b. Cropping intensity (%) | ↓ | ||
| c. Irrigation intensity (%) | ↓ | ||
| 4. | Occupational | a. Total main workers (no. per ha of net area sown) | ↓ |
| b. Agricultural labourers (no. per ha of net area sown) | ↓ | ||
| c. Non-workers (no. per ha of net area sown) | ↑ | ||
| d. Manufacturing Labourers | ↓ | ||
| 5. | Geographical | a. Forest area | ↓ |
Table text extracted from the original PDF; superscript letters are shown inline. The original table image is below.
View original table image
Step 1: All climatic indicators and one demographic indicator i.e., population density was calculated through this Increasing functional relationship formula,
Where Actual XI =Actual value of respected Year Minimum XI =Minimum value of respected Year Maximum XI =Maximum value of respected Year.
Step 2: All agricultural indicators and one demographic indicator i.e., literacy rate both are calculated through this Decreasing functional relationship formula,
Where Actual XI =Actual value of respected Year Minimum XI =Minimum value of respected Year Maximum XI =Maximum value of respected Year.
Step 3: The Average Index of all five indicators was calculated by using this formula, Average Index (AI) = [Indicator 1 +………. + Indicator J] / J Where Indicator 1 = Geometric mean of Indicator 1 Indicator J = Geometric mean of Indicator J J = number of indicators in each source of vulnerability.
Step 4: The Composite Vulnerability Index was calculated by using Iyengar and Sudarshan technique (1882),
Where AI = Average index n = number of sources of Vulnerability α = n.
Step 5: The Garrett's Score was calculated by following formula given below and Garrett's ranking conversion table
was used for the ranking of selected districts accordingly.
Result and Discussion
The indicator wise vulnerability and composite vulnerability index was calculated and ranked based on their extent of vulnerability index. Ranking of the respective districts were also done by garret's score.
Indicator wise Vulnerability Index for selected districts of Chhattisgarh Plains Zone-II
There are number of indicators which can be used to assess the vulnerability in any sector. In agriculture and allied sectors these five indicators i.e., agricultural, climatic, demographic, geographic and occupational were comparatively more useful. Therefore, we have combined these indicators to assess the Vulnerability for Chhattisgarh Plains Zone-II.
Agricultural Vulnerability Index
Agricultural vulnerability was analysed with the help of cropping intensity, irrigation intensity, area under cultivation, production, productivity and area of respective districts. It is quite clear from the table 2 and Figure 1 that district Bilaspur was reported highest value of Agricultural Vulnerability (1.94), this district was most vulnerable with respect to agricultural indicator in changing scenarios and the lowest value was reported in the district Korba (0.64), indicates that this district was less vulnerable to agriculture and allied sectors. Less vulnerable districts need to give proper trainings to Farmers for adaptation of new techniques.
| District | Agricultural Vulnerability | Climatic Vulnerability | Demographic Vulnerability | Geographical Vulnerability | Occupational Vulnerability |
|---|---|---|---|---|---|
| Balod | 1.27 | 0.60 | 1.00 | 0.16 | 0.42 |
| Bemetara | 1.88 | 0.18 | 0.46 | - | 0.36 |
| Bilaspur | 1.94 | 0.60 | 0.28 | 0.54 | 1.99 |
Table text extracted from the original PDF; superscript letters are shown inline. The original table image is below.
View original table image
Climatic Vulnerability Index
Climatic vulnerability index was workout with annual and seasonal rainfall of the selected districts. Result of the analysis indicates that district the Korba was more vulnerable with highest value (0.73) of climatic vulnerability and district Bemetara was less vulnerable with lowest value (0.18) of climatic vulnerability. This indicates that there is urgent need to address the issue of climatic change.
Demographic Vulnerability Index
Population density and literacy rate was used to find out demographic vulnerability index for respected districts. Our findings indicates that the district Balod observed maximum (1.00) and district Mungeli observed minimum (0.19) value of vulnerability index. Maximum value in the district Balod indicates that this district needs to improve the quality of education and capacity building to control population density.
Geographical Vulnerability Index
Geographical vulnerability was calculated with the help of forest cover in the respective districts. Our study indicates that the geographical vulnerability index was highest in the district Korba (1.00) and lowest value was in the district Mungeli (0.14). This result provides information to address the forest related issue in the Korba district.
Occupational Vulnerability Index
We have worked out the occupational vulnerability index with the help of agricultural labour, Industrial worker, nonworkers and total workers of respected districts. It was found that Bilaspur district was most vulnerable with highest occupational vulnerability index (1.99) followed by Janjgir-Champa (1.40) and Raigarh (1.22) and the lowest occupational vulnerability index reported in the Kabirdham district (0.16). Therefore, it is suggested that there are more vulnerable districts to keep in mind to address the occupational status of population to overcome present status.
Conclusion
To determine each district's vulnerability index, a districtlevel vulnerability assessment was conducted. Based on exposure, sensitivity, and potential for adaptation to climate change, specific indicators were chosen. The composite vulnerability index was calculated by taking into account all the selected indicators. Findings of the analysis shows that Bilaspur was the most vulnerable district and Kabirdham was the least vulnerable district among all the eight selected districts. To reduce the degree of susceptibility, it is recommended that Bilaspur, Janjgir-Champa, Raigarh and Bemetara districts need to be more prioritize. To improve the adaptive ability in rural and internal areas, it is necessary to take advanced and adaptive measures including water conservation, rainwater harvesting, better education and infrastructure development in these vulnerable districts.
Figures and tables from the paper
| S.N. | District | Composite Vulnerability Index (CVI) | Rank by CVI |
|---|---|---|---|
| 1. | Balod | 0.61 | 6 |
| 2. | Bemetara | 0.71 | 4 |
| 3. | Bilaspur | 1.10 | 1 |
| 4. | Janjgir-Champa | 0.90 | 2 |
| 5. | Kabirdham | 0.45 | 8 |
| 6. | Korba | 0.68 | 5 |
| 7. | Mungeli | 0.54 | 7 |
| 8. | Raigarh | 0.86 | 3 |
Table text extracted from the original PDF; superscript letters are shown inline. The original table image is below.
View original table image
| S. N. | District | CVI Rank | Garett’s Percentage | Garett’s Ranking |
|---|---|---|---|---|
| 1. | Balod | 6 | 68.75 | 41 |
| 2. | Bemetara | 4 | 43.75 | 53 |
| 3. | Bilaspur | 1 | 6.25 | 80 |
| 4. | Janjgir-Champa | 2 | 18.75 | 68 |
| 5. | Kabirdham | 8 | 93.75 | 21 |
| 6. | Korba | 5 | 56.25 | 47 |
| 7. | Mungeli | 7 | 81.25 | 32 |
| 8. | Raigarh | 3 | 31.25 | 60 |
Table text extracted from the original PDF; superscript letters are shown inline. The original table image is below.
View original table image
References
6 in the original paper- Anonymous. Agriculture Statistics at a glance. Ministry of Agriculture and farmer's welfare. Directorate of Economics and Statistics; c2020-2021.
- Hiremath DB, Shiyani RL. Analysis of Vulnerability indices in various Agro-Climatic Zones of Gujarat. Indian Journal of Agricultural Economics. 2013;68(1):122-137.
- Jeganathan A, Andimuthu R, Kandasamy P. Climate risks and socio-economic vulnerability in Tamil Nadu, India. Theoretical and Applied Climatology. 2021;145:121-135.
- Shanabhoga MB, Krishnamurthy BA. Critical Analysis of Vulnerability and Adaptation Strategies for Climate Change among the Farmers of Hyderabad Karnataka Region. Mysore Journal of Agricultural Sciences. 2020;54(2):90.
- Shanabhoga MB, Krishnamurthy B, Suresha SV. Assessment of Vulnerability to Climate Change among the Districts of Hyderabad Karnataka Region. International Journal of Agriculture Sciences. 2019;11(16):8932-8935.
- Shivakumara c, Murthy PSS. Mapping a Climate Change Vulnerability Index: An Assessment in Agricultural, Geological and Demographic Sectors across the Districts of Karnataka (India). International Journal of Environment and Climate Change. 2019;9(8):447-456.