
Research article · 2022 · Full text
International Journal of Advanced Chemistry ResearchAssessment of trace metal content in water, soil and vegetables samples in the vicinity influenced by industrial effluents
Volume 4(1) · Pages 16–19 · DOI: 10.33545/26646781.2022.v4.i1a.42 ↗
Research areasHeavy metals in environment
Abstract
Author-writtenPollution of the environment by trace metals emanating from rapid economic growth and improper waste and effluent disposal is a major concern. In this study trace metal concentrations, Cu, Zn, Pn, Ni, Sn, Cr, Fe, Co Mn and Cd in water, soil and vegetable samples in two urban streams influenced by effluents disposal from two industries were analysed using PG-990 Model atomic absorption spectrophotometer. Analytical results of water samples in the vicinity of the two industries indicated higher concentrations of Cu, Zn, Pn, Ni and Mn above the acceptable limits reported by the FAO/WHO (2000). The concentration of trace metals in soil and vegetables from the two sites were within the tolerance limits reported by FAO/WHO (2004) and FAO/WHO (2007) respectively. Cd was not detected in water and vegetable samples from NASCO household industrial area and also in water samples from Grand Cereals and Oil Mills area. However, the higher concentrations of trace metals in the polluted (either directly or indirectly) areas were higher than the control indicator that industrial activities such as discharge of wastes and effluents into natural ecosystem in most cases without treatment may cause health hazard as well as environmental pollution.
Summary
Source-checkedPlain-language reading of the full paper, prepared with AI and checked against the text. Each point links to the authors' own words.
Why it matters
- Environmental pollution caused by trace metals from rapid economic growth and poor waste disposal is a significant global concern. View evidence ↗
- Industrial and municipal effluents are major sources of pollution and pose a threat to aquatic environments. View evidence ↗
- Vegetables grown in industrially polluted soil can accumulate toxic metals in their edible parts, potentially causing clinical health problems for humans and animals. View evidence ↗
The question
- The study aimed to assess trace metal accumulation in vegetables and compare the metal status of water, soil, and vegetables between polluted and non-polluted areas. View evidence ↗
What they did
- The researchers analyzed concentrations of Cu, Zn, Pn, Ni, Sn, Cr, Fe, Co, Mn, and Cd in water, soil, and vegetable samples from two urban streams affected by industrial effluents. View evidence ↗
- Spinach (Spinacia oleraco) was used as the vegetable sample, with approximately 20 g collected from farmlands. View evidence ↗
- Trace metal concentrations were measured using a PG-990 model atomic absorption spectrophotometer. View evidence ↗
What they found
- In water samples near NASCO Household Company, Cu (0.520±0.003 mg/l), Ni (0.090±0.003 mg/l), and Mn (0.220±0.002 mg/l) exceeded FAO/WHO (2000) limits. View evidence ↗
- Water samples near Grand Cereals and Oil Company also showed Cu (0.494±0.026 mg/l), Ni (0.086±0.003 mg/l), and Mn (0.236±0.005 mg/l) exceeding FAO/WHO (2000) limits. View evidence ↗
- Trace metal concentrations in soil samples near NASCO Household Company remained below FAO/WHO (2004) recommended values. View evidence ↗
- Trace metal concentrations in soil near Grand Cereals and Oil Mills Company were below FAO/WHO (2003) recommended values. View evidence ↗
- Vegetable metal concentrations near both industrial areas were within FAO/WHO (2007) limits, though they were higher than those in control samples. View evidence ↗
- Cadmium (Cd) was not detected in water and vegetable samples from the NASCO area, nor in water samples from the Grand Cereals and Oil Mills area. View evidence ↗
What it means
- The authors concluded that while water samples exceeded safety limits for Cu, Ni, and Mn, the vegetables remained within safety limits for human consumption. View evidence ↗
- The authors recommend integrated monitoring, enforcement of compliance standards, and public education to reduce heavy metal accumulation in soil and vegetables. View evidence ↗
Visual summary
2 visualsIllustrations explain the paper; charts are replotted from the paper's own table values.
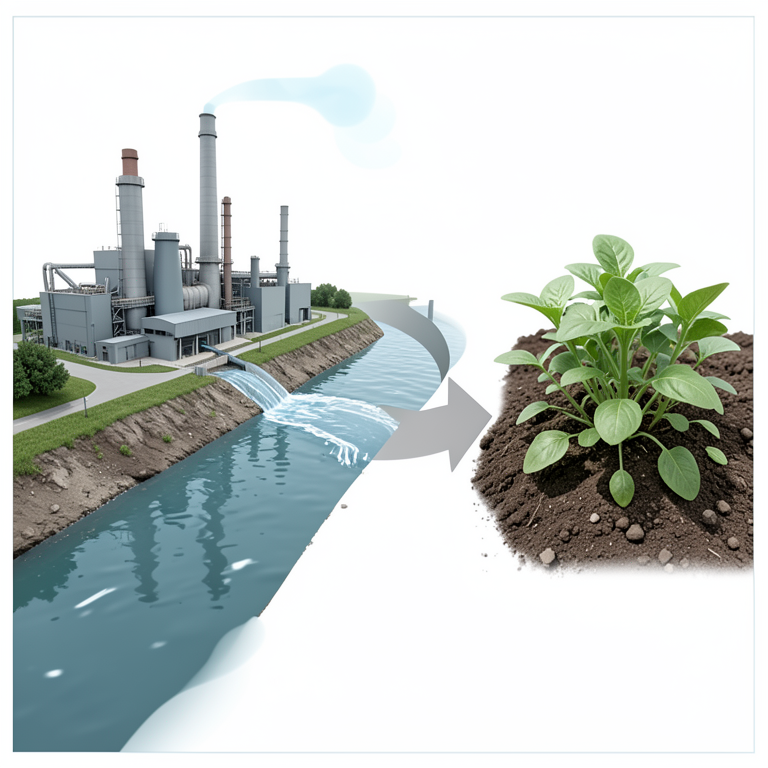
Pathway of Industrial Metal Pollution
AI-generated conceptual illustration (Industrial factory, river water, soil, and spinach plants). It explains the idea and does not show study data.
View source evidence ↗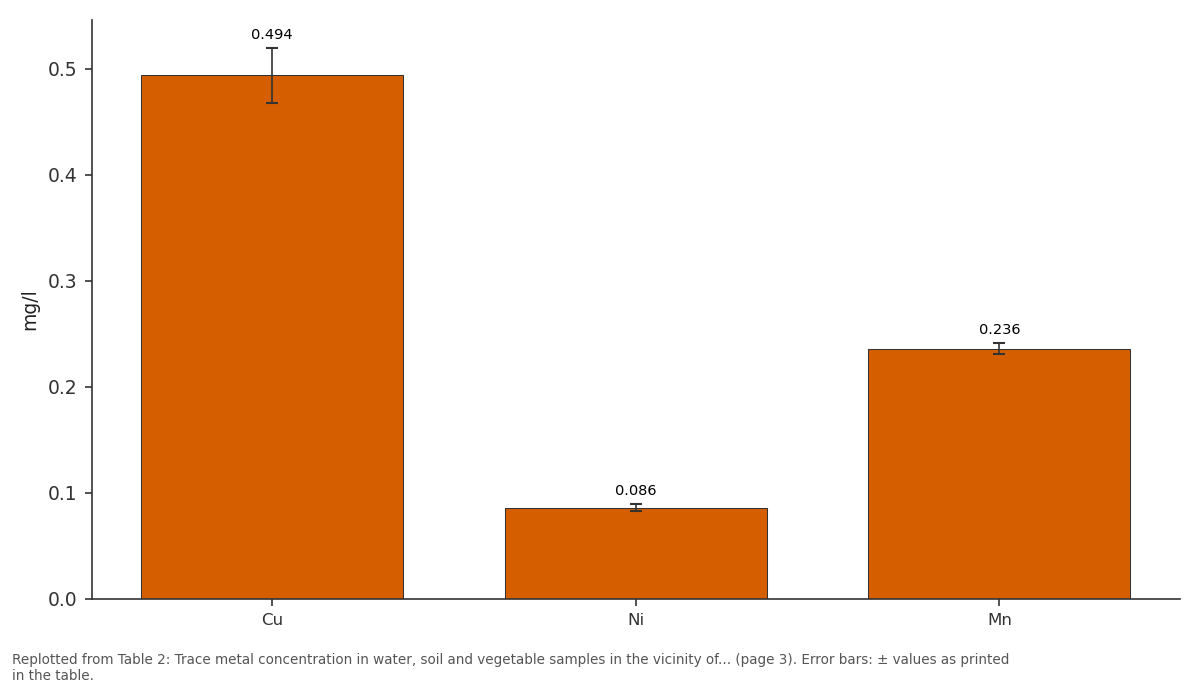
Water: Cu vs Ni vs Mn
Replotted from Table 2 (page 3) of the original paper. Every bar is the paper's own table value.
View source evidence ↗Figures & tables
From the original paper Table 1
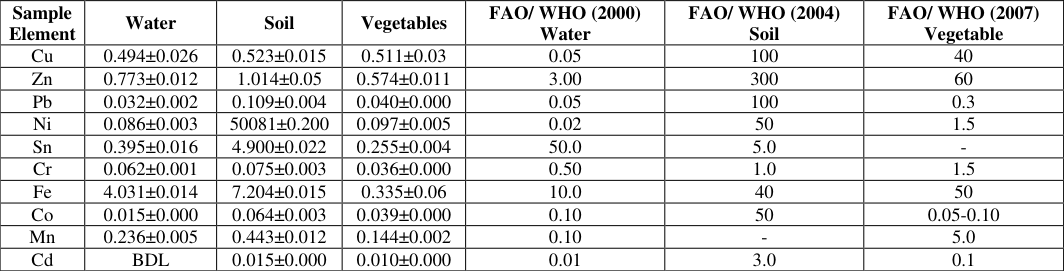 Table 2
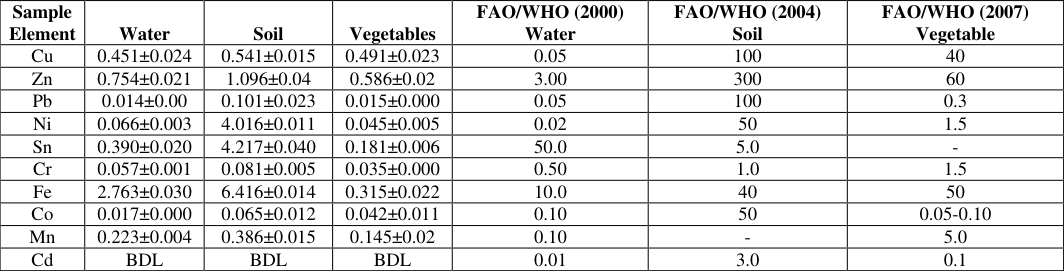 Table 3
Introduction
Effluent is an outflow of water or gas to a natural body from a structure such as a sewage treatment plant. Sewage pipe, industrial wastes: water treatment plant or industrial outflow (USEPA, 2006) [19] . Industrial and municipal effluents present a major threat to the aquatic environment and are an important source of environmental pollution (Chamber et al., 1997) [7] . Most of these industries discharge their wastes and effluents into natural eco-system in most cases without any treatment thus causing environmental pollution, especially with heavy metals and organic compounds. These hazardous wastes and effluents are generally discharged into a low-lying areas along road sides, streams or in the vicinity of the industrial installations (Chamon et al., 2011) [8] . Millions of small-scale farmers in urban and pre-urban areas in developing countries depend on urban streams which are the recipients of the urban effluents or irrigation of crops and vegetables for urban markets. This poses a direct risk (Njuguna et al., 2017; Tomno et al., 2020; Prabbu, 2009) [18] . The increase in the number of processing and manufacturing plants have also increased the amount of industrial effluents consumption patterns on the other hand and contribute to the accumulation of solid wastes. All these effluents and in some cases solid wastes find their ways into the sewage treatment plants and streams (Kenya Attas, 2007) [12] . Industrial and municipal effluents contain high amounts of heavy metal ions such as chromium, nickel, copper, lead, cadmium and zinc. These heavy-metal-bearing wastewater are a major cause for considerable concern because they are non-degradable, highly toxic and sometimes carcinogenic (Musyoka et al., 2013) [13] . Vegetables cultivated on soil polluted with toxic metals due to industrial activities take up heavy metals and accumulate them in their edible and non-editable parts in quantities high enough to cause clinical problems both to animals and human beings consuming these metal rich plants (Gungshik et al., 2021; Arora et al., 2008; Alam et al., 2003) [10,4,2] . Therefore, a better understanding of trace metal sources, their accumulation in the soil and the effect of their presence in water, soil and on vegetables samples seem to be particularly important issues of present day research on risk assessment. Thus the present research works has been undertaken: i) to assess the accumulation status of trace metals in vegetables and ii) to compare the trace metal status of water/soil and vegetables in polluted and non-polluted areas.
Materials and Methods
Materials and Methods
Sample collection and presentation Water samples
A 100 cm3 acid washed clean plastic containers were used for collection of water samples. A hydro bios water supplier was used to transfer water into 1000 cm3 plastic containers with screw caps. The samples were collected 50m distance between sampling points. The samples were transported to the laboratory and stored in the refrigerator (Wushuang et al., 2017) [20] .
Soil Samples
A 10 g of soil samples was collected at a depth of 0-5 cm 3 using a clean stainless steel trowel into an acid-washed plastic containers. 3-4 slices of soils were taken from top to bellow to form a representative sample of a whole (Casas et al., 2003) [6] . The soil samples were air-dried and then crushed using a porcelain mortar and a pestle, mixed thoroughly and sieved through a 2 mm mesh size. The pondered samples were stored in polyethylene sample bottle prior to analysis (Washuang et al., 2017) [20] .
Vegetable Samples
About 20 g of the vegetable samples spinach (Spinacia oleraco) was collected directly from the farmlands into a polythene bags and sealed. They samples were brought to the laboratory and rinsed with tap water, 0.1 M HCl and distilled water. The samples were sliced and air-derived at room temperature. They were then oven-dried at 1050c to Constant weight. The dried samples were ground and slerved thorough a mesh size of 2 mm and then stored for subsequent ananlysis (Sabu and Kachol, 2006).
Methods
Methods
Extraction of trace metals in water samples
To a 50 cm3 aliquot of the water sample 30cm3 of conc HCl and 10cm3 of conc. HNO3 in the ratio of 3:1 (aqua regia) was added. The solution was placed on a hot plate and heated at a temperature of 100 cm 3 for 1 hour. After the solution was allowed to cool, it was filtered and then adjusted to 100 cm3 volume with distilled water and stored for determination of trace metals (David and Minate, 2018) [9] .
Digestion of soil samples
A 1.0 g of the sieved soil samples was digested with a mixture of 30cm3 conc HCl and 10 cm3 conc. HNO3 in the ratio of 3:1 and heated for 2 hours at 1000c After cooling, the mixture was filtered and made up to 50 cm 3 volume with distilled water and stored for determination of trace elements (Joseph et al., 2013) [11] .
Preparation of Vegetable Samples
A 2.0g of sieved vegetable sample was placed in proclaim crucible and ashed in muffle furnace at a temperature of 600oC for 6 hours. After cooling, the as hed sample was digested with 15 cm3 of conc HCL and 5 cm3 of HNO3 in the ratio of 3:1. After digestion, the solution was allowed to cool, filtered and made up to 50 cm3 volume with distilled water for the determination of trace metals (David and Minatic 2018) [9] .
Determination of trace metals
The concentration of trace metals in water soil and vegetable samples were determined using the atomic absorption spectrophotometer. The filtrates were aspirated into the flame of the PG-990 model atomic absorption spectrophotometer and the absorbance readings were taken.
From the calibration curve, the concentrations of the corresponding absorbance were read and deported in mg/l and mg/kg dry weight (Ahmad and Goni, 2009) [1] .
Results and Discussion Trace metal concentrations in water samples
The concentration of trace metals in water samples influenced by effluents from NASCO House Hold Company is presented in Table 1. The higher metal concentration was observed for Fe (3.019±0.04 mg/l, while lead had lower value 0.024±0.00 mg/l. Cadmium was not detected in the samples. The metal concentrations occurred in the sequence, Fe> Zn> Cu> Sn > Mn > Ni> Cr> Pb. The values of Cu (0.520±0.003mg/l), Ni (0.090±0.003 mg/l) and Mn (0.220±0.002 mg/l) were above the recommended values of 0.05 mg/l, 0.02mg/l and 0.10mg/l for Cu, Ni, and Mn. reported by FAO/WHO (2000) respectively. The concentration of trace metals in water sample influenced by effluents from Ground Cereals and Oil Company recorded higher concentration for Fe (4.031±0.04 mg/l) and lower concentration for Co (0.025±0.000mg/l). The concentration of metals occurs in the sequence, Fe> Zn> Cu> Sn> Mn> Ni> Cr> Ph> Co. Cadmium was not detected in the samples (Table 2). The values of Cu (0.494±0.026 mg/l) Ni (0.086±0.003 mg/l) and Mn (0.236±0.005 mg/l) exceeded the recommended values of 0.05 mg/l, 0.002 mg/l and 0.110 mg/l reported by (FAO/WHO 2000) respectively. The concentration of trace metals reported in this work was higher than the values reported by Al-Zarah (2014) [3] but lower than the control sample as shown in Table 3.
| Sample Element | Water | Soil | Vegetables | FAO/WHO (2000) Water | FAO/WHO (2004) Soil | FAO/WHO (2007) Vegetable |
|---|---|---|---|---|---|---|
| Cu | 0.451±0.024 | 0.541±0.015 | 0.491±0.023 | 0.05 | 100 | 40 |
| Zn | 0.754±0.021 | 1.096±0.04 | 0.586±0.02 | 3.00 | 300 | 60 |
| Pb | 0.014±0.00 | 0.101±0.023 | 0.015±0.000 | 0.05 | 100 | 0.3 |
| Ni | 0.066±0.003 | 4.016±0.011 | 0.045±0.005 | 0.02 | 50 | 1.5 |
| Sn | 0.390±0.020 | 4.217±0.040 | 0.181±0.006 | 50.0 | 5.0 | - |
| Cr | 0.057±0.001 | 0.081±0.005 | 0.035±0.000 | 0.50 | 1.0 | 1.5 |
| Fe | 2.763±0.030 | 6.416±0.014 | 0.315±0.022 | 10.0 | 40 | 50 |
| Co | 0.017±0.000 | 0.065±0.012 | 0.042±0.011 | 0.10 | 50 | 0.05-0.10 |
| Mn | 0.223±0.004 | 0.386±0.015 | 0.145±0.02 | 0.10 | - | 5.0 |
| Cd | BDL | BDL | BDL | 0.01 | 3.0 | 0.1 |
Table text extracted from the original PDF; superscript letters are shown inline. The original table image is below.
View original table image
| Sample Element | Water | Soil | Vegetables | FAO/ WHO (2000) Water | FAO/ WHO (2004) Soil | FAO/ WHO (2007) Vegetable |
|---|---|---|---|---|---|---|
| Cu | 0.494±0.026 | 0.523±0.015 | 0.511±0.03 | 0.05 | 100 | 40 |
| Zn | 0.773±0.012 | 1.014±0.05 | 0.574±0.011 | 3.00 | 300 | 60 |
| Pb | 0.032±0.002 | 0.109±0.004 | 0.040±0.000 | 0.05 | 100 | 0.3 |
| Ni | 0.086±0.003 | 50081±0.200 | 0.097±0.005 | 0.02 | 50 | 1.5 |
| Sn | 0.395±0.016 | 4.900±0.022 | 0.255±0.004 | 50.0 | 5.0 | - |
| Cr | 0.062±0.001 | 0.075±0.003 | 0.036±0.000 | 0.50 | 1.0 | 1.5 |
| Fe | 4.031±0.014 | 7.204±0.015 | 0.335±0.06 | 10.0 | 40 | 50 |
| Co | 0.015±0.000 | 0.064±0.003 | 0.039±0.000 | 0.10 | 50 | 0.05-0.10 |
| Mn | 0.236±0.005 | 0.443±0.012 | 0.144±0.002 | 0.10 | - | 5.0 |
| Cd | BDL | 0.015±0.000 | 0.010±0.000 | 0.01 | 3.0 | 0.1 |
Table text extracted from the original PDF; superscript letters are shown inline. The original table image is below.
View original table image
| Sample Element | Water | Soil | Vegetables | FAO/WHO (2000) Water | FAO/WHO (2004) Soil | FAO/WHO (2007) Vegetable |
|---|---|---|---|---|---|---|
| Cu | 0.520±0.03 | 0.015±0.012 | 0.475±0.024 | 0.05 | 100 | 40 |
| Zn | 0.835±0.02 | 1.294±0.04 | 0.615±0.017 | 3.00 | 300 | 60 |
| Pb | 0.024±0.001 | 0.030±0.011 | 0.025±0.003 | 0.05 | 100 | 0.3 |
| Ni | 0.090±0.003 | 4670±0.02 | 0.063±0.004 | 0.02 | 50 | 1.5 |
| Sn | 0485±0.02 | 4.727±0.05 | 0.203±0.01 | 50.0 | 5.0 | - |
Table text extracted from the original PDF; superscript letters are shown inline. The original table image is below.
View original table image
Trace metal concentrations in soil samples
The concentration of trace metals in soil in the vicinity of NASCO House Hold Company also revealed higher concentration of Fe (7.515±0.020mg/l) and lower concentration of Cd (0.013±0.000mg/l) as presented in Table 1. The metal concentrations occurred in the sequence Fe> Sn> Ni> Zu> Mu> Cr> Co> Pb> Cu> Cd. The concentrations of metals in soil sample were below the recommended values reported by (FAO/WHO 2004). Trace metal concentrations in the vicinity of Grand Cereals and Oil Mills Company recorded higher values for Fe (7.204±0.015 mg/l) and lower values for Cd (0.015±0.000 mg/l). The concentrations of trace metals occurred in the sequences Fe> Ni> Sn> Zn> Cu> Mn> Cr> Co> Pb> Cd (Table 2). The values of trace metal were below the recommended values reported by FAO/WHO (2003). Tomno et al. (2020) reported higher concentrations of trace metals in soil in urban stream in municipality in Kenya. The result obtained in the work was higher than control samples as shown in Table 3.
Trace metal concentrations in vegetables samples
Trace metals content in vegetables grown in the vicinity of NASCO Household Company revealed higher concentration of Fe (3.520±0.003mg/kg) and lower concentration of Pb (0.025±0.003 mg/kg) as presented in Table 1. The metal concentrations occurred in the sequence, Fe> Cu> Zn> Su> Mn> Ni> Cr> Co> Pb. Cadmium was not detected in vegetables samples. Trace metal concentrations in vegetables grown in the vicinity of Ground Cereal and Oil Mills Company showed higher concentrations of Zn (0.574±0.011 mg/kg) and lower concentration of Cd(0.010±0.000 mg/kg). Metal contents occurred in the sequence, Zn> Cu> Fe> Su> Mn> Ni> Pb> Co> Cr> Cd (Table 2). The concentration of metals in the vicinity of the two industrial areas were within the recommended values reported by (FAO/WHO, 2007) but higher than the control samples. Bigdeli and Seilspour (2008) [5] reported lower concentration of trace metals in vegetables grown in soils irrigated with wastewater.
Conclusion
The concentrations of Cu, Ni and Mn in water samples influenced by effluents from the two industries more above the recommended values reported by FAO/WHO (2000). The metals concentrations in vegetables were within FAO/WHO safety limits for human consumption. Although vegetables were accumulating trace metals from soil irrigated with wastewater and effluents, their concentrations did not exceed the recommended values reported by FAO/WHO (2007). But with continuous discharge of wastewater and effluents into streams and farmlands could constitute serious health risk because these metal can bio accumulate in biological systems. The production and manufacturing companies requires function as domestic and industrial effluent treatment plants designed to engineering standards and operating based on best practices. To reduce the accumulation of heavy metals in soil and vegetables calls for integrated approaches of monitoring, enforcement of compliance standards and public education from key stakeholders, including the
References
18 in the original paper- Alam MGM, Snow ET, Tanaka A. Arsenic and metal concentration in vegetables grown in Santa village, Bangladesh. The science of Total Environment,2003:308:83-96.
- Al-Zarah AI. Assessments of trace elements in wastewater effluent in Al-Hassa, Eastern Province of the Kingdom of Saudi Arabia. Research Journal of Environmental Sciences,2014:8(8):405-4421.
- Arora M, Kiran B, Rani A, Rani S, Kaur B et al. Heavy metal accumulation in vegetables irrigated with water from different sources. Food Chemistry,2008:111:811815.
- Bigdeli M, Seisepour M. Investigation of metals accumulation in some vegetables irrigated with wastewater in Shahre-Key Iron and toxicological implication, American-Eurasian. Journal Agricultural and Environmental science,2008:4(1):86-92.
- Casas MI, Rosas H, Soles M, Lac C. "Heavy metals and metalloids in sediments from the Nobergat Basin Span." Environmental Geology shift,2003:44(3):325332.
- Chambers PA, Allard M, Walker SL, Marsalek J, Lawrence J. Impact of municipal wastewater effluents on Canadian waters: A review. Water Quality Journal Canada,1997:32:659-713.
- Communications in Soil Science and Plant Analysis,2011:36(7):889-906.
- David SK, Minati S. Levels and health risk assessment of heavy metals in soil, water and vegetables of Dar-es Salam, Tanzania. Article ID 1402674:9, 2018.
- Gungshik JR, Salami ST, Gushit JS, Eseyin AE, Ibrahim M. Seasonal variation in trace metal concentrations in soil and vegetables sampels from selected mining areas in Jos South and Barkin Ladi LGA, Plateau State: Journal Chemistry Society of Nigeria,2021:46(6):0963-0971.
- Joseph CA, Stephen I, Audu ZM, Victor OO. Assessment of heavy metals, pH, organic matter and organic carbon in road sides soils in Te Makindi metropolis Benue State, Nigeria. Journal of Environmental Protection,2013:4:618-628.
- Kenya Atlas in "Nairobi and its Environment". A Burgeoning City, 2007, 154-160.
- Musyoka SM, Ngila JC, Mamba BB. Remediation studies of trace metals in natural and treated water using surface modified biopolymer nanofibres. Physical Chemistry. Earth parts A/B/C,2013:66:45-50.
- Nager HM, Mahmud NU, Sultana S, Gomes R, Rahman M. Trace metal content in vegetables grown in industrial polluted and unpolluted areas. Bangladesh. Journal of Agricultural Research,2012:37(3):515-527.
- Njugura SM, Yan X, Cituru RW, Wang QJ. Assessment of macrophyte, heavy metal and nutrient concentrations in water of Nairobi River. Environmental Monitoring Assessment,2017:189:9.
- Parbu PC. Impact of heavy metal contamination of Akaki River of Ethiopia on Soil and metal toxicity on cultivated vegetables. Electronic Journal of Environmental Agricultural and Food Chemistry,2009:8(9):818-827.
- Sahu M, Kacholi DS. "Heavy metal levels in Amaranthus species from Chung Ombo-Michicha and in Temeke District, Dar-es Salam, Tanzania". Asian Journal of Chemistry,2016:28(5):1125-1126.
- Tomno RM, Nzewe JK, Mailu SN, Shitanda D, Waswa F. Heavy metal contamination on water, soil and vegetables in urban streams in Machakos, municipality, Kenya. Scientific Africa, 2020, 9(2020). https://doi.org/10:10161/j.sciaf2020e00539.
- United States Environmental Protection Agency USEPA, 2006. en.m.wikipidia.org. Retrieved on,2010:9:06.