
Research article · 2022 · Full text
International Journal of Advanced Chemistry ResearchDevelopment of yield forecast models with raw data through stepwise regression analysis (forward method) and discriminant function analysis for pigeon pea crop on Chhattisgarh plain zone
Volume 4(2) · Pages 183–186 · DOI: 10.33545/26646781.2022.v4.i2c.97 ↗
Research areasAgricultural Economics and Practices
Abstract
Author-writtenUnder this investigation we studied about minimization of weekly data through stratification and Simple Randon Sample technique. Individual effect of weather parameters has been considered under the study. Forecasting model developed on two statistical technique i.e. Stepwise Regression Analysis (Forward Method) technique and Discriminat Function Analysis technique. Both the techniques are found very suitable for the district wise and zone level pre-harvest forecast for the pigeonpea crop on Chhattisgarh. Models fitted with the Stepwise Regression Analysis on 35 variables and Time Trend (T) for Zone. The developed model is showing best fit on the basis of very high value of significance and maximum R2 (84%) for the plain Zone, highly significant at 0.1% level of significance and models fitted with DFA then 2 Discriminant score (ds1 and ds2) and Time Trend (T) the models found highly significant and R2 value 69% for plain zone for Pigeonpea crop. The developed model has been validated by the error parameters viz. Minimum MAE, Minimum MSE, Minimum RMSE, Minimum PE and Minimum PD along with maximum R2. These developed models are useful to farmers of Chhattisgarh to decide their future prospects and possible course of action in advance. This was very challenging task for the researchers to develop a precise & accurate and best fit model for the future forecast. May this study will clear the fog through new methodology and also will create the new way on the direction of forecast.
Summary
Source-checkedPlain-language reading of the full paper, prepared with AI and checked against the text. Each point links to the authors' own words.
Why it matters
- Pre-harvest crop production forecasts are essential for supporting the rural economy. View evidence ↗
- Advance weather and climatic information allows farmers to better manage their resources to improve outcomes. View evidence ↗
- Early yield forecasts help farmers optimize cropping patterns and agricultural practices to increase overall yield. View evidence ↗
The question
- The primary objective of the study was to develop different approaches for forecasting crop yield before harvest using weather parameters. View evidence ↗
What they did
- The study used pigeon pea yield data from various districts in Chhattisgarh, covering 30 years (1990-91 to 2019-20) for some districts and 22 years (1998-99 to 2019-20) for others. View evidence ↗
- Seven weather variables, including temperature, humidity, sunshine hours, rainfall, and wind velocity, were collected over 30 weeks of the cultivation period. View evidence ↗
- The researchers developed forecasting models using two statistical techniques: Stepwise Regression Analysis (Forward Method) and Discriminant Function Analysis (DFA). View evidence ↗
- For the Stepwise Regression Analysis, a total of 35 variables were selected for one district. View evidence ↗
- For the Discriminant Function Analysis, data was categorized into Congenial, Average, and Adverse groups based on pigeon pea productivity. View evidence ↗
What they found
- The Stepwise Regression Analysis model for the plain zone showed a high fit with an R² of 84%, which was highly significant at the 0.1% level. View evidence ↗
- The Discriminant Function Analysis (DFA) model, using two discriminant scores and time trend, was also highly significant with an R² of 69% for the plain zone. View evidence ↗
- Validation of the Stepwise Regression model resulted in a Mean Absolute Error (MAE) of 706.14, Percent Error (PE) of 37.52, Mean Squared Error (MSE) of 519347, and Root Mean Square Error (RMSE) of 720.66. View evidence ↗
- The DFA model demonstrated high efficiency with a Percent Error (PE) of 4.94 and a highly significant R² of 0.69 at the 0.1% level. View evidence ↗
What it means
- The authors concluded that both Stepwise Regression Analysis and Discriminant Function Analysis are very suitable for pre-harvest forecasting of pigeon pea at both district and zone levels in Chhattisgarh. View evidence ↗
- The developed models are recommended as useful tools for farmers in Chhattisgarh to plan their future agricultural actions in advance. View evidence ↗
Visual summary
3 visualsIllustrations explain the paper; charts are replotted from the paper's own table values.
Comparison of Forecasting Approaches
AI-generated conceptual illustration (pigeon pea plants). It explains the idea and does not show study data.
View source evidence ↗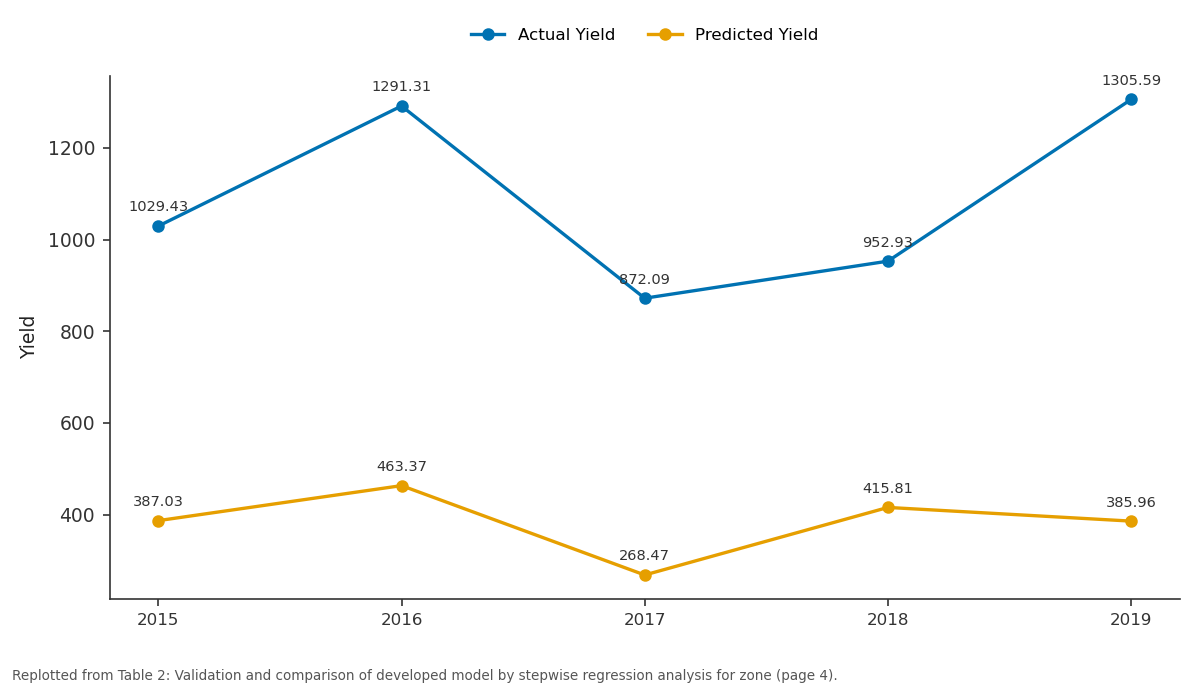
Actual Yield and Predicted Yield: 2015 vs 2016 vs 2017 vs 2018 vs 2019
Replotted from Table 2 (page 4) of the original paper. Every bar is the paper's own table value.
View source evidence ↗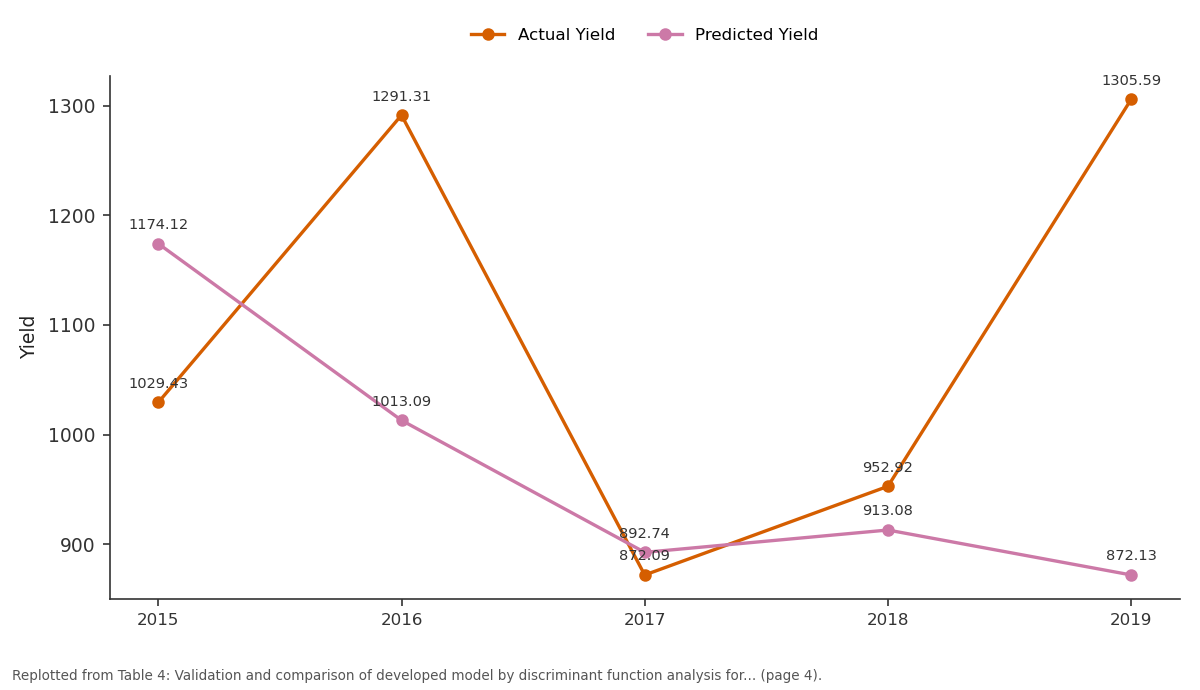
Actual Yield and Predicted Yield: 2015 vs 2016 vs 2017 vs 2018 vs 2019
Replotted from Table 4 (page 4) of the original paper. Every bar is the paper's own table value.
View source evidence ↗Figures & tables
From the original paper Table 1
 Table 2
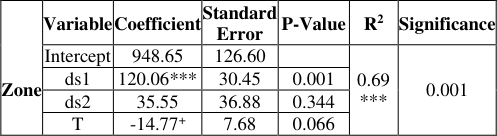 Table 3
 Table 4
Introduction
Forecasting is a technique that uses historical data as inputs to make informed estimates that are predictive in determining the direction of future trends. Forecast of the crop production at suitable stages of crop period before the harvest are vital for rural economy. Forecasts are used by the government & industry to protect life and property. The weather and climatic information plays a major role before and during the cropping season and if provided in advance it can be helpful in stirring the farmer to form and use their own resources in order to gather the benefits. The advance knowledge of weather parameters in a particular region is advantageous in effective planning. The final estimates based on objective crop-cutting experiments are of limited utility as those become available quite later after the crop harvest. The Statistical techniques employed for forecasting purposes should be able to provide objective, consistent and comprehensible forecasts of crop yield with reasonable precisions well in advance before the harvest. Several studies have been carried out to forecast crop yield using weather parameters etc. In the current situation of India faces increasing population and industrial development which are adversely distressing the crop yield in India. Keeping in mind early crop yield forecast will help farmer to formulate the cropping pattern, agricultural practices which will results in to the increase yield of the farmers. Therefore main objective of the present study was to develop different approaches for forecasting the rice yield before harvesting with help of weather parameters. The forecasting of crop yield may be done by using three major objective methods (i) biometrical characteristics (ii) weather variables and (iii) agricultural inputs (Agrawal, et al. 2001).
Material and Methods
Material and Methods
Data on Yield
The yield data on Pigeonpea crop for 30 years (1990-91 to 2019-20) for Raipur, Bilaspur, Durg and Rajnadgaon Districts. 22 year (1998-99 to 2019-20) for Dhamtari, Mahasamund, Kawardha, Korba and Janjgir have been procured from the published booklets and official website (http://agridept.cg.gov.in/index.htm) of the Directorate of Agricultural, Govt. of Chhattisgarh to development of the statistical models at zone level.
Weather data
The weekly weather data (1990-91 to 2019-20) procured from the department of Agro meteorology, Indira Gandhi Agriculture University, Raipur (CG.) and used for the Chhattisgarh plain Zone for Pigeonpea crop. The data of 7 weather variables have been procured for 30 th weeks of the Pigeonpea crop cultivation period. Which include 27 th SMW from first year to 4 th SMW from 2 nd year. The variables are Maximum Temperature (Tmax) °C, Minimum Temperature (Tmin) °C, Morning Relative Humidity (RH-I)%, Afternoon Relative Humidity (RH-II)%, Bright Sunshine hours (SS) hours/day, rainfall (mm), Wind Velocity (WV) respectively.
Statistical Methodology
Crop yield is affected by technological change and weather variability. Technological change includes the impact of increased fertilizer applications, improved management practices, pest and diseases control, improved genetic qualities of seed and other technological factors design to increase yield. However, in order to study the individual effect of weather variable and joint effect of pair of weather variables, the procedures laid down Agrawal et.al. 1986 have been applied. They expressed the effect of change in weather variables on yield in w th week as a linear function of respective correlation coefficients between yield and weather variables. The trend effect is generally expected to consider on time series yield data, but its effect to be removed from yield known as trend effect because calculation of correlation coefficients of yield with weather variables to be used as weights.
Procedure of Stratification to minimize the weeks
Divide the population of N units into strata. Let the i th stratum have Ni. I = 1, 2......., k number of units. The strata are constructed such that they are no overlapping and homogeneous with respect to the characteristic under study. Such that Draw a sample of size n from i th (i=1, 2,......,k) stratum using simple random sampling independently from each stratum. All the sample units drawn from each stratum with constituent a stratified sample of size.
Effect of Individual Weather Variable
Total five weather variable selected from stratums. Now all five selected variables along with T has been used for individual effect. The model for individual effect is given as follows.
Y = bo + b1S1P1wk+ b2S2P2wk +…… + b5 Si
Y = bo + b1S1P1wk+ b2S2P2wk +…… + b5 Si
Forecast Model based on Weather Variables through Stepwise Regression Analysis (Forward Method)
This is new proposed method with all five variables selected for each weather parameters. Total number of selected variables for one district is 35.
Y = a + βi Si Pj wk
Y = a + βi Si Pj wk
Procedure to develop forecasting model through Discriminant Function Analysis
The data is divided in to three groups viz. Congenial, Average and Adverse on the basis of productivity of Pigeonpea for the given time series data. In this procedure discriminant scores have been computed using the un weighted and weighted averages (weather indices) for the first weather variable (Here, discriminating factors will be only two). This process is continued up to seventh weather variables, and finally we get two discriminant scores ds1, and ds2. Using crop-yield as dependent variable and discriminant scores ds1, ds2 and the time trend T as independent variable, the following model is fitted for the development of forecast model.
Model: y = βo+ β1ds1+ β2ds2+ β3T
Where; y = Crop yield. βo = Intercept of the model. βi (i=1,2,3)= The regression coefficients. ds1 and ds2 are the two discriminant scores. T = trend variable (T= 1, 2….n); n is crop-years under consideration.
Validation and comparison of the models
Following procedures have been used for the comparison and the validation of the developed models. These procedures are given bellow.
Percent Deviation
The formula for computation of Percent Deviation of forecast yield from actual yield is given by Md. Azfar et al. (2015) [2] . This measures the deviation (in percentage) of forecast from the actual yield data. The formula for calculating the percent deviation of forecast is given below: Where ssres and sst are the residual sum of square and the total sum of square respectively. R 2 never decreases when a regressed is added to the model, regardless of the value of the contribution of the variable in the model. Therefore, it is difficult to judge whether an increase in R 2 is really important.
Results and Discussion
Results and Discussion
Model developed for Zone on Pigeon pea through Stepwise Regression Analysis
The multiple Regression model has been obtained: Y = 1517.82 -44.61 S3P4w18 -14.94 S3P4w17 -27.52 S4P6w26 -34.60T showing significant. The value of R 2 found i.e. 84% which is highly significant at 0.1% level of significance and the model is also found highly significant.
Figures and tables from the paper
| District | Constant | Entered Variable | Coefficient | P-Value | Std. Error | R2 | Significance |
|---|---|---|---|---|---|---|---|
| Zone | 1517.82 | S3P5w18 | -44.61** | 0.009 | 15.32 | 0.84*** | 0.001 |
| S3P6w17 | -14.94*** | 0.001 | 3.31 | ||||
| S4P7w26 | -27.52** | 0.005 | 8.64 | ||||
| T | -34.60*** | 0.001 | 3.63 |
Table text extracted from the original PDF; superscript letters are shown inline. The original table image is below.
View original table image
| — | Year | Actual Yield | Predicted Yield | MAE | MSE | RMSE | PE | PD | R2 | Significance |
|---|---|---|---|---|---|---|---|---|---|---|
| Zone | 2015 | 1029.43 | 387.03 | 706.14 | 519347 | 720.66 | 37.52 | 62.40 | 0.84*** | 0.001 |
| 2016 | 1291.31 | 463.37 | 64.12 | |||||||
| 2017 | 872.09 | 268.47 | 69.22 | |||||||
| 2018 | 952.93 | 415.81 | 56.36 | |||||||
| 2019 | 1305.59 | 385.96 | 70.44 |
Table text extracted from the original PDF; superscript letters are shown inline. The original table image is below.
View original table image
| Zone | Variable | Coefficient | Standard Error | P-Value | R2 | Significance |
|---|---|---|---|---|---|---|
| Intercept | 948.65 | 126.60 | 0.69 *** | 0.001 | ||
| ds1 | 120.06*** | 30.45 | 0.001 | |||
| ds2 | 35.55 | 36.88 | 0.344 | |||
| T | -14.77+ | 7.68 | 0.066 |
Table text extracted from the original PDF; superscript letters are shown inline. The original table image is below.
View original table image
| — | Year | Actual Yield | Predicted Yield | MAE | MSE | RMSE | PE | PD | R2 | Significance |
|---|---|---|---|---|---|---|---|---|---|---|
| Zone | 2015 | 1029.43 | 1174.12 | 183.38 | 57649.85 | 240.10 | 4.94 | -14.06 | 0.69*** | 0.001 |
| 2016 | 1291.31 | 1013.09 | 21.55 | |||||||
| 2017 | 872.09 | 892.74 | -2.37 | |||||||
| 2018 | 952.92 | 913.08 | 4.18 | |||||||
| 2019 | 1305.59 | 872.13 | 33.20 |
Table text extracted from the original PDF; superscript letters are shown inline. The original table image is below.
View original table image
References
4 in the original paper- Agrawal R, Jain RC, Jha MP. Models for studying rice crop weather relationship. Mausam. 1986;37(1):67-7.
- Agrawal R, Jain RC, Mehta SC. Yield forecast based on weather variables and agricultural input on agrioclimatic zone basis. Ind. J. Agric. Sci. 2001;71(7):487-90.
- Abu-Ellail FF, Hussein EM, El-Bakry A. Integrated selection criteria in sugarcane breeding programs using discriminant function analysis. Bulletin of the National Research Centre. 2020;44(1):1-14.
- Smith AM, Blackshaw RE. Weed-crop discrimination using remote sensing: A detached leaf experiment. Weed Technology. 2003;17(4):811-820.