
Research article · 2022 · Full text
International Journal of Advanced Chemistry ResearchDetermining water quality for drinking and irrigation of surface water in Oguta Lake
Volume 4(1) · Pages 20–27 · DOI: 10.33545/26646781.2022.v4.i1a.43 ↗
Research areasWater Quality and Pollution Assessment
Abstract
Author-writtenThe study aimed at determining the drinking and irrigation water quality at Oguta through accessing the physicochemical and chemometric parameters. The sampling was conducted during rainy seasons in June, 2021. A total of 25 water samples were collected from 5 stations along the lake, labelled Sw, Ww, Mw, Nw, Ew and were analyzed using standard methods. The results for the physicochemical screening revealed mean values of Temperature (28.3 oC), Electrical Conductivity (2.3 mg/l), pH (5.7), TDS (75.5mg/l), TSS (5.2mg/l), DO (0.3 mg/l), macro elements were present in the following concentrations, Na (1.2 mg/l), K (1.7 mg/l), Ca (22.7 mg/l), Mg (31.8 mg/l), Cl- (217.3mg/l), NO3- (0.4 mg/l), SO42-(8.3mg/l), PO43- (0.3mg/l). The values were lower than the permissible limits set by agencies like NESREA, FMWR and WHO. The chemometric parameters was estimated to determine the WQI, ESP, SAR and CROSS. The WQI revealed that the water has high quality index, meaning that the water has poor quality and is not suitable for drinking. However, the ESP, SAR and CROSS showed that the water is good for irrigation. Therefore, the lake can be used for irrigation with precaution but extensive treatment will be needed before using for domestic purposes. This also calls for an examination into the anthropogenic causes of pollution.
Summary
Source-checkedPlain-language reading of the full paper, prepared with AI and checked against the text. Each point links to the authors' own words.
Why it matters
- Oguta Lake in Nigeria is a critical natural resource used by local populations for domestic water supply, irrigation, fishing, and other economic activities. View evidence ↗
- The water quality of the lake is threatened because it serves as an outlet for sewage disposal. View evidence ↗
The question
- The study aimed to determine if the water in Oguta Lake is suitable for drinking and irrigation by analyzing its physicochemical and chemometric parameters. View evidence ↗
What they did
- In June 2021, during the rainy season, 25 water samples were collected from five stations (Sw, Ww, Mw, Nw, Ew) across the lake. View evidence ↗
What they found
- The mean pH of the lake water was 5.7 (ranging from 5.10 to 6.17), which is below the recommended limit of 6.5–8.5 set by NESREA, FMWR, and WHO. View evidence ↗
- The mean dissolved oxygen (DO) was 0.3 mg/l (ranging from 0.14 to 0.48 mg/l), which is significantly lower than the WHO limit of ≥5.0 mg/l. View evidence ↗
- The mean water temperature was 28.3 °C, falling within the FMWR limit of < 35 °C. View evidence ↗
- Mean concentrations of major cations, Sodium (1.2 mg/l), Potassium (1.7 mg/l), Calcium (22.7 mg/l), and Magnesium (31.8 mg/l), were all below the thresholds set by FMWR and WHO. View evidence ↗
- WQI values across all stations ranged from 101.3095 to 122.9445, categorizing the lake water as having 'poor water quality' and unsuitable for drinking. View evidence ↗
- The Exchangeable Sodium Percentage (ESP) ranged from 2.15% to 2.45%, which indicates the water is good for irrigation. View evidence ↗
What it means
- The authors conclude that while the lake water is suitable for irrigation, it requires extensive treatment before it can be used for domestic purposes. View evidence ↗
- The findings suggest a need to investigate human-driven (anthropogenic) causes of pollution in the lake. View evidence ↗
Visual summary
3 visualsIllustrations explain the paper; charts are replotted from the paper's own table values.
Water Suitability Contrast
AI-generated conceptual illustration (Oguta Lake water and agricultural crops). It explains the idea and does not show study data.
View source evidence ↗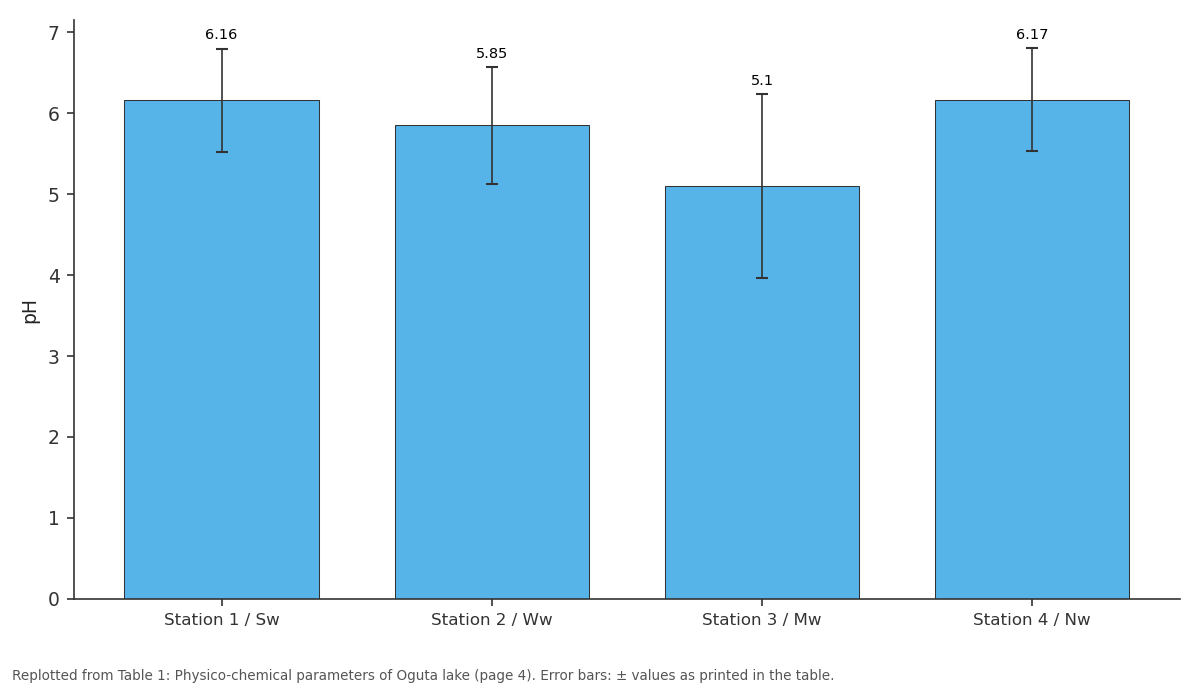
pH: Station 1 / Sw vs Station 2 / Ww vs Station 3 / Mw vs Station 4 / Nw
Replotted from Table 1 (page 4) of the original paper. Every bar is the paper's own table value.
View source evidence ↗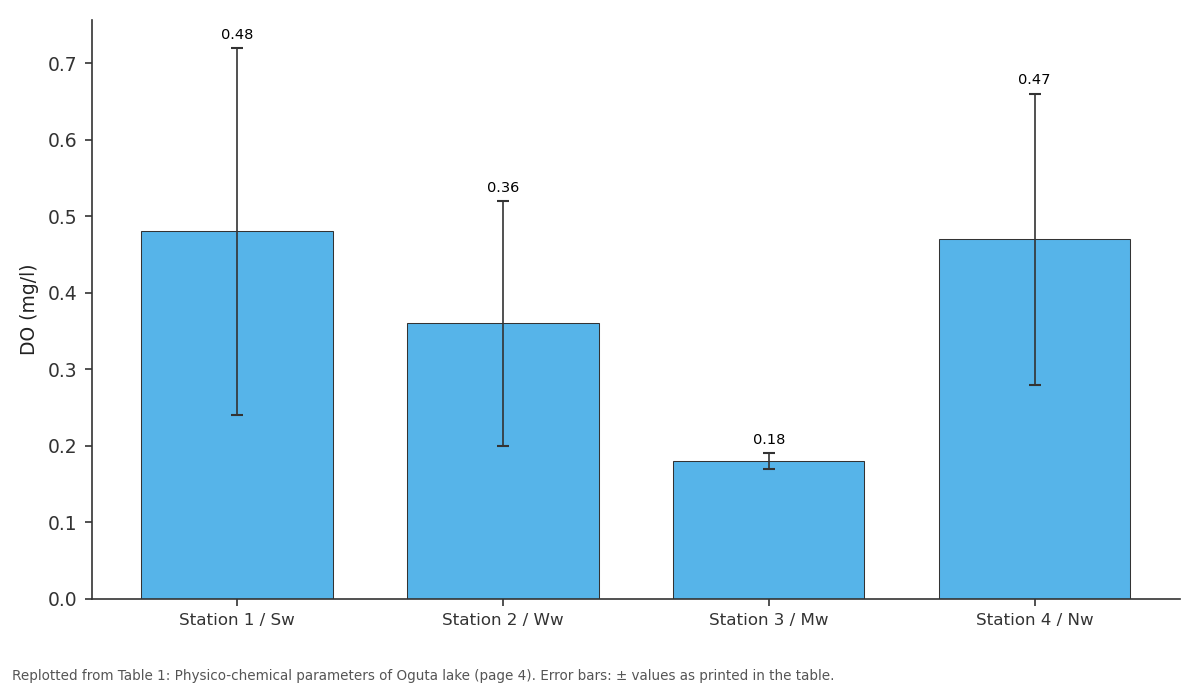
DO (mg/l): Station 1 / Sw vs Station 2 / Ww vs Station 3 / Mw vs Station 4 / Nw
Replotted from Table 1 (page 4) of the original paper. Every bar is the paper's own table value.
View source evidence ↗Figures & tables
From the original paper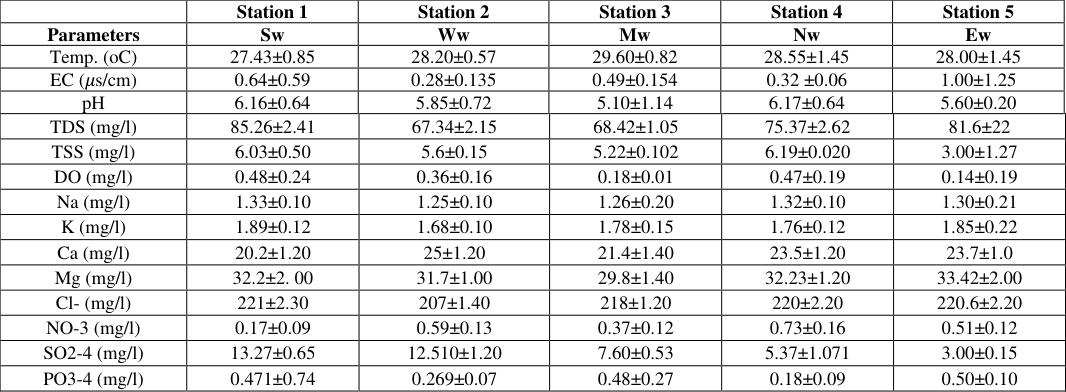 Table 1
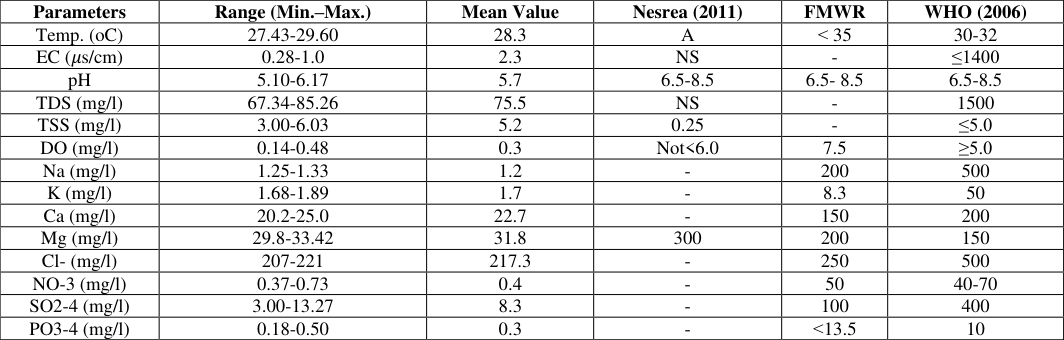 Table 2
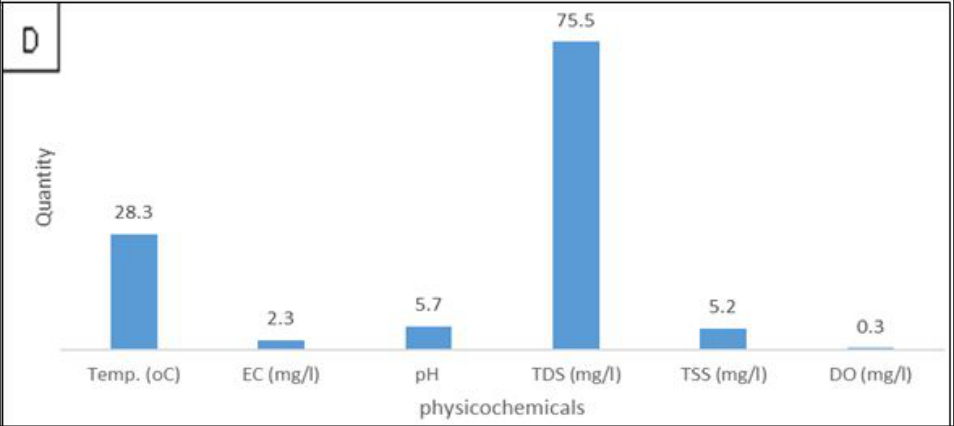 Figure 1
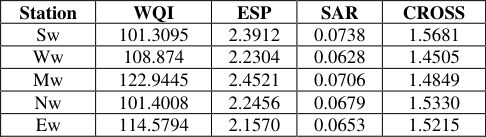 Table 3
Introduction
Comprising over 70% of the Earth's surface, water is undoubtedly the most precious natural resource that exists on our planet. It sets the stage for the evolution of life on earth and is an essential ingredient of all life today. There is no other resource that affects so many areas of the economy of human and environmental health like water. In view of this fact one would expect human beings to have the utmost respect for the resource and safe guard its cleanness. Yet throughout the world people are remarkably short sighted and negligent in this regard [1] . Degradation of surface and groundwater sources is an inherent consequence of economic development and remedial action to compensate for, or to reduce, environmental impacts have always been a lesser priority [2,3] . The world is increasingly forced to face the challenge of how to ensure access to adequate water resources for the expanding populations and economies. Effort in the area of water quality tends to be focused on water treated for portability, industrial/domestic use, or restoration [4,5] . In Nigeria, Oguta Lake is one of the natural water resources of non-marine habitat located in a low-lying (elevation < 50m) platform [6] . The lake is the main source of domestic water supply for the locals and also used for recreation, fishing, transportation, sand mining and irrigation activities [5] . It also constitutes a focal point for sporting, research and tourism development [7] . Unfortunately, the continual use of the lake water for those purposes is threaten as the lake also acts as an outlet for sewage disposal [5,7] . The monitoring and assessment of water quality is an important aspect of inventorying the required data for accurate determination of water pollution issues and for devising appropriate prevention and mitigation strategies. A report by Madu, et al. [8] , evaluated the hydrochemical facie and the quality of Oguta Lake for irrigation using water quality indices. The report revealed that the lake water is good for irrigation at that time. However, the need for continual monitoring and assessment of water quality of the Oguta Lake cannot be over emphasized as Lakes and ponds are part of a complex and dynamic ecosystem that are in a constant state of change.
Besides, consumption of polluted water itself has led to the outbreak of water borne diseases in Nigeria such as includes diarrhoea, cholera and other gastrointestinal illnesses [9] . Thus, this investigation was designed to assess the water quality of the Oguta Lake for drinking and irrigation purposes.
The aim was achieved by carrying out physicochemical analysis of water samples and using water quality indices such as ESP, SAR and CROSS to determine the drinking and irrigation water quality.
Materials and Methods Study Area
Imo State is located in South-Eastern Nigeria; currently, the State is famous for its largest natural lake or fresh water lake, Lake Oguta. The lake is located in a low-lying platform, at 50 m above sea level, between latitudes 5°4''and 5°44' N, and longitudes 6°45'and 6°50' E. Four rivers (Njaba, Awbuna, Utu and Orashi) are connected to the lake [10] . However, all year round, rivers Njaba and Awbuna discharges into the lake, while Utu Stream flows in during the rainy season. The river Orashi flows past the lake in its South-Western portion. It is recorded that, the total annual inflow from the rivers and streams is about 25,801 m3, while the annual return and overland flow into the lake is estimated to be about 69,000 and 138,000 m3. Also, the annual recharge of the lake from precipitation is about 693,000 m3, while the annual groundwater inflow into the lake has been estimated (2,750,400 m3) [6] . Indeed, the total annual water inflow, heavily outweighs the total annual outflow, thus, the lake is adequately recharged all the year round.
Sample collection, preservation and preparation
In June 2021, a total of 25 sub-samples (25 surface water) were collected for the study. The 25 sub-samples were pooled and homogenized to form 5 samples each marked with reference to our position, south water Sw, west water Wm, middle water Mw, north water Nw, and east water Ew.
(i.e. 5 sub-samples per point). The sub-samples were collected following a "W" shaped design. The grab sampling technique (sampling was conducted in a way to avoid collecting surface scum) was used for collecting water samples at the depth of collection was about 0.3 m. The water samples was collected in 500 mL high-grade polyethylene. The sampling materials used were previously soaked and rinsed in 10% HNO3 overnight. After collection of samples, the bottles were capped tightly and stored at 4 •C to prevent evaporation and transported to the Old Chemistry laboratory, Imo State University, Owerri for analysis. All sampling and preservation methods strictly followed standard protocol as described by American Public Health Association (APHA), American Water Works Association (AWWA), Water Environment Federation (WEF) 1999 [11,12] .
Physicochemical Parameters
All sample analysis was carried out following standard protocol [13,14] The phosphorus was determined by the vanadate colorimetric method. Nitrate was determined using the Nitrate Nitrogen Comparator. Sulphate was determined using turbidimetric method according to method 4500 of AWWA, WEF, APHA. Chloride was done using argentometric method according to EPA method 9253.
Determination of Metallic elements:
The water sample was digested using aqua-regia. 1 ml of the water sample was weighed into a test tube and digested with 24 ml of aquaregia for 3days. The supernatant is then filtered using a sieve. The concentrations of Na, K, Mg, and Ca in the respective water samples were then determined using Perkins Elmer A Analyst 400 Atomic Absorption Spectrophotometer [13] .
Data analysis
Experiments were conducted in triplicate and reported as mean plus or minus standard deviation. Basic descriptive statistics was conducted and minimum, maximum and mean values were reported.
Chemmometric Analysis
Water Quality Index (WQI): Water Quality Index (WQI) is normally used for water suitability for consumption. WQI gives a single number which characterizes the overall quality of the water. WQI was computed using equation.
2)
Where: Wi is weight age factor (calculated from equation 7), K is a constant value and it is calculated using equation
Suitability of surface water for Irrigation purposes:
Three major irrigation models were used for assessing the suitability of the lake water for irrigation purposes. The models include exchangeable sodium percentage (ESP), sodium absorption ratio (SAR) and cation ratio of structural stability (CROSS). These models largely depend on the sodium concentration of the river and also major cationic concentrations.
Exchangeable sodium percentage (ESP): ESP was computed using equation ( 7) as the ratio of sodium to the cation exchange capacity (CEC) of the water.
Physicochemical assessment of the samples
The characterization results for the samples from five (5) stations is presented in table 1. The table is presenting some descriptive statistics such as the range, mean and standard deviation. sets photosynthetic process of phytoplanktons [14] . A high temperature increases the metabolic rate of aquatic organisms and causes a reduction in the level of dissolved oxygen (DO). This may retard the growth and reproduction of fish and in severe condition result to death of marine life.
| — | Station 1 | Station 2 | Station 3 | Station 4 | Station 5 |
|---|---|---|---|---|---|
| Parameters | Sw | Ww | Mw | Nw | Ew |
| Temp. (oC) | 27.43±0.85 | 28.20±0.57 | 29.60±0.82 | 28.55±1.45 | 28.00±1.45 |
| EC (𝜇s/cm) | 0.64±0.59 | 0.28±0.135 | 0.49±0.154 | 0.32 ±0.06 | 1.00±1.25 |
| pH | 6.16±0.64 | 5.85±0.72 | 5.10±1.14 | 6.17±0.64 | 5.60±0.20 |
| TDS (mg/l) | 85.26±2.41 | 67.34±2.15 | 68.42±1.05 | 75.37±2.62 | 81.6±22 |
| TSS (mg/l) | 6.03±0.50 | 5.6±0.15 | 5.22±0.102 | 6.19±0.020 | 3.00±1.27 |
| DO (mg/l) | 0.48±0.24 | 0.36±0.16 | 0.18±0.01 | 0.47±0.19 | 0.14±0.19 |
| Na (mg/l) | 1.33±0.10 | 1.25±0.10 | 1.26±0.20 | 1.32±0.10 | 1.30±0.21 |
| K (mg/l) | 1.89±0.12 | 1.68±0.10 | 1.78±0.15 | 1.76±0.12 | 1.85±0.22 |
| Ca (mg/l) | 20.2±1.20 | 25±1.20 | 21.4±1.40 | 23.5±1.20 | 23.7±1.0 |
| Mg (mg/l) | 32.2±2. 00 | 31.7±1.00 | 29.8±1.40 | 32.23±1.20 | 33.42±2.00 |
| Cl- (mg/l) | 221±2.30 | 207±1.40 | 218±1.20 | 220±2.20 | 220.6±2.20 |
| NO-3 (mg/l) | 0.17±0.09 | 0.59±0.13 | 0.37±0.12 | 0.73±0.16 | 0.51±0.12 |
| SO2-4 (mg/l) | 13.27±0.65 | 12.510±1.20 | 7.60±0.53 | 5.37±1.071 | 3.00±0.15 |
| PO3-4 (mg/l) | 0.471±0.74 | 0.269±0.07 | 0.48±0.27 | 0.18±0.09 | 0.50±0.10 |
Table text extracted from the original PDF; superscript letters are shown inline. The original table image is below.
View original table image
High temperatures cause suspended solid to settle at a faster rate (2.5 times faster at 35˚C than at 0˚C). Density and viscosity of water will also reduce at higher temperatures [14] . Generally, many factors such as the weather condition, sampling time, and location impact on the increase or decrease of temperature. The pH of the water samples was slight acidic with mean values between 5.60±0.20 and 6.17±0.64. The acidic pH may have resulted from humic acid (HA) formed from decaying organic matter which is consistent with the report of the Niger Delta swamp environment [15,16] . The acidic pH range appears to be suitable for the survival of freshwater fish and bottom dwelling invertebrates [17] . The pH affects many chemical and biological processes, for example low pH permits toxic elements and compounds to become mobile and available for uptake by aquatic plants and animals [18] . influence the water conductivity as well as the temperature also have an effect on the conductivity [12] . The conductivity result is an indication that the lake contain dissolves salt in little quantity. Generally, most of the freshwaters
International Journal of Advanced Chemistry Research https://www.chemistryjournals.net conductivity is ranging from 10 to 1000 𝜇S/cm.
Nevertheless, the concentration can exceed about 1000 𝜇S/cm in the water that receiving pollution [2] . The DO level found in all the stations is low but adequate for the planktons to survive and to do various physiological activities [12] . Overall, oxygen generally becomes dissolved in surface waters as a result of diffusion from the atmosphere and aquatic-plant photosynthesis. In general, dissolved oxygen is consumed by the degradation of organic matter in water. The Cations studied were Na, K and Ca and Mg with highest values of 1.33±0.10, 1.89±0.12, 20.2±1.20 and 32.2±2.00 respectively all revealed in the station Sw.
The cations were lower than the set limit. In this research, the anions analyzed were chlorides, nitrate, sulphate, and phosphate. The results presented in table 1 showed the following ranges, chlorides 207±1.40 (mg/l) to 221±2.30
(mg/l), nitrates 0.17±0.09 (mg/l) to 0.73±0.16 (mg/l), sulphates 3.00±0.15 (mg/l) to 13.27±0.65 (mg/l), phosphates 0.18±0.09 (mg/l) to 0.50±0.10 (mg/l). water temperature showed mean of 28.3 oC which was within the standard range of 30-32 oC, pH was 5.7 which shows slight acidic tendency of the water out of the recommended limit of 6.50-8.50, this suggests safe agricultural but questions its domestic uses [18]. The conductivity of samples from this study with mean (2.3 𝜇s/cm) is very low when compared to the permissible limit of 1400 µS/cm set by WHO. The solids in the water, TDS and TSS are below the threshold set by WHO and NESREA. Furthermore, Dissolved oxygen (0.3mg/L) is also less than the permissible limit of 6.5-8 mg/L and indicates an optimal condition for the growth of aquatic fauna [19] .
Major cations such as Na, K, Ca and Mg showed mean of 1.2, 1.7, 22.7 and 31.8 mg/L respectively. All the results were below the threshold limit recommended for river water. The result for the anions studied was as NO -mg/L), PO43-(0.3 mg/L), Cl-(217.3mg/l), and SO 2-(8.3 mg/L).
All studied anions were lower than the permissible limit set by WHO/FMWR. The results were also represented in the chart in figure 1. Water Quality Index for Drinking
The WQI in the present study was calculated from the physicochemical parameters of the water samples and result presented in table 3. The parameters used include pH, DO, EC, TDS, TSS, calcium, magnesium, chloride, nitrate, and sulphate. Following the judgment for WQI given by Ramakrishnaiah [19] , which is Excellent Water Quality (EWQ). The values from < 50 = Excellent water quality; 50-100 = Good water quality; 100-200 = Poor water quality; 200-300 = Very poor water quality; >300 = and Unsuitable for Drinking (UnSFD) (when WQI>300). The individual indexes showed Sw (101.3095), Ww (108.874), Mw (122.9445), Nw (101.4008), and Ew (114.5794) suggesting that the lake is of "poor water quality". Therefore, suggesting that the lake is contaminated. This could be due to time of sampling, runoffs from contaminated rivers or the anthropogenic activities from the surrounding cities [20,21] .
| Station | WQI | ESP | SAR | CROSS |
|---|---|---|---|---|
| Sw | 101.3095 | 2.3912 | 0.0738 | 1.5681 |
| Ww | 108.874 | 2.2304 | 0.0628 | 1.4505 |
| Mw | 122.9445 | 2.4521 | 0.0706 | 1.4849 |
| Nw | 101.4008 | 2.2456 | 0.0679 | 1.5330 |
| Ew | 114.5794 | 2.1570 | 0.0653 | 1.5215 |
Table text extracted from the original PDF; superscript letters are shown inline. The original table image is below.
View original table image
Exchangeable sodium percentage (ESP)
Exchangeable sodium percentage is considered worldwide to be probably the most important soil factor affecting dispersion in soils and, consequently, soil crusting. There will be serious negative effects of Na on soil physical conditions, such as crusting and reduction in infiltration, due to clay dispersion which occur when the ESP exceeds 15%. The computed ESP is presented in table 3.2. The % ESP for the entire sampling sites ranged from (2.15 to 2.45) % suggesting good water for irrigation [20].
Excess exchangeable sodium in sodic soils has a marked influence on the physical soil properties. As the proportion of exchangeable sodium increases, the soil tends to become more dispersed which results in the breakdown of soil aggregates and lowers the permeability of the soil to air and water.
SAR and CROSS
The sodium hazard of irrigation water is expressed as the 'sodium adsorption ratio (SAR)'. Although sodium contributes directly to the total salinity and may also be toxic to sensitive crops, such as fruit trees, the main problem with a high sodium concentration is its effect on the physical properties of soil (soil structure degradation).
The CROSS and the SAR models basically furnish similar information except that concept of SAR addresses only the effects of sodium on the stability of soil aggregates.
Meanwhile, potential negative effects of high potassium (K)
and manganese (Mg) concentrations are ignored by the SAR, which is taken care of in CROSS model. The CROSS is considered a more updated SAR model. The values in the water ranged from SAR (0.0628-0.0738) and for CROSS (1.4505 -1.5681). There are no general standard limit set for SAR and CROSS. However, a report on SAR for Manawatu District Council (MDC) recommends that CROSS should be kept below 13 to avoid structural problems developing [5,22] .
Therefore, the low SAR and CROSS indicates that the water from the Oguta lake is good for irrigation purposes.
Conclusion
The study has successfully characterized the surficial water of Oguta lake using physico-chemical analysis and chemometric models. Information from the models is viewed as simplified concepts of environmental issues.
Thereby making the understanding of these environmental issues easy for policy makers, this way decisions on environmental issues are quickly arrived at. Present study has revealed that the lake water is contaminated/polluted with high water quality index. Although it is particularly good water for agricultural activities as irrigation water revealed by low % ESP, SAR and CROSS.
Acknowledgement
Acknowledgment Authors acknowledge Group Research in Analytical Chemistry, Environment and Climate Change (GRACE&CC) for the financial support throughout the current research work.
Figures and tables from the paper
| Parameters | Range (Min.–Max.) | Mean Value | Nesrea (2011) | FMWR | WHO (2006) |
|---|---|---|---|---|---|
| Temp. (oC) | 27.43-29.60 | 28.3 | A | ˂ 35 | 30-32 |
| EC (𝜇s/cm) | 0.28-1.0 | 2.3 | NS | - | ≤1400 |
| pH | 5.10-6.17 | 5.7 | 6.5-8.5 | 6.5- 8.5 | 6.5-8.5 |
| TDS (mg/l) | 67.34-85.26 | 75.5 | NS | - | 1500 |
| TSS (mg/l) | 3.00-6.03 | 5.2 | 0.25 | - | ≤5.0 |
| DO (mg/l) | 0.14-0.48 | 0.3 | Not<6.0 | 7.5 | ≥5.0 |
| Na (mg/l) | 1.25-1.33 | 1.2 | - | 200 | 500 |
| K (mg/l) | 1.68-1.89 | 1.7 | - | 8.3 | 50 |
| Ca (mg/l) | 20.2-25.0 | 22.7 | - | 150 | 200 |
| Mg (mg/l) | 29.8-33.42 | 31.8 | 300 | 200 | 150 |
| Cl- (mg/l) | 207-221 | 217.3 | - | 250 | 500 |
| NO-3 (mg/l) | 0.37-0.73 | 0.4 | - | 50 | 40-70 |
| SO2-4 (mg/l) | 3.00-13.27 | 8.3 | - | 100 | 400 |
| PO3-4 (mg/l) | 0.18-0.50 | 0.3 | - | ˂13.5 | 10 |
Table text extracted from the original PDF; superscript letters are shown inline. The original table image is below.
View original table image
References
19 in the original paper- Adebayo ET, Ekeledo CB. A bio-evaluation of the effects of anthropogenic activities around Oguta Lake, south -east, Nigeria. Int J Hydro,2019:3(6):480-486. DOI: 10.15406/ijh.2019.03.00214.
- Kigbu AA, Mohammed US. Physico -chemical Parameters and fish abundance of River Amba in Lafia, Nasarawa state, Nigeria. Journal of Aquatic science, 2013, 272-273.
- E C Ebere, Verla AW, N J Egejuru. "pH variations and chemometric assessment of borehole water in Orji, Owerri Imo State, Nigeria."Journal of Environmental Analytical Chemistry,2018:5(2):1-9.
- Verla Andrew Wirnkor, Enyoh Christian Ebere, Verla Evelyn Ngozi, Peter Ndu Okeke, Shirish S Pingale. Chemometric Assessment of Orashi River after Confluence with Oguta Lake Indonesian Journal of Fundamental and Applied Chemistry, 2019, 4(3). DOI: 10.24845/ijfac.v4.i3.91
- Ahiarakwem CA, Nwankwor GI, Onyekuru SO, Idoko MA. An Assessment of the Physical and Environmental Aspects of a Tropical Lake: A Case Study of the Oguta Lake Watershed, Niger Delta Basin, Nigeria. American International Journal of Contemporary Research, 2012, 2(7).
- Verla Andrew Wirnkor et al. "Model Assessment of Potential Risk Associated with Common Fish Species from Oguta Lake, Nigeria", International Journal of Advanced Research in Chemical Science,2012:7(9):0918. DOI: https:// doi.org/10.20431/2349-0403.0709002.
- Madu FM, Okoyeh EI, Okolo CM, Aseh P, Elomba UF. Assessment and Hydrochemical Facie of Oguta Lake, Southeastern Nigeria. European Journal of Environment and Earth Sciences,2022:3:1. DOI: http://dx.doi.org/10.24018/ejgeo.2022.3.1.221.
- Nfor BN. Inventory of Quaternary Geology and the Evolution of the Oguta Lake, Southeastern Nigeria. Quat Int,2012:279-280:351.
- World Health Organization Standard, "Drinking Water Guidelines," Geneva, 2006, 6.
- Keith. Compilation of EPA's Sampling and Analysis Methods. 2nd ed. Lewis Publ./CRC Press, Boca Raton, Fla, 1996.
- Akpofure Rim-Rukeh. Physico-Chemical and Biological Characteristics of Stagnant Surface Water Bodies (Ponds and Lakes) Used for Drinking and Domestic Purposes in Niger Delta, Nigeria. Journal of Environmental Protection,2013:4:920-928
- Rim-Rukeh A, Koyeme J, Ikhifa GO, Okokoyo PA. Chemistry of Harvested Rainwater in the Refinery Area of Warri, Nigeria between November 2003 and October 2005," International Journal of Chemistry, PA,2006:16(2):65-74.
- RPI, "Environmental Baseline Studies for the Establishment of Control Criteria and Standards against Petroleum Related Pollution in Nigeria," Research Planning Institute, South Carolina, 1985.
- Arimoro FO, Ikomi RB, Iwegbue. Ecology and Abundance of Oligochaetes as Indicators of Organic Pollution in an Urban Stream in Southern Nigeria," Pakistan Journal of Biological Science,2007:3:446-453.
- Puyate YT, Rim-Rukeh A. "Some Physico-Chemical and Biological Characteristics of Soil and Water Samples of Part of the Niger Delta Area," Nigerian Journal of Applied Sciences & Environmental Management,2008:12(2):135-141.
- Oluyemi EA, Adeyemi AS, Adenuga AA, Makinde WO. Physico-chemical properties and heavy metal content ofwater sources in Ife North Local Government Area of OsunState, Nigeria. Afr. J. Environ. Sci. Technol,2010:4:691-697.Ozoko DC, 2015. Hydrochemistry of lakes in Opi Agu, Enu.
- Gorde SP, Jadhav MV. Assessment of water quality parameters: A review. Int. J. Eng. Res. Appl,2013:3:2029-2035.
- Amadi AN, Olasehinde PI, Okosun EA, Yisa J. Assessment of the water quality index of Otamiri and Ora-miriukwa Rivers. Phy Int,2010:1(2):116-123.
- Lieffering R. "Fielding Wastewater Treatment Plant Upgrade-Sodium and Potassium Irrigation Risk Assessment. "SAR Report For Manawatu District Council (MDC) Final, 2013, 1-9.
Cited by 1
From OpenAlex, OpenCitations and reference lists read by Scinovex
- Profiling the Contamination Level and Pollution Load Index of Borehole Water from Esako West LGA, Edo State, Nigeria ↗
Moses Okeahialam Ekeoma, Verla Evelyn Ngozi, Paulinus Rachael, Iheoma Ezichi Mbuka-Nwosu, Andrew Wirnkor Verla · Asian Journal of Chemical Sciences · 2023
Fresh water has continued to decrease both in quality and quantity with a wide variety of pollutants entering into fresh water resources. In this research the quality of fresh water was being accessed using standard method of analysis of water. Physiochemical parameters and heavy metal content were determined and data was assessed using contamination factors, degree of contamination and pollution…
❝ 0PDF