
Research article · 2022 · Full text
International Journal of Advanced Chemistry ResearchDevelopment of prescription based fertilizer recommendation for Brinjal (Solanum melongena L.) in mid hills of Himachal Pradesh
Volume 4(1) · Pages 66–70 · DOI: 10.33545/26646781.2022.v4.i1a.121 ↗
Research areasAgricultural Science and FertilizationAgricultural Economics and PracticesCrop Yield and Soil Fertility
Abstract
Author-writtenThe present investigation was conducted at the Experimental Farm of the Department of Soil Science, Chaudhary Sarwan Kumar Himachal Pradesh Krishi Vishvavidyalaya, Palampur (32 6' N latitude and 76 3' E longitude). The soil of the experimental site was Typic Hapludalf, silty clay loam in texture, acidic in reaction, medium in available N, high in available P and low in available K at the initiation of the experiment. The experiment was conducted as per the technical programme and methodology of AICRP on Soil Test Crop Response. The experiment was conducted in two phases. In first phase soil fertility gradient was developed by dividing experimental field into three equal strips and applying graded doses of fertilizers in these strips and growing of exhaust fodder crop Wheat. In the second phase i.e. next season test crop brinjal (var. Hisar shyamal) was grown by dividing each strip into 24 plots having 21 treated and 3 controlled. Response to selected combinations of three levels of FYM (0, 10 and 20 t/ha), four levels of nitrogen (0, 50,100 and 150 kg N ha-1), four levels of phosphorus (0, 30, 60 and 90 kg P2O5 ha-1) and four levels of potassium (0, 25, 50 and 75 kg K2O ha-1) at different fertility levels of brinjal was studied. The initial values of the Alkaline KMnO4 extractable nitrogen ranged from 226 to 289 kg N ha-1, Olsen’s phosphorus ranged from 20 to 40 kg P ha-1 and neutral normal NH4OAc extractable potassium ranged from 148 to 235 kg K ha-1 in the experimental field. The total uptake of N, P and K ranged from 33.9 to 145.2, 5.1 to 21.6 and 23.9 to 82.9 kg ha-1 by brinjal, respectively. In the present investigation the fresh fruit yield ranged from 163.9 to 375.6 q ha-1. The nutrient requirement for production of one quintal of fruit yield of brinjal was found to be 0.30 kg Nitrogen, 0.05 kg Phosphorus and 0.19 kg Potassium. Percent contribution of nitrogen, phosphorus and potassium was 16.71, 26.29 and 14.20 from soil, whereas from other sources as FYM was 7.64, 3.91 and 6.65 percent. Contribution from fertilizer as a percentage was 40.91, 19.11 and 76.23, using with FYM for nitrogen, phosphorus and potassium, respectively. Fertilizer adjustment equations developed for conjoint use of fertilizers with the help of basic data are: FN= 0.74 T – 0.41 SN – 0.19 ON, FP= 0.24 T – 1.38 SP – 0.20 OP, FK= 0.25T – 0.19 SK - 0.09 OK.
Summary
Source-checkedPlain-language reading of the full paper, prepared with AI and checked against the text. Each point links to the authors' own words.
Why it matters
- Improper use of chemical fertilizers in India has shifted the NPK ratio from an ideal 4:2:1 to 10:2.7:1, negatively impacting crop productivity. View evidence ↗
- The Soil Test Crop Response (STCR) approach allows for precise fertilizer recommendations by considering both existing soil nutrients and the desired yield target. View evidence ↗
The question
- The study aimed to develop a judicious and economical fertilizer recommendation for brinjal in a specific agro-climatic zone using the STCR approach. View evidence ↗
What they did
- The experiment was conducted at the Experimental Farm of the Department of Soil Science in Palampur, Himachal Pradesh. View evidence ↗
- Researchers tested combinations of three levels of farmyard manure (FYM) and four levels each of nitrogen, phosphorus, and potassium. View evidence ↗
- Soil samples from 0-15 cm depth were analyzed for available nitrogen, phosphorus, and potassium before transplanting. View evidence ↗
What they found
- The highest average brinjal yield was 289.8 q ha-1 in strip III, compared to 261.1 q ha-1 in strip II and 240.15 q ha-1 in strip I. View evidence ↗
- To produce one quintal of brinjal in the study area, the nutrient requirements were 0.30 kg Nitrogen, 0.05 kg Phosphorus, and 0.19 kg Potassium. View evidence ↗
- Soil contributed 16.71% N, 26.29% P, and 14.20% K, while fertilizers contributed 40.91% N, 19.11% P, and 76.23% K. View evidence ↗
- Farmyard manure (FYM) contributed 7.64% Nitrogen, 6.65% Phosphorus, and 3.91% Potassium. View evidence ↗
- For a target yield of 250 q ha-1, nitrogen fertilizer needs decreased from 71.13 kg ha-1 to 62.97 kg ha-1 as soil nitrogen increased from 240 to 260 kg ha-1. View evidence ↗
- For a 250 q ha-1 yield target, phosphorus fertilizer requirements dropped from 37.32 kg ha-1 to 16.69 kg ha-1 when soil phosphorus rose from 10 to 25 kg ha-1. View evidence ↗
- For a 250 q ha-1 yield target, potassium fertilizer needs decreased from 33.18 kg ha-1 to 18.28 kg ha-1 as soil potassium increased from 120 to 200 kg ha-1. View evidence ↗
What it means
- The study concludes that fertilizer doses should be inversely adjusted to soil test values and directly adjusted to the desired target yield. View evidence ↗
Visual summary
1 visualsIllustrations explain the paper; they do not show study data.
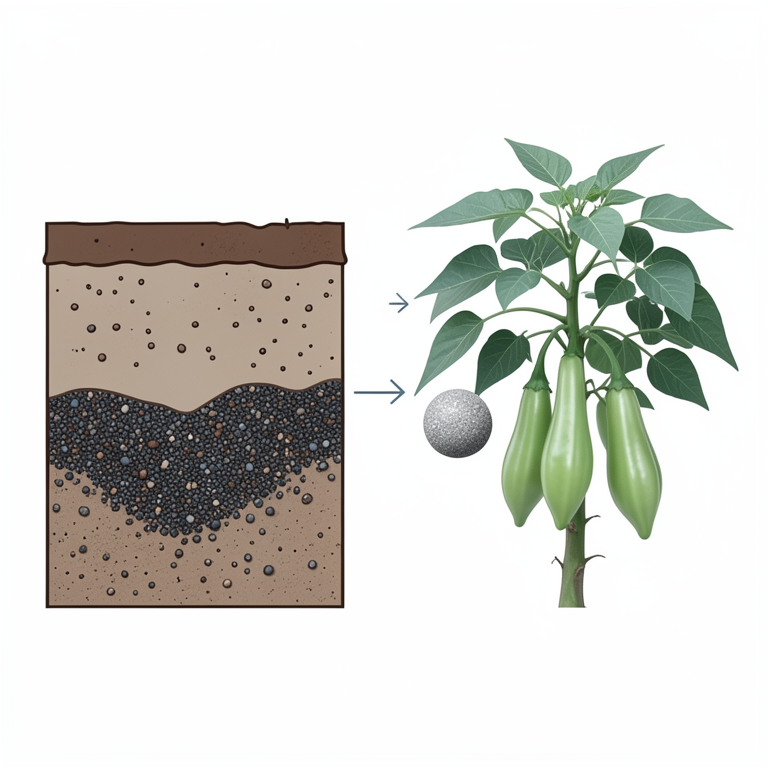
Fertilizer Dose Relationship
AI-generated conceptual illustration (Brinjal plants (Solanum melongena L.)). It explains the idea and does not show study data.
View source evidence ↗Figures & tables
From the original paper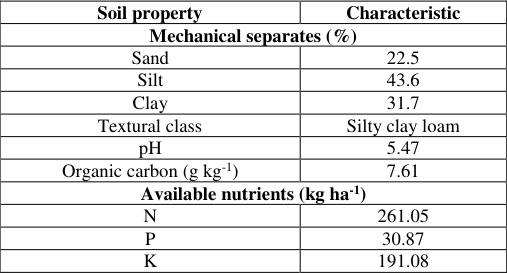 Table 1
 Table 2
 Table 3
 Table 4
 Table 5
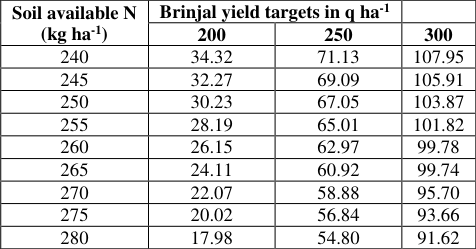 Table 6
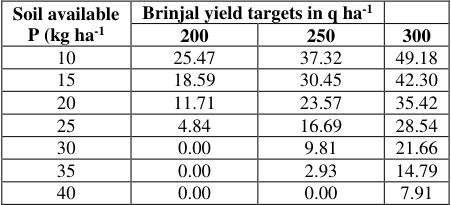 Table 7
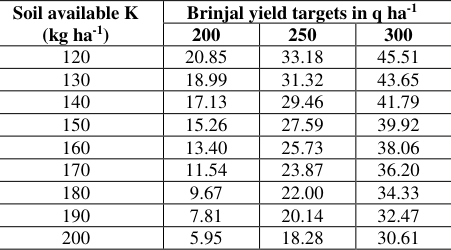 Table 8
Introduction
India has come a long way from facing food crisis in 1950's to becoming a selfsufficient nation in 2021 with increase in production and many improved technologies. India holds an eminent position in world's agriculture by holding first rank in pulse production which accounts for 25.72 million tonnes, second position in wheat and rice with production of 109.52 million tonnes and 122.27 million tonnes respectively and fourth rank in various coarse grains. India has seen remarkable increase in food grain production from 50.82 million tonnes in 1950's to 308.65 million tonnes in 2021. The reason behind this sudden increase of production in 1960's is the introduction of high input driven green revolution package which comprise of introduction of high yielding varieties, application of chemical fertilizers, pesticides, expansion of irrigation and more improved technology. Green revolution has helped a lot in meeting the demand of increasing population but it also led to the increase in consumption of chemical fertilizers. It was observed that the rate of fertilizer consumption was more as compared to the increase in rate of food grain production. The injudicious use of chemical fertilizers has increased the optimum NPK ratio from 4:2:1 which is ideal for crop productivity to the current ratio which is 10: 2.7: 1 in India (Qureshi et al. 2018) [6] and also the fertilizer response ratio in the irrigated areas of the country has decreased from 13.4 kg grain / kg nutrient applied in 1970's to just 3.7 kg in 2005. The injudicious use of chemical fertilizers had led to the various of detrimental effects like decrease in productivity, deterioration of soil health leading to decrease in microbial activity, organic matter, pH, soil crusting, soil compaction etc., farmer's committing suicide due to non-repayment of loans which was taken in hope to increase the production and profit, and various harmful diseases in humans like excess of nitrate beyond 10 ppm in drinking water led to the blue baby syndrome in infants. Keeping in view of these problems, there is a need for the development of systemic approach of fertilizer recommendation which helps in judicious use of chemical fertilizers and organic manures and helps in sustaining and maintaining soil health. Soil test crop response is a refined method of fertilizer recommendations for varying soil test values. This approach takes into account the soil contribution and yield level for recommending fertilizer dose for a particular crop. It provides more scientific basis for fertilizer recommendations taking into account the actual demand and supply (native and external) of nutrients for a particular crop. It is specific to a given type of soil, crop and climatic condition situation. It also maintains harmony between "harmonizing the crop" and "harmonizing the soil".
The concept of fertilizer prescription for desired crop yields was first introduced by Truog in 1960. In India, Ramamoorthy et al. (1967) [9] established the theoretical basis and experimental proof for the fact that the Liebig's Law of minimum operates equally well for N, P and K. They showed that the relationship between yield of grain and uptake of nutrients follow a linear relationship. This implies that for obtaining a given yield, a definite quantity of the nutrients must be taken up by the plant. Once this requirement is known for a given yield, the fertilizers doses can be estimated taking into account the efficiency of contribution from the soil available nutrients and from the fertilizer nutrients. This forms the basis for fertilizer recommendations for targeted yield concept. This is also called as "Prescription based fertilizer recommendation" or "rationalized fertilizer prescription approach" in which inherent soil fertility and yield level of the crop are taken in to account while recommending the fertilizer doses. Among the various methods of fertilizer recommendations, the one based on yield targeting is unique in the sense that this method not only indicates soil test based fertilizer dose but also the level of yield the farmer can hope to achieve if good agronomic practices are followed in raising the crop. Considering above point, the present investigation was carried out with the objective to recommend judicious and economic application of fertilizer for brinjal crop for particular growing season and agro-climatic zone using soil test crop response approach. Brinjal or eggplant is an herbaceous annual pant with erect or semi spreading habits. It is a perennial plant but cultivated as annual. It develops into bushy plants with large, fuzzy leaves that grow to a height of about 60 to 120 cm. The plant is erect, compact, and well branched. It has a rather fibrous or lignified root system. Brinjal contains 92.70 g moisture, 1.4 g protein, 0.30 g fat, 0.30 g minerals, 0.30 g fiber, 4.0 g carbohydrates, 18.0 mg calcium, 18.0 mg oxalic acid, 47.0 mg phosphorous, 2.0 mg potassium, 3.1µg vitamin A, 0.11 mg riboflavin and 12.0 mg vitamin C per 100 g of edible portion (Choudhary, 1976) [3] . India occupies second position in brinjal production with a share of 23.3 per cent of the world's brinjal production. In India, brinjal occupies fourth position in area among the vegetable crops and contributed 8 % of the total production. The area under brinjal in India during 2020-21 has been reported as 7.50 lakh hectare with a production of 13.15 million metric tonnes. West Bengal stands first with production of 3.02 lakh tonnes.
Material and Methods
Material and Methods
Experimental Site
The field experiment was conducted during the year 2021 at Choudhary Sarwan Kumar Krishivishvavidyalaya, Palampur to study the response of soil and applied nutrients for balanced fertilization in brinjal. The experimental farm is located at 32˚ 6' N Latitude and 76˚ 3" Longitude at an elevation of about 1290 meters above mean sea level. The experimental site is situated in the Palampur valley of Kangra district in Himachal Pradesh. The experimental site falls under the mid hill wet-temperate agro-climatic zone. Taxonomically, the soil of the study area belongs to the order "Alfisol" and the sub-group "Typic Hapludalf".
Before sowing of the test crop, soil samples were collected and was analysed for its physio-chemical properties and are presented in table 1.The soil of the experimental field had a silty clay loam texture. The soil of the experimental field was categorized as low in available nitrogen, high in phosphorus and medium in available potassium as well as organic matter.
| Soil property | Characteristic |
|---|---|
| Mechanical separates (%) | |
| Sand | 22.5 |
| Silt | 43.6 |
| Clay | 31.7 |
| Textural class | Silty clay loam |
| pH | 5.47 |
| Organic carbon (g kg-1) | 7.61 |
| Available nutrients (kg ha-1) | |
| N | 261.05 |
| P | 30.87 |
| K | 191.08 |
Table text extracted from the original PDF; superscript letters are shown inline. The original table image is below.
View original table image
Experimental design and Layout
As per the technical plan of the All India Coordinated Research Project on Soil Test Crop Correlation, the field experiment was conducted on a pre-established fertility gradient to achieve a wide variation in soil fertility for a successful soil test crop response correlation study and to reduce the interference of other soil and management factors affecting crop output (which was not the part of the present study). The pre-established fertility gradient was maintained by growing wheat as an exhaust crop which was harvested on 16 th April 2021. One month prior to transplanting, seedlings of brinjal variety Hisar Shaymal was grown in nursery. Then the fertility gradients were further divided into 72 plots i.e. each gradient into 24 equal plots. Seedlings were transplanted to main field on 27 th April 2021 when they attained a height of about 10-15 cm having 2-3 leaf stage with 45 cm × 45 cm planting distance. The experiment was carried out according to a plan of layout and a combination of treatments with different levels of nutrients (Table 2). There were 24 selected treatment combinations of N, P, K and FYM in each gradient. All these treatments were superimposed randomly in each gradient. The sources of nutrient used were urea for N, which was applied in three split doses, half as basal dose at the time of transplanting and remaining half at interval of 30 and 45 days after transplanting, full basal dose for P and K were applied during transplanting in the form of single superphosphate (SSP) and murate of potash (MOP), respectively. Farmyard manure (FYM) (60% moisture, 0.82% N, 0.36% P2O5 and 0.74% of K2O) was applied as basal prior to transplanting. The brinjal crop was finally harvested on 14 th October 2021. Soil and Plant Analysis Soil samples were collected at 0-15 cm depth from 72 plots before transplanting of brinjal and analyzed for alkaline KMnO4-N (Subbiah and Asija 1956) [11] , Olsen-P (Olsen et al. 1954) [12] and ammonium acetate extractable-K (Black et al. 1965) [13] . Plant and fruit samples were also collected at maturity, dried, then processed and analyzed for total N, P and K content. The data obtained from soil and plant analysis were used to calculate the basic data viz., nutrient requirement (NR), per cent contribution from soil (CS), fertilizer (Cf), FYM (Cfym) and fertilizer and FYM (Cf).
| Nutrient levels | Recommended doses of fertilizer (RDF) | FYM(t ha-1) | N (kg ha-1) | P2O5 (kg ha-1) | K2O (kg ha-1) |
|---|---|---|---|---|---|
| 0 | 0 | 0 | 0 | 0 | 0 |
| 1 | 50% of RDF | 10 | 50 | 30 | 25 |
| 2 | 100% of RDF | 20 | 100 | 60 | 50 |
| 3 | 150% of RDF | 150 | 90 | 75 |
Table text extracted from the original PDF; superscript letters are shown inline. The original table image is below.
View original table image
Basic Data Calculation
With the help of basic data fertilizer prescription equations were developed (Rao and Srivastava 2000) as follows: Nutrient requirement for production of one quintal of economic produce
The values were reported as kg of N, P2O5 and K2O required for producing one quintal of brinjal. Contribution of nitrogen, phosphorus and potassium from soil (Cs) Efficiency of soil nutrients was calculated from soil test values of unfertilized plots (control plots).
Contribution of concerned nutrient from fertilizer without FYM (Cf)
The efficiency of fertilizer was calculated from the plots treated without FYM Contribution of nitrogen, phosphorus and potassium from FYM (Cfym)
The efficiency of FYM for any nutrient was calculated from those plots treated with FYM.
Fertilizer requirements for targeted yield Fertilizer requirements of N, P2O5 and K2O for targeted yields were worked out as follows:
Fertilizer prescription equation (non-IPNS) Fertilizer prescription equation (IPNS)
Where, NR = Nutrient requirement of N, P2O5 or K2O (kg q - 1 ), T = Target yield (q ha -1 ), Cs =Contribution from soil of N, P2O5 or K2O (%), Cf = Contribution from fertilizer of N, P2O5 or K2O (%), STV = Soil test value of N, P2O5 or K2O (kg ha -1 ), Co = Contribution from organic nutrients in fraction, N = Content of N, P2O5 or K2O in organic matter (kg ha -1 ).
Statistical Analysis
The nutrient requirement, contribution of nutrients from soil, fertilizers and organic source (FYM) were analyzed by different formulae (as stated above) using software package developed by All India Project on Soil test crop Response correlation, at Indian Institute of Soil Science, Bhopal. The ready reckoner for different soil test values was also generated. The ready reckoner for different soil test values was generated.
Results and Discussion Yield Response and Nutrient uptake
The data on yield and nutrient uptake studies of brinjal in three different gradients with different levels of nutrient doses of fertilizers indicated that the highest average yield (289.8 q ha -1 ) was recorded in strip III followed by second strip (261.1 q ha -1 ) and lowest in first strip (240.15 q ha -1 ). The data revealed that maximum average nutrient uptake (90.1, 13.5 and 54.7 kg ha -1 of N, P and K, respectively) was recorded from strip III followed by strip II (78.6, 12.0 and 49.1 kg ha -1 of N, P and K, respectively) and lowest in strip I (73.1, 10.6 and 45.8 kg ha 1 of N, P and K, respectively) (Table 3). The results are in conformity with Bhatt et.al (2021) [1] . Maximum response of brinjal in terms of nutrient uptake and yield in strip III can be explained due to addition of higher doses of NPK in strip third which has reflected in brinjal due to residual effect. This was due to combined effect i.e. residual as well as addition of more nutrients that resulted in augmenting nutrient uptake and yield of brinjal. The lower uptake in control plots may be due to lower yield obtained in these plots. Addition of fertilizers significantly enhanced its uptake over control. These results corroborate the finding of Singh et al. (2005) [10] , who have reported that an increase in the levels of nutrients increased the uptake of nutrients due to increase in growth attributing characters like plant height, leaves number, weight, size and yield were influenced by N application.
| Particulars | Strip I | Strip II | Strip III | Whole field |
|---|---|---|---|---|
| Fresh yield (q ha-1) | 163.9-330.9 (240.2) | 165.7-364.4 (261.6) | 169.2-375.6 (289.8) | 163.9-375.6 (263.8) |
| Nitrogen Uptake | 33.9-126.2 (73.1) | 36.7-132.6 (78.6) | 42.0-145.2 (90.1) | 33.9-145.2 (80.6) |
| Phosphorus Uptake | 5.0-17.3 (10.6) | 6.2-19.4 (12.0) | 7.3-21.6(13.5) | 5.0-21.6 (12.1) |
| Potassium Uptake | 23.9-72.4 (45.8) | 26.1-75.9 (49.1) | 30.1-82.9 (54.7) | 23.9-82.9 (49.9) |
Table text extracted from the original PDF; superscript letters are shown inline. The original table image is below.
View original table image
Fertilizer Requirement
The fertilizer dose was calculated using fertilizer prescription equation (Table 5) having the range of soil test values and target yield of brinjal with 10 t FYM (Table 6,7,8). At a soil test value of 240 kg N ha -1 , 71.13 kg of nitrogen per hectare was required to achieve the target yield of 250 q ha -1 , however at a soil test value of 260 kg N ha -1 , only 62.97 kg of nitrogen fertilizer was required to achieve the same yield target. Furthermore, if the nitrogen soil test value reaches to 280 kg ha -1 then only 54.80 kg N ha -1 is required to achieve the same target, whereas for achieving the target yield of 200 q ha -1 , only 17.98 kg N ha -1 was required at same test value. The data on phosphorus requirements of brinjal is presented in table 4.9. Similarly, at a lower soil test value of 10 kg ha -1 , 37.32 kg ha -1 of fertilizer phosphorus was required for a target yield of 250 q ha -1 . Whereas, for the same yield target (250 q ha -1 ) at soil test values of 25 kg P2O5 ha -1 , 16.69 kg ha -1 phosphorus fertilizer was needed. If the soil test value of phosphorus reaches to 40 kg ha -1 , no dose of fertilizer phosphorus was required to satisfy the same yield targeted. However, at a soil test value of 25 kg ha -1 , only 4.84 kg ha -1 of fertilizer phosphorus was required for achieving the target yield of brinjal 200 q ha -1 . Likewise, nitrogen and phosphorus, fertilizer requirement of potassium for target yield of 250 q ha -1 at a lower soil test value i.e. 120 kg ha -1 was 33.18 kg ha -1 , whereas at other existing soil test value of 200 kg ha -1 , only 18.28 kg ha -1 of potassium fertilizer was required for same target yield. The results indicated that as the soil test value increases, the fertilizer doses were decreasing within the same target yield, while at the same test values, the fertilizer doses were increasing as the target yield increasing. The findings are in conformity with study of Kirankumar et al. (2019) [4] . They reported that the general recommendation dose for hybrid brinjal in Andhra Pradesh was 200:100:150 kg ha -1 of N, K2O and P2O5, respectively along with application of 25 t FYM ha -1 for an average yield of 40-50 t ha -1 . While the fertilizer doses as per targeted yield model was 171:87:111 kg ha -1 along with 25 t FYM ha -1 for the yield level of 60 t ha -1 . It indicated from the above results that there was a net saving of 72, 40 and 58 kg ha -1 of fertilizer N, P2O5 and K2O, respectively. 19× SK Where, T= yield target (q ha -1 ), SN= Alkaline KMnO4-N, SP= Olsen's-P (kg ha -1 ), SK= Amm. Ac. -K (kg ha -1 ), ON =Amount of N applied through FYM (kg ha -1 ), OP= Amount of P applied through FYM (kg ha -1 ) and OK= Amount of K applied through FYM (kg ha -1 ), FN= Fertilizer dose of nitrogen (kg ha -1 ), FP2O5 = Fertilizer dose of phosphorus (kg ha -1 ), FK2O = Fertilizer dose of potassium (kg ha -1 ), respectively.
| Soil available N (kg ha-1) | Brinjal yield targets in q ha-1 | — | — |
|---|---|---|---|
| 200 | 250 | 300 | |
| 240 | 34.32 | 71.13 | 107.95 |
| 245 | 32.27 | 69.09 | 105.91 |
| 250 | 30.23 | 67.05 | 103.87 |
| 255 | 28.19 | 65.01 | 101.82 |
| 260 | 26.15 | 62.97 | 99.78 |
| 265 | 24.11 | 60.92 | 99.74 |
| 270 | 22.07 | 58.88 | 95.70 |
| 275 | 20.02 | 56.84 | 93.66 |
| 280 | 17.98 | 54.80 | 91.62 |
Table text extracted from the original PDF; superscript letters are shown inline. The original table image is below.
View original table image
| Fertilizer dose (kg ha-1) | N, P2O5, K2O with FYM | N, P2O5, K2O without FYM |
|---|---|---|
| Nitrogen | FN = 0.74×T -0.41× SN - 0.19× ON | FN = 0.74×T -0.41× SN |
| Phosphorus | FP2O5 = 0.24× T – 1.38× SP – 0.20×OP | FP2O5 = 0.24× T – 1.38× SP |
| Potassium | FK2O = 0.25× T - 0.19× SK - 0.09× OK | FK2O = 0.25× T - 0.19× SK |
Table text extracted from the original PDF; superscript letters are shown inline. The original table image is below.
View original table image
| S. No | Particulars | N | P | K |
|---|---|---|---|---|
| 1. | *Nutrient requirement (kg q-1) | 0.30 | 0.05 | 0.19 |
| 2. | Contribution of available nutrient from soil (%) | 16.71 | 26.29 | 14.20 |
| 3. | Contribution from applied fertilizer (%) | 40.91 | 19.11 | 76.23 |
| 4. | Nutrients contribution from applied FYM (%) | 7.64 | 3.91 | 6.65 |
Table text extracted from the original PDF; superscript letters are shown inline. The original table image is below.
View original table image
Figures and tables from the paper
| Soil available P (kg ha-1 | Brinjal yield targets in q ha-1 | — | — |
|---|---|---|---|
| 200 | 250 | 300 | |
| 10 | 25.47 | 37.32 | 49.18 |
| 15 | 18.59 | 30.45 | 42.30 |
| 20 | 11.71 | 23.57 | 35.42 |
| 25 | 4.84 | 16.69 | 28.54 |
| 30 | 0.00 | 9.81 | 21.66 |
| 35 | 0.00 | 2.93 | 14.79 |
| 40 | 0.00 | 0.00 | 7.91 |
Table text extracted from the original PDF; superscript letters are shown inline. The original table image is below.
View original table image
| Soil available K (kg ha-1) | Brinjal yield targets in q ha-1 | — | — |
|---|---|---|---|
| 200 | 250 | 300 | |
| 120 | 20.85 | 33.18 | 45.51 |
| 130 | 18.99 | 31.32 | 43.65 |
| 140 | 17.13 | 29.46 | 41.79 |
| 150 | 15.26 | 27.59 | 39.92 |
| 160 | 13.40 | 25.73 | 38.06 |
| 170 | 11.54 | 23.87 | 36.20 |
| 180 | 9.67 | 22.00 | 34.33 |
| 190 | 7.81 | 20.14 | 32.47 |
| 200 | 5.95 | 18.28 | 30.61 |
Table text extracted from the original PDF; superscript letters are shown inline. The original table image is below.
View original table image
References
11 in the original paper- Bhatt P, Singh S, Pant PK, Chandra R, Gautam P, Bhatt L, Arya A. Assessment of Nutrient Requirement for Spring Brinjal (Solanum melongena L.) through Soil Test Crop Response Approach on North Indian Mollisol. Journal of the Indian Society of Soil Science. 2021;69(2):162-170
- Chaturvedi RK, Singh B, Singh VK. A review on impact of ceramic fertilizers with slow release of nutrient elements for agriculture applications. Int. J Agric. Food Sci. 2021;3(1):01-04. DOI: 10.33545/2664844X.2021.v3.i1a.42
- Kirankumar CH, Santhi R, Maragatham S. Soil test crop response studies under integrated plant nutrition system for brinjal on Incept sol of Andhra Pradesh. International Journal of Chemical studies. 2019;7(3):3156-3162.
- Paswan A, Choudhary AS, Raj S, Sonloi P, Sonwani A. Effect of integrated nutrient management on yield of Brinjal. Int. J Agric. Food Sci. 2022;4(1):12-16. DOI: 10.33545/2664844X.2022.v4.i1a.59
- Qureshi A, Singh DK, Dwivedi S. Nano-fertilizers: A Novel Way for Enhancing Nutrient Use Efficiency and Crop Productivity. International Journal of Current Microbiology Applied Sciences 2018 Feb 10;7(2):33253335
- Rao S. and Srivastava, S. Soil test based fertilizer use a must for sustainable agriculture. Fertiliser News. 2000;45(2):25-38.
- Amruta Katti, Rudresh DL, RS Jawadagi, Shashikanth Evoor, Sanjeevraddi G Reddi. Plant growth promoting microbial consortia for enhancing growth and yield attributes of Brinjal (Solanum melongena L.). Int. cx J Hortic Food Sci. 2022;4(1):176-180.
- Ramamoorthy B, Narasimham RL, Dinesh RS Fertilizer application for specific yield target of sonara-64 wheat. Indian Farming. 1967;17(5):43-45.
- Singh RK, Singh J, De N, Rai M. Integrated nutrient management influences yield and nodulation of pea. Vegetable Science. 2005;32(1):59-61.
- Subbiah BV, Asija GL. A rapid procedure for estimation of available nitrogen in soils. Current Science. 1956;25:259-260.
- Olsen SR, Cole CV, Watanbe FS, Dean LA. Estimation of available phosphorus in soils by extraction with sodium bicarbonate. United State Department of Agriculture Circular. 1954;939:1-17.