
Research article · 2022 · Full text
International Journal of Agriculture and NutritionAssessment of attitude of society towards agro forestry practice in Mekelle zone, Aynalem Kebele
Volume 4(2) · Pages 34–42 · DOI: 10.33545/26646064.2022.v4.i2a.79 ↗
Research areasAfrican Botany and Ecology Studies
Abstract
Author-writtenThis study is conducted to assess the attitude of society towards agro-forestry in Mekelle zone, Aynalem Kebele and carry out numerous indigenous and traditional agro-forestry practice. This research has been done using primary data, which is collected by selfe-administered questionnaire, using simple random sampling technique filled by sample respondents. To address our objectives, descriptive statistics such as frequencies, charts and inferential statistics such as chi-square test and logistic regression model were used for the data analysis. In addition, the study used computer software SPSS, for data analysis and to organize the output. As we observed from the study almost half of the population were less satisfied towards agro-forestry practices. The variables such as the education condition of the societies, the condition of the environment, the area of the plant are planted, the best place the planter prefer to plant the tree and the reason to plant tree at home compound/farm are the significance variable have effect on the attitude of the societies towards to agro-forestry.
Summary
Source-checkedPlain-language reading of the full paper, prepared with AI and checked against the text. Each point links to the authors' own words.
Why it matters
- Agro-forestry is an ecological natural resource management system that integrates trees into farms to provide social, economic, and environmental benefits. View evidence ↗
- Ethiopia faces severe environmental problems due to accelerating deforestation in both forests and farm woodlands. View evidence ↗
- Researching the knowledge and attitudes of local farmers is essential for creating successful agroforestry interventions for rural development. View evidence ↗
The question
- The study aims to assess the attitudes of the society in Aynalem Kebele, Mekelle zone, toward agro-forestry and traditional practices. View evidence ↗
What they did
- The study used a simple random sampling technique to select 97 respondents from a total population of 4,226 people in two ketenes. View evidence ↗
- Primary data was collected using self-administered questionnaires. View evidence ↗
- Data analysis was performed using descriptive statistics (frequencies and charts) and inferential statistics (chi-square tests and a logistic regression model). View evidence ↗
What they found
- Approximately half of the surveyed population expressed less satisfaction with agro-forestry practices. View evidence ↗
- The location of planting affected satisfaction: 56.6% of those planting in home compounds were less satisfied, while only 10.9% of those planting in deforested areas were less satisfied. View evidence ↗
What it means
- The authors conclude that the educational status of the society has a major impact on their attitude toward agro-forestry practices. View evidence ↗
- The authors conclude that the specific location or land used for planting also affects societal attitudes toward agro-forestry. View evidence ↗
Figures & tables
From the original paper Table 1
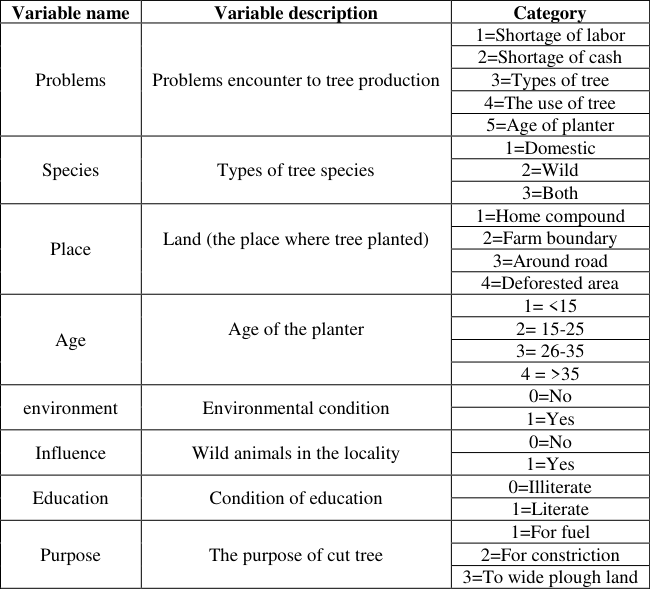 Table 2
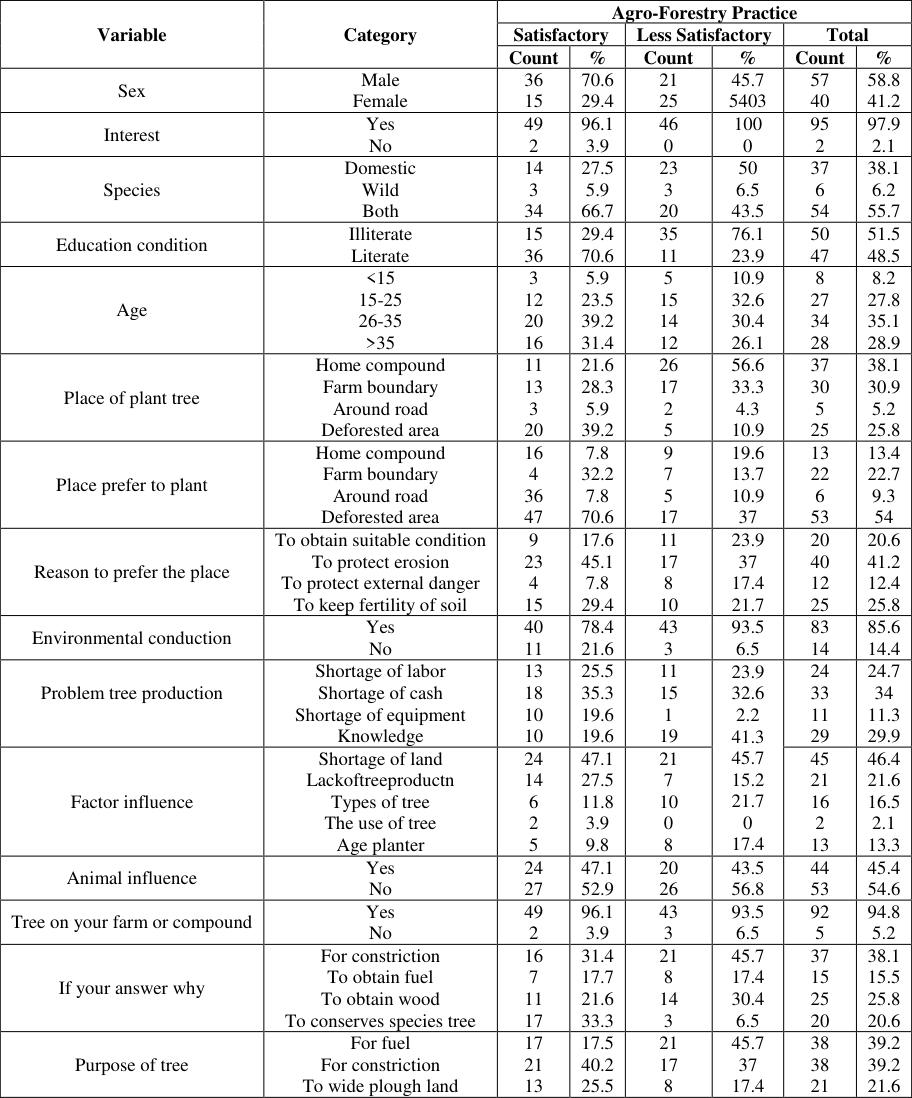 Table 3
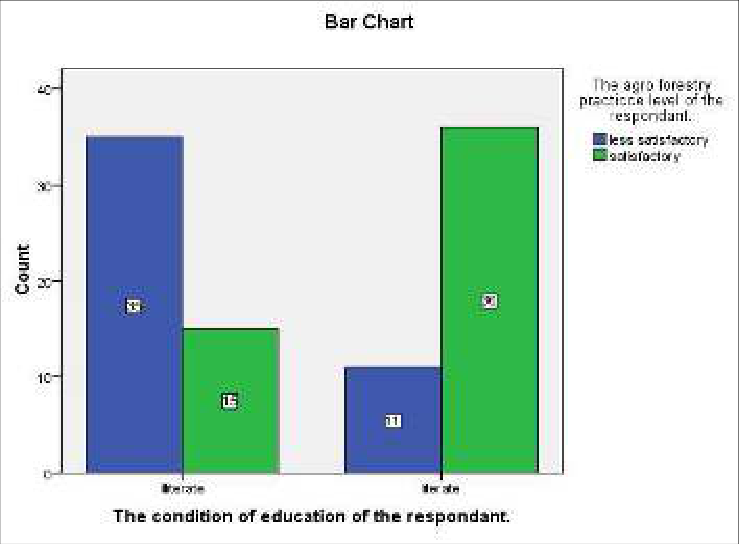 Figure 1
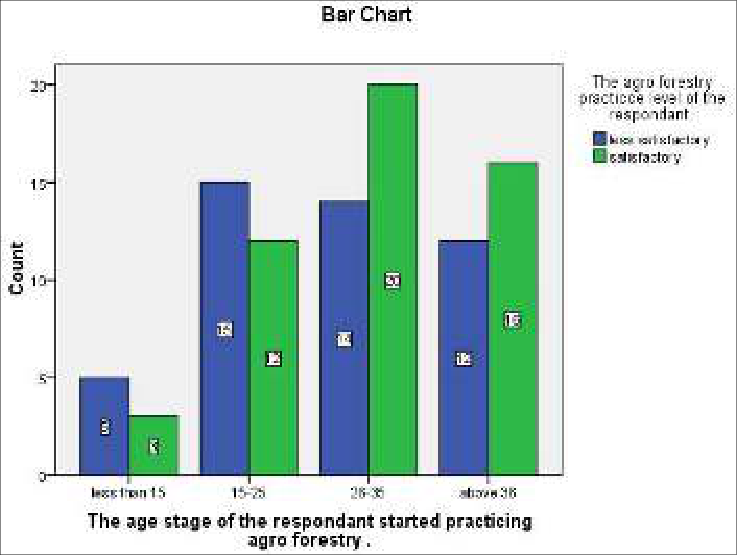 Figure 2
 Table 4
 Table 5
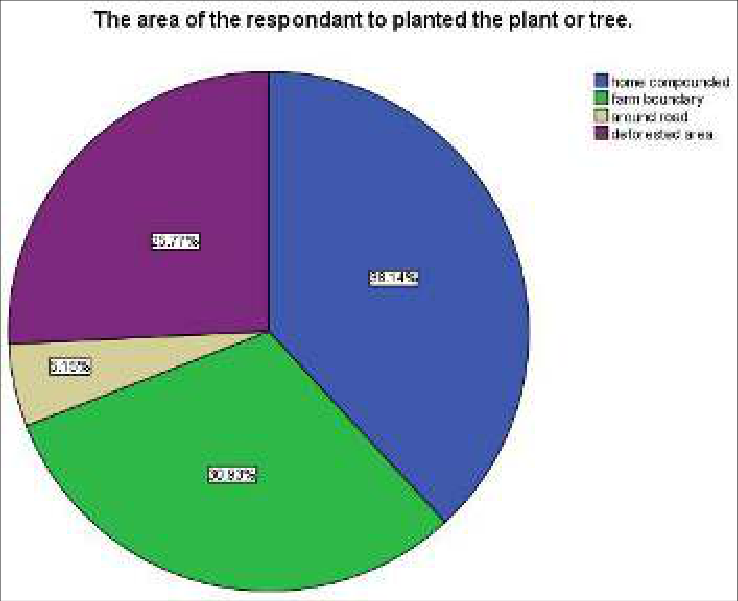 Figure 3
 Table 6
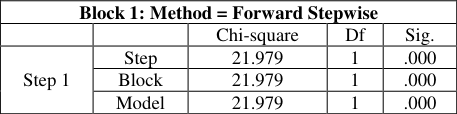 Table 9
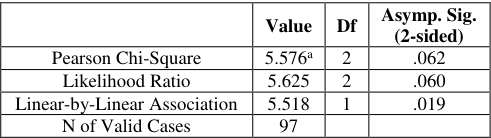 Table 7
 Table 10
 Table 8
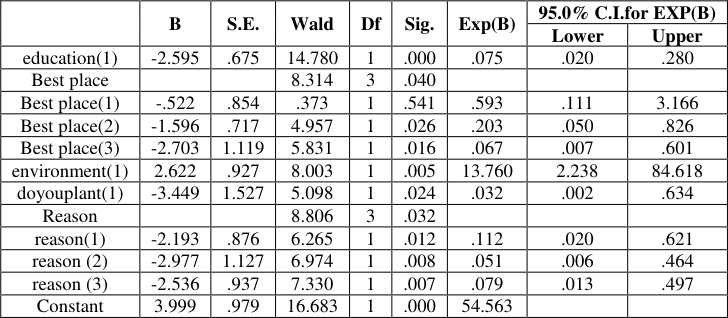 Table 11
Introduction
Agro-forestry is a dynamic, ecologically based, natural resources management system that, through integration of trees on farms and agricultural landscapes, diversifies and sustains production for increased social, economic, and environmental benefits for land users at all levels (World Agro-forestry Center 2003). Also defined as the intimate integration of trees and crop or animals in the farming system or, more widely, as the integrated management and use of forest and agricultural resources. Agro-forestry had a long history, from man's earliest attempts at agriculture to the past time, even in the most industrialized countries. Prior to the 1970 the worldwide forest development project were focused on large monoculture plantation of forest growing trees. (Worldwide Forest development p 1970). During this time agro-forestry becomes more accepted as the systems of land used responding to the needs of the population. In the early time, this agro-forestry practice was not applicable just as today's agro-forestry practice. Today agro forestry research is conducted by universities, government agencies, individual agricultural producers and other organizations. Agro-forestry is practiced by private citizens and public institutions (World Bank's Forestry 1978). In order to develop successful and adoptable agroforestry interventions as part of a rural development strategy, it is essential to base research on the knowledge and attitudes of local farmers. Traditionally, most African farmers have cleared land, used it until fertility began to decline, and then moved on. As the soil became exhausted and the farmers moved on, a variety of trees and shrubs would quickly reestablish itself. During the land's fallow period, the roots of this woody vegetation would return leached nutrients to the topsoil from layers of earth deep below the surface. Eventually, the soil's productivity would be restored, and farmers would return to grow crops there once again. This cycle was interrupted when population pressures forced farmers to settle and to use land much more intensively. Fallows were shortened or eliminated, preventing the natural reforestations that had been such an essential part of traditional agriculture. Trees that would formerly have been left in and around gardens were cut to provide firewood or to make way for more crops. Erosion is made worse by the absence of trees that could break the flow of wind and water there might have been less human suffering and less permanent damage to the land if traditional farming systems -including traditional trees and shrubshad still been in place.
Ethiopia is situated in the horn of Africa with a population of above 85 million and annual rate of growth of 3.2 percent is overwhelmingly an agricultural country. Reports on the forest resources of Ethiopia are dominated by the alarming deforestation that goes on unabated and at an accelerating rate. Deforestation takes place in both forests and farm woodlands and it is recognized as the most severe environmental problem in Ethiopia. The National Conservation Strategy of the Federal Republic of Ethiopia identifies deforestation as a major problem, not only in the forest proper, but also as it affects other sectors such as crops, animal husbandry, water resources, and wildlife habitat. (EFAP, 1999). According to Rain tree (1987), agro -forestry is usually viewed as an unconventional way of raising trees by foresters and unconventional cropping method by agronomists. The future holds that both agricultural and forest products are needed by rural people simultaneously, not alternatively. Agricultural forest provides construction materials woods and timber and in forest, there are rare medicinal plants are available in forest. Forest products are honey; charcoal provides employment opportunities for tribal population. In general agro-forestry is unlimited importance for the population and animals that means forest is important for living and non-living things. In the late 19th century about 46% of Ethiopia was covered with forests. Forest resources are an important endowment of the country in contributing production, protection and conservation functions in themselves. The expansion of agriculture in Ethiopia has been taking place at the expense of the natural vegetation, particularly forests, woodlands and other wildlife resources, leading to loss of both flora and fauna, and ultimately, destruction of habitats as a whole. The deforestation activities, expansion of agriculture and unsustainable use of environmental resources especially forests and forest products have been increasing at alarming rate. Such destruction in Ethiopia has resulted in soil erosion, poverty, food insecurity and recurrent draught, extinction and loss of biodiversity, and global warming and climate change. (Ethiopia forestry action program 1994) Tree growing conservation and management on agricultural land and in forested areas have been taking place by rural people since the beginning of settled agriculture, for the purpose of food, shelter, ceremonial or religious purpose. The current literature shows that perception and attitudes toward trees, transaction cost incurred in searching for market information, production costs in establishing and maintaining the technology, benefits of the technology, sources of information and demographic information play a large role in the adoption of agro forestry.
Study Area and Population
Thestudy is conducted in keble Aynalem. Aynalem is located at Mekelle zone; northern part of Ethiopia in Tigray National Regional State, at a distance of 783 km from Addis Ababa. keble Aynalem has 5 ketenas. These are Shift, Degya, Argosh, Hinstatelem, and Limatendusitiry (Administer office of Aynalem). The study population is all people live in keble Aynalem. The total numbers of population live in keble Aynalem is 10,380. Our target population is the total population who live in the two ketenes. These are Argosh and Degya. The total numbers of people in the two ketenes are 4226. We have taken these two ketenes because, the life style of people in thetwo ketene's is like a rural and they practice agro-forestry.
(Administer office of Aynalem).
Methods of Data Collection and Sampling Design
This research has been done using primary data, which is collected by selfe-administered questionnaire filled by sample respondents. The sampling design used is simple random sampling using the target population(frame). Because, a simple random sampling technique provides equal chance for each member in the population. The study design is Cross-sectional study refers to observations of many different individuals (subjects) at a given time (at the same point of time), each observation belonging to a different individual The sample size determination formula adopted for this study is;
Where, Zα/2-desired level of confidence, 95%=1.96 αlevel of significance= 0.05 d-Marginal error, d=10% p-Proportion of sample, who is satisfy by service of agro forestry, p=0.5. q-Proportion of sample, who is not satisfy by service of agro forestry. N=4226-is total populations of the two ketene.
If no/N>0.05 we have to adjust, but if no/N<5% use no=n (Cochran, 1997) However,97/4226=0.02295<0.05 no need of adjustment.
Therefore, 97-is sample size of our study.
The Study Variable
The Study Variable
Method of Data Analysis
The method of data would be analyzed by using descriptive statistics and inferential statistics for data analysis. In this study to observe the data and over view the general feature of data on each variable.
Descriptive Statistics
Descriptive statistics consists of the collection, organization, summarization and presentation of data in meaningful forms by using tables, charts and graphs. It may be computed by the measures of central tendency (Mean, Median, Mode, etc) and measures of variation (range, variance, etc).
Inferential Statistics
Inferential statistics induces the use of data from sample to make inferences about population from which sample are drawn. In other word, it is the set of methods used to generalize sample to population by performing hypothesistesting, determining relationship among estimates of variable and making decision.
Chi-Square Test of Independence
Chi-square test is amethod of analysis for data obtained from categorical variabels. The data was the from of counts. A chi-square distribution is a function of its degree of freedom. This distribution is skewed the right and the random variable can never take a negative value. The objective of chi-square test of independence are to test whether there is arelation ship between two categorical variables or not.
Assumption of chi-square
Each cell and every individual object is independent of each other. Each number qualifies for one and only one cell in the table.
It is required sufficiently large expected frequency for each cell. The data are obtained from random sample. The expected frequency for each category five or more. The variable under the study is categorical.
Test procedures for chi-square Step1. State the hypothesis. Ho: the two attributes are independent or not significantly association between them. H1: the two attributes are dependent or significantly association between them.
Step2. Level of significance, α =0.05.
Where Eij= expected frequency for cell (i,j) Eij= 𝑛𝑖. * 𝑛.𝑗 𝑛 ni.=i th row total n.j= j th columns total n = total sample size Oij= observed frequency in cell (i,j)
The degree of freedom associated with contingency table possessing r-rows and c-columns= (r-1)(c-1) Step4. Finding the critical value (χ 2 (r-1)(c-1),α)
Step5. Decision rule If χ 2 cal >χ 2 (r-1)(c-1)α, then reject Ho, otherwise no enough evidence to reject the null hypothesis.
Step6. Conclusion based on the decision (Alan Agresti, 1990)
Logistic Regression Model
Logistic regression is used to predict a categorical variable from a set of predictor variables. Binary logistic regression response variable is dichotomous variable (i.e. it takes only two values, which usually represent the occurrence and nonoccurrence, or success or failure, or β Satisfy or dissatisfy of some outcome events usually coded as 0 or 1) and the independent variables are continuous, categorical or both. In logistic regression model assume that the explanatory variables affect the response through suitable transformation of the probability of success, Πi (odds of success). The most commonly used method of estimating the p+1 unknown parameters (βo, β1,…βp) of logistic regression model is the method of maximum likelihood (ML). ML methods seek to maximize the log likelihood (log[p(x)] which reflects how likely it is that the observed values of the dependent variables may be predicted from the observed value of the independent variables.
Parameter Estimation for Logistic Regression
The maximum likelihood and non-iterative weighted least squares are the two most computing estimation methods used in fitting logistic regression model (Hosmer, Lemeshow, 1989;Greene, 1991;collect 1991). When the assumption of normality of the predictors does not hold, the non-iterative weighted least squares methods is less efficient (Maddala, 1997). In contrast, the maximum likelihood estimation method is appropriate for estimating logistic model parameters due to this less restrictive nature of the underlying assumptions (Hosmer -Lemeshow, 1989) hence in this study the maximum likelihood estimation technique will be applied to estimate parameter of the model. Consider the logistic model, the model would be known as logit transform function of πi defined as
Logit (Πxi)=βo+β1x1+….+βkxk, i=1,2,3,4,5,….,k
Where, k-number of independent variables in the logistic regression Βiis parameters or coefficients of the regression for the explanatory variables. Xi-are explanatory variables Π (xi) -is the probability of success, 1-Π (xi)-the probability of failure Βoconstant term Since observed values of Y, Yi's ( i = 1,2,3,4………….,n) are independently distributed as binomial with the maximum likelihoods function of Y is given by:
Where β' = (β1, β2, β3---------------------βp)
The objective of starting likelihood function is to get an estimator β = (βo, β1….βp) of β which maximizes the likelihood function expressed in equation (*). Since likelihood equations are non-linear in the parameters, the Newton-Rap son iterative maximum likelihood estimation method can solve the equations. The coefficients can be interpreted as the change in the logodds associated with a one unit change in the corresponding independent variable or the odd increases multiplicatively by 𝑒 𝛽 for every one unit change increase in x. As a result, the model involving categorical variables essentially involves a change in the reference category as we change from one category to another.
Assumption of logistic regression
• The dependent variable must be a dichotomy (two categories) for binary logistic regression model.
• Linear relationship between the logit (natural log of the odds of the dependent variable is occurring or not) and the predictors.
• There should be meaningful coding of variable.
• There is no assumption of homoscedasticity.
• The dependent variable need to be normally distributed.
• Logistic regression does not assume a linear relationship between the dependents and the independents variables, because it applies a non-linear log.
Assessing the Fit of the Model A. The Wald test
The Wald statistic is commonly used to test the significance of individual logistic regression coefficients for each independent variable (that is, to test the null hypothesis in logistic regression that a particular logit (effect) coefficient is zero, i.e, βi=0 against βi≠0 ) at 𝛼 level of significance. The Wald statistic is:
W has χ 2 distribution with one degree of freedom. The significance of the Wald statistic indicates the importance of the predictor variables in the model and high values of the Wald statistic shows that the corresponding predictor variable is significant.
B. The Hosmer-Lemeshow test
The final measure of model fit is the Hosmer and Lemeshow goodness of fit statics, which measures the correspondence between the actual and predict values of the dependent variable. The Hosmer and Lemeshow test is commonly used test for assessing the goodness of fit of model and allows for any numbers of explanatory variables, which may be continuous or categorical. Test of Hypothesis: Ho: The model is good fit H1: Themodel is not good fi
Results
We use descriptive statistics such as frequency distribution, bar charts and pie chart to explain the general characteristics of some attribution in the study Concerning the education condition of the society Agroforestry practice level differs by respondent's education condition. The highest percentages (76.1%) of the less satisfied agro-forestry practice level of the society are observed on illiterate populations. Whereas the lowest percentage (23.9%) of the less satisfied agro -forestry practice level of the society are observed on literate populations and the only 29.4% of the satisfied agro -forestry practice level of the society are observed on illiterate populations Whereas the highest percentage (70.6%) of the satisfied agro -forestry practice level of the society are observed on literate populations. In addition, the satisfaction of the society by their Agro -forestry practice level differs by place/land of the tree planted. The society less satisfied by their Agro -forestry practice had highest (56.6%) for those who are planted the tree at the area of home compound, while, the lowest (10.9%) less satisfied populations by their agro -forestry practice level are planted the tree at around deforested area. The Agro -forestry practice level of the society differs by species of plant. The highest percentage (50%) of the Agro -forestry practice level of the society less satisfied are observed on the domestic plant species Whereas the lowest percentage (6.5%) of the less satisfied agro -forestry practice level of the society are observed on the wild plant species. The highest percentages (66.7%) of the satisfied agro -forestry practice level of the society are observed on the plant species both domestic and wild. As we observe from the above bar-chart, the age group that practice more agro forestry in the societyis 26-35,which are34(33.7%).In this age group 20(59%) of the population are satisfied by their agro forestry practice and 14(40.6%) of the population are less satisfied by the practice.The population age group <15 are8 (8.4%) and they have the least agro forestry practice level. from this 3(37.5%) are satisfied by their agro forestry practice and5(62.5%)of the population are less satisfied by the practice. 3.841 and the corresponding p-value = 0.009 which is less than the level of significance α=0.05. So, we have significance evidence to reject the null hypothesis. From this we conclude that, there is association between the best places the respondents prefer to plant trees in the future with attitude of the society. 3.841 and the corresponding p-value = 0.000 which is less than the level of significance α=0.05. So, we have significance evidence to reject the null hypothesis. From this we conclude that, there is association between the conduction of education of respondent with attitude of the society.
The odd of illiterate 7.5% times to that of literate towards agro forestry practice to changes the attitude of the society given that of the remains independent variables are constant or eliminate. The odds of tree planted around home compounded is 59.3% times effective to that of the tree planted at deforested area to change the attitude of the society given that of the remained independent variable such as education, age, environment and others are constant. The odds of tree planted at farm boundary is 20.3% times effective to that of the tree planted at deforested area to change the attitude of the society given that of the remained independent variable such are constant. The odds of tree planted around road is 6.7% times effective to that of the tree planted at deforested area to change the attitude of the society, given that of the remained independent variable such as education, age, environment and others are constant.
The odd of the respondent give the response yes regarding to environmental effect is 13.76 times to that of the respondent give the response no regarding to environmental effect to change the attitude of the society given that of the remains independent variables are eliminated. The odd of the respondent give the response yes regarding to planting tree around home compound/farm is 3.2% times to that of the respondent give the response no regarding to planting tree around home compound/farm to change the attitude of the society, given that of the remains independent variables are eliminate or constant. The odds of for construction is 11.2% times to, that of to conserve species of tree to change the attitude of the society, given that of the remains independent variables such as environment, education, place/land and other are constant. The odds to obtain fuel is 5.1% times that of to conserve species of tree to change the attitude of the society, given that of the remains independent variables such as environment, education, place/land and other are constant. The odds of for to obtain wood is 7.9% times that of to censor conserve species of tree to change the attitude of the society, given that of the remains independent variables such as environment, education, place/land and other are constant
Conclusion
From the total illiterate population 76.1% of the societies were not applicable to practice agro forestry means that they are less satisfactory, but the only 23.9% literate populations are satisfied by their agro forestry. This indicates that condition of education have great effect on the attitude of the society towards agro forestry practices. As we have seen in the analysis in above result and discussion 56.8% of the societies are planting tree species which are both wild and domestic tree species. This indicates that species of tree have not effect on the attitude of the society towards agro forestry practices. Only 5.2% of the societies were planted at around road and 38.1% of the societies are planted at home compound. 54% of the societies are planning to plant the tree for the future at defrosted area. This indicates that the place or land have effect on the attitude of the society towards agro forestry practices. Because they select the place to plant tree even if they plan to plant tree on deforested area to the future. The variables such as the education condition of the societies, the condition of the environment, the area of the plant are planted, the best place the planter prefer to plant the tree and the reason to plant tree at home compound/farm are the significance variable have effect on the attitude of the societies towards to agro-forestry. , 1995). To learn about the production strategies of local farming households, 1995.
References
References
Figures and tables from the paper
| Dependent variable | Categories |
|---|---|
| Attitude of the society | 0= Less satisfactory |
| 1= Satisfactory |
Table text extracted from the original PDF; superscript letters are shown inline. The original table image is below.
View original table image
| Variable name | Variable description | Category |
|---|---|---|
| Problems | Problems encounter to tree production | 1=Shortage of labor |
| 2=Shortage of cash | ||
| 3=Types of tree | ||
| 4=The use of tree | ||
| 5=Age of planter | ||
| Species | Types of tree species | 1=Domestic |
| 2=Wild | ||
| 3=Both | ||
| Place | Land (the place where tree planted) | 1=Home compound |
| 2=Farm boundary | ||
| 3=Around road | ||
| 4=Deforested area | ||
| Age | Age of the planter | 1= <15 |
| 2= 15-25 | ||
| 3= 26-35 | ||
| 4 = >35 | ||
| environment | Environmental condition | 0=No |
| 1=Yes | ||
| Influence | Wild animals in the locality | 0=No |
| 1=Yes | ||
| Education | Condition of education | 0=Illiterate |
| 1=Literate | ||
| Purpose | The purpose of cut tree | 1=For fuel |
| 2=For constriction | ||
| 3=To wide plough land |
Table text extracted from the original PDF; superscript letters are shown inline. The original table image is below.
View original table image
| — | Value | df | Asymp. Sig. (2-sided) |
|---|---|---|---|
| Pearson Chi-Square | 11.527a | 3 | .009 |
| Likelihood Ratio | 11.769 | 3 | .008 |
| Linear-by-Linear Association | 10.570 | 1 | .001 |
| N of Valid Cases | 97 |
Table text extracted from the original PDF; superscript letters are shown inline. The original table image is below.
View original table image
| — | Value | Df | Asymp. Sig. (2-sided) | Exact Sig. (2-sided) | Exact Sig. (1-sided) |
|---|---|---|---|---|---|
| Pearson Chi-Square | 21.096a | 1 | .000 | ||
| Continuity Correction | 19.269 | 1 | .000 | ||
| Likelihood Ratio | 21.979 | 1 | .000 | ||
| Fisher's Exact Test | .000 | .000 | |||
| Linear-by-Linear Association | 20.879 | 1 | .000 | ||
| N of Valid Casesb | 97 |
Table text extracted from the original PDF; superscript letters are shown inline. The original table image is below.
View original table image
| — | Value | Df | Asymp. Sig. (2-sided) |
|---|---|---|---|
| Pearson Chi-Square | 15.598a | 3 | .001 |
| Likelihood Ratio | 16.375 | 3 | .001 |
| Linear-by-Linear Association | 14.539 | 1 | .000 |
| N of Valid Cases | 97 |
Table text extracted from the original PDF; superscript letters are shown inline. The original table image is below.
View original table image
| Block 1: Method = Forward Stepwise | — | — | — | — |
|---|---|---|---|---|
| Chi-square | Df | Sig. | ||
| Step 1 | Step | 21.979 | 1 | .000 |
| Block | 21.979 | 1 | .000 | |
| Model | 21.979 | 1 | .000 |
Table text extracted from the original PDF; superscript letters are shown inline. The original table image is below.
View original table image
| — | Value | Df | Asymp. Sig. (2-sided) |
|---|---|---|---|
| Pearson Chi-Square | 5.576a | 2 | .062 |
| Likelihood Ratio | 5.625 | 2 | .060 |
| Linear-by-Linear Association | 5.518 | 1 | .019 |
| N of Valid Cases | 97 |
Table text extracted from the original PDF; superscript letters are shown inline. The original table image is below.
View original table image
| — | B | S.E. | Wald | Df | Sig. | Exp(B) | 95.0% C.I.for EXP(B) | — |
|---|---|---|---|---|---|---|---|---|
| Lower | Upper | |||||||
| education(1) | -2.595 | .675 | 14.780 | 1 | .000 | .075 | .020 | .280 |
| Best place | 8.314 | 3 | .040 | |||||
| Best place(1) | -.522 | .854 | .373 | 1 | .541 | .593 | .111 | 3.166 |
| Best place(2) | -1.596 | .717 | 4.957 | 1 | .026 | .203 | .050 | .826 |
| Best place(3) | -2.703 | 1.119 | 5.831 | 1 | .016 | .067 | .007 | .601 |
| environment(1) | 2.622 | .927 | 8.003 | 1 | .005 | 13.760 | 2.238 | 84.618 |
| doyouplant(1) | -3.449 | 1.527 | 5.098 | 1 | .024 | .032 | .002 | .634 |
| Reason | 8.806 | 3 | .032 | |||||
| reason(1) | -2.193 | .876 | 6.265 | 1 | .012 | .112 | .020 | .621 |
| reason (2) | -2.977 | 1.127 | 6.974 | 1 | .008 | .051 | .006 | .464 |
| reason (3) | -2.536 | .937 | 7.330 | 1 | .007 | .079 | .013 | .497 |
| Constant | 3.999 | .979 | 16.683 | 1 | .000 | 54.563 |
Table text extracted from the original PDF; superscript letters are shown inline. The original table image is below.