
Research article · 2019 · Full text
International Journal of Agriculture and NutritionComparative analysis of soil deterioration under different land uses in southwestern Nigeria
Volume 1(1) · Pages 11–18 · DOI: 10.33545/26646064.2019.v1.i1a.3 ↗
Research areasSoil and Land Suitability AnalysisSoil erosion and sediment transport
Abstract
Author-writtenSoil degradation associated with land use is a critical problem in Southwestern Nigeria and there is little or insufficient scientific information in assessing soil quality indicator. In this study 9 soil physical and chemical properties were measured from 5 different sampling sites covering three land use categories (arable farms, tree farms and natural forest). The quality of the soils was determined by comparing the physio-chemical parameters of soil samples from the farms with the Standard maximum allowable thresholds for agricultural lands. Two hundred (200) copies of questionnaire were administered purposively to elicit information on socio-economic status focusing on farm history and farm attributes. Analysis of Variance was used to identify the most sensitive indicators of soil quality for evaluating land use within the forest belt in Southwestern Nigeria and subsequently compare soil quality assessment using fieldwork and laboratory soil analysis method. The results indicated that soils in the study area were characterized with mean bulk density, cation exchangeable capacity that varied at F = 0.68, P
Summary
Source-checkedPlain-language reading of the full paper, prepared with AI and checked against the text. Each point links to the authors' own words.
Why it matters
- Soil degradation linked to land use is a critical issue in Southwestern Nigeria, yet there is a lack of sufficient scientific data on soil quality indicators. View evidence ↗
- The properties of soil are significantly impacted by the specific land use and management practices employed. View evidence ↗
- Agriculture in Southwestern Nigeria typically uses a shifting cultivation system, but increasing land pressure is shortening the necessary fallow periods. View evidence ↗
The question
- The study aims to understand the current nature of soil degradation under various agricultural land uses in the Irewole Local Government Area of Osun State, Nigeria. View evidence ↗
What they did
- Researchers measured nine physical and chemical soil properties across five sampling sites, comparing arable farms, tree farms, and natural forests. View evidence ↗
- A total of 220 soil samples were collected from 110 sampling points. View evidence ↗
- Soil samples were taken at two different depths: 0-15 cm and 15-30 cm. View evidence ↗
- Socio-economic data on farm history and attributes were gathered via 200 purposively administered questionnaires. View evidence ↗
What they found
- Mean bulk density and cation exchangeable capacity differed significantly (F = 0.68, P < 0.05) in arable and tree crop soils compared to natural forest plots. View evidence ↗
- Arable and tree crop soils showed higher levels of clay, organic matter, cation exchangeable capacity, and exchangeable acidity than natural forest soils. View evidence ↗
- In arable soils, available phosphorus and clay concentrations differed significantly (FC = 0.76, P < 0.05) between topsoil and subsoil. View evidence ↗
- Soil deterioration was found to be more severe in the topsoil than in the subsoil. View evidence ↗
- Among tree crops, soils under citrus production exhibited lower fertility compared to those under cocoa and kola. View evidence ↗
- Forty percent of arable crop farmers had farms smaller than 3 hectares, whereas 62 percent of tree crop farmers had holdings larger than 3 hectares. View evidence ↗
What it means
- The authors conclude that farming activities cause soil deterioration in the region and recommend the adoption of sustainable agricultural practices to ensure food security. View evidence ↗
- The authors recommend encouraging the application of plant residues to maintain positive soil physical conditions. View evidence ↗
Visual summary
3 visualsIllustrations explain the paper; charts are replotted from the paper's own table values.
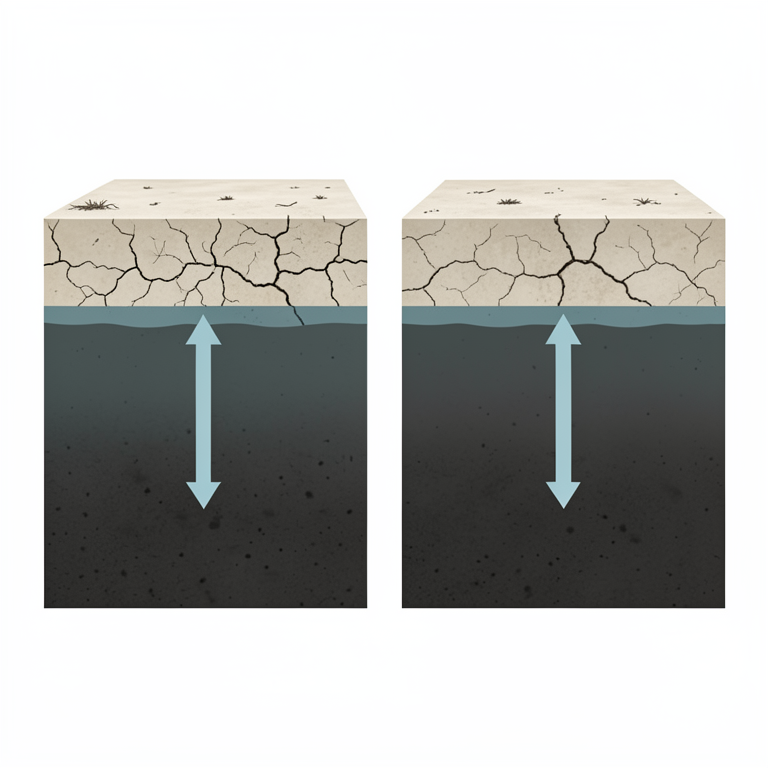
Soil Depth Deterioration
AI-generated conceptual illustration (soil profiles in southwestern Nigeria). It explains the idea and does not show study data.
View source evidence ↗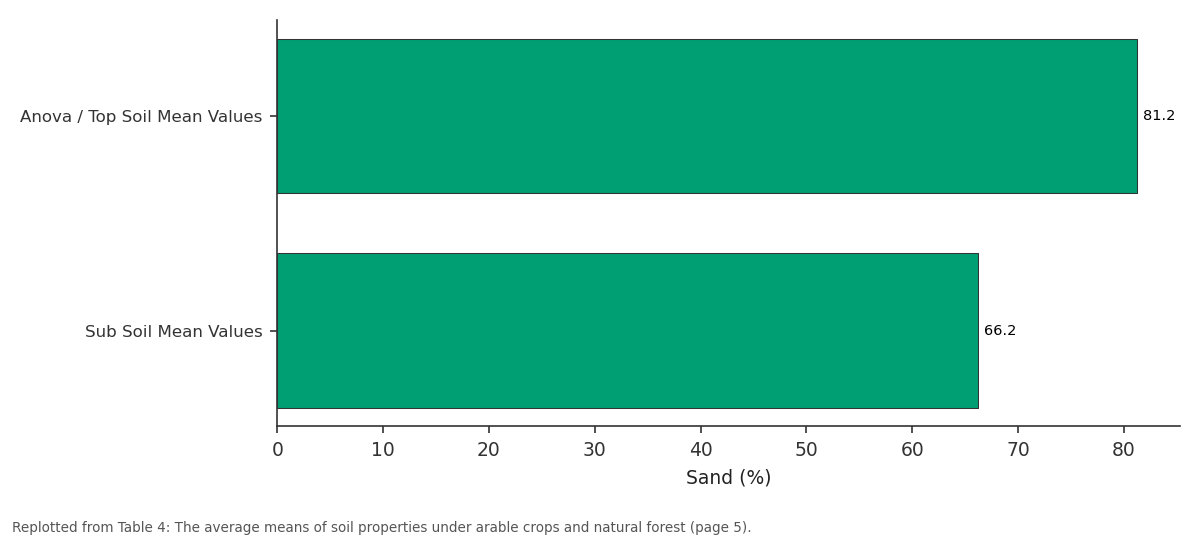
Sand (%): Anova / Top Soil Mean... vs Sub Soil Mean Values
Replotted from Table 4 (page 5) of the original paper. Every bar is the paper's own table value.
View source evidence ↗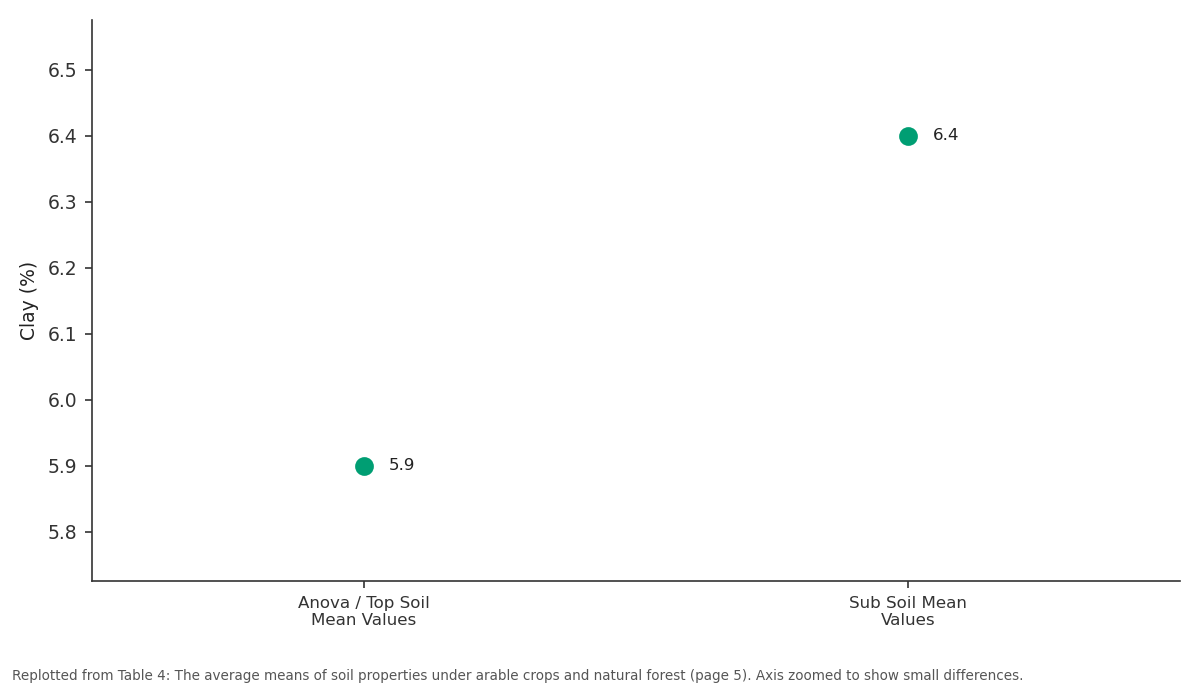
Clay (%): Anova / Top Soil Mean... vs Sub Soil Mean Values
Replotted from Table 4 (page 5) of the original paper. Every bar is the paper's own table value.
View source evidence ↗Figures & tables
From the original paper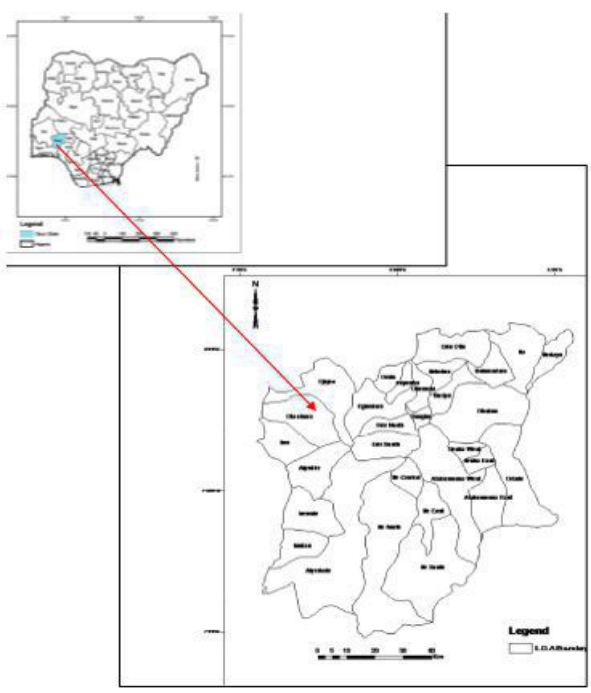 Figure 1
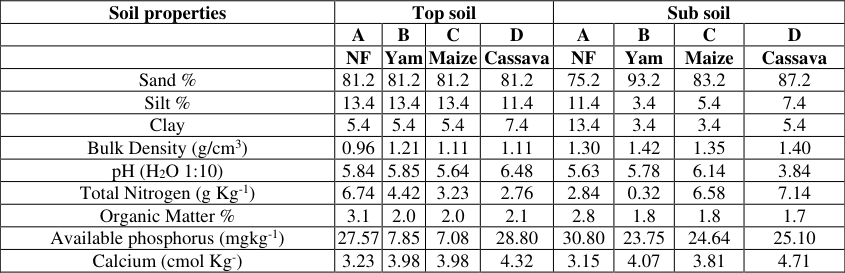 Table 1
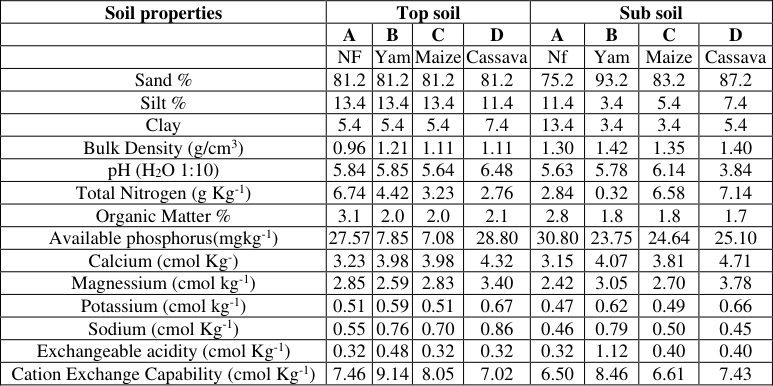 Table 2
 Table 3
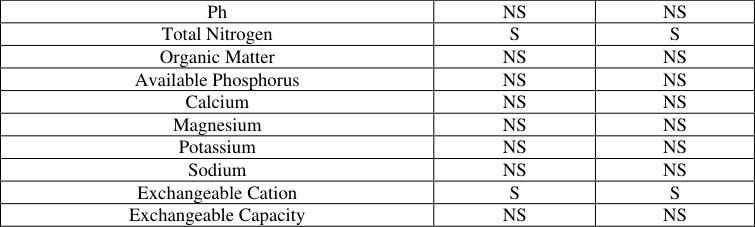 Table 4
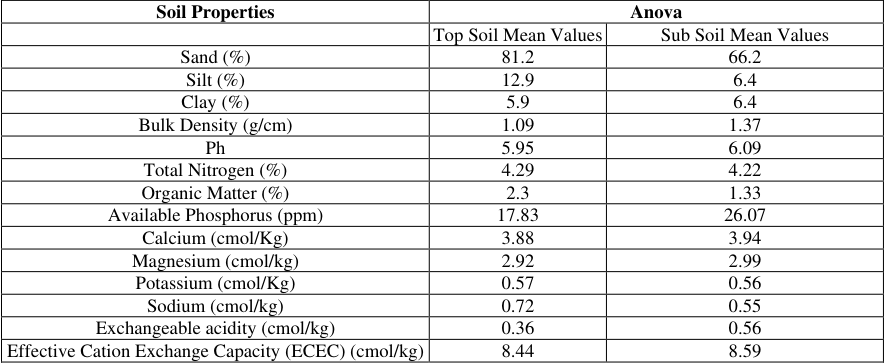 Table 4
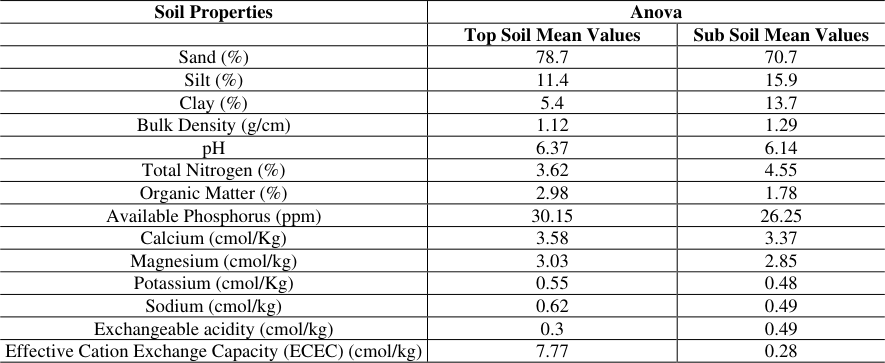 Table 5
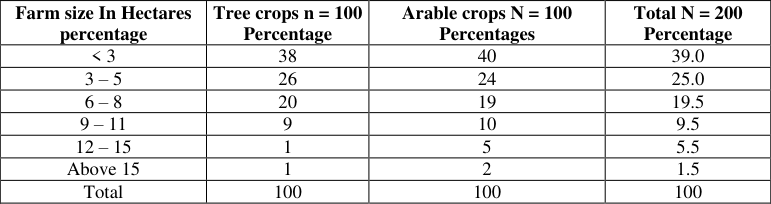 Table 6
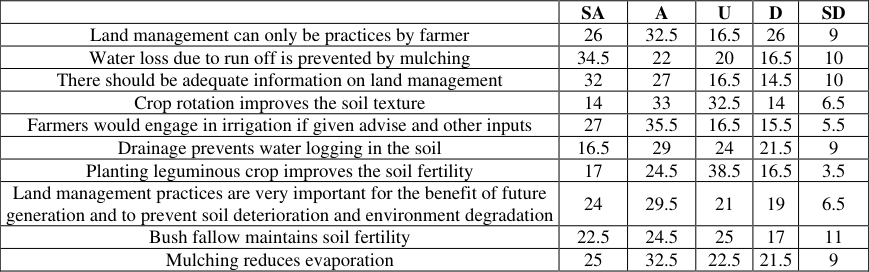 Table 7
Introduction
An optimum soil condition is fundamental to successful and profitable agricultural venture while most kinds of soil can be put to industrial and urban uses, agricultural uses are very discriminating of the soil type. Thus, the prime soil of any nation or country should be reserved for agricultural uses, because different land use and management practices greatly impact soil properties (Spurgeon, Keith, Schmidt, Lammertsma, and Faber, 2013) [46] , and knowledge of the variation in soil properties within farmland use is essential in determining production constraints related to soil nutrients. However, when there is no information on the quality of the soils occupying a piece of land and /or regulations guiding the use of land for various purposes, the best agricultural land of any nation will continue to be lost to industrial, urban and other non-agricultural uses. According to the United Nations Convention to Combat Desertification (UNCCD), 24 billion tons of fertile soils are lost due to erosion every year, while 12 million hectares of land are degraded through drought and the encroachment of the desert (this is 23 hectares per minute) where 20 million tons of grain could have been grown (Tellen and Yerima 2018) [49] . Land use can be viewed as the outcome of a decision process. This process weighs all possible potential land uses and selects the uses that maximize utility to the land owner. Land quality determines the degree to which a certain tract of land can be put to certain use while land capability refers to the fitness of the land to perform a definite use (Jeje and Nabegu, 1982, Adeoye and Agboola, 1985) [3] . Soil properties vary in different spatial areas due to the combined effect of biological, physical, and chemical processes over time (Santra, Chopra and Chakraborty, 2008), and can vary within farmland or at the landscape scale (Corwin et al., 2003; Mouazen, Dumont, Maertens and Ramon, 2003) [11,35] . Agricultural land use in Southwestern Nigeria is mostly characterized by shifting cultivation system, even though pressure on available land by both agricultural and nonagricultural sectors considerably reduces the fallow period. In view of the ever-increasing demand on limited land resources, the question most often asked is whether soil productivity in tropical rainforest ecosystem can be sustained with intensive and continuous farming. As the dynamics of Land Use/Land Cover change associated with the anthropogenic activities are occurring rapidly in tropical landscapes (Tellen and Yerima 2018) [49] . The available research data indicate that most tropical soils can be intensively cultivated and produced high and sustained yields by adopting ecological approach to agriculture (Leemans and Vandam Born, 1994) [29] . In this connection, land clearing techniques play an important role. The effects of improper land clearing methods are observed even 8-10 years after the land has been cleared and especially when the overall soil fertility has drastically declined. The Food and Agriculture Organization (FAO 2000) [19] rated Nigeria's soil from low to medium in productivity and concluded that most of the country's soil would have medium to good productivity if these resources were managed properly. Efficient management of soil resources is crucial to intensifying agricultural and improving production in Nigeria. Ekanade 1988 [14] , observed soil fertility declines under tree crops with time while, Schroth and Sinclair, 2003 [44] affirmed Trees can improve the nutrient balance of soil by reducing unproductive nutrient losses from erosion and leaching and by increasing nutrient inputs through nitrogen fixation and increase biological activities by providing biomass and suitable microclimate. It is also important to suggest different remedial measures for optimum production and appropriate land use management practices (Panday, Maharjan, Chalise, Shrestha, and Twanabasu, 2018) [42] . Sustainable land management practices are necessary to meet the changing human needs and to ensure long-term productivity of farmland (Hălbac-Cotoară-Zamfir, Keesstra, and Kalantari, 2019) [23] . Human activities such as the shifting cultivation system practiced by traditional farmers in some parts of the tropics indicate that the peasant farmer knows fully well that the soil cannot support crop production for a long time unless it is allowed to rest. Since population pressure now forces farmers to cultivate land more intensively, therefore it is important to know the nature of soil degradation under different agricultural land uses in order to take appropriate ameliorative measures. This become necessary as poor land management practices have significantly affected soil quality and crop production, with the average annual crop production rate decreasing by 3.5% in 2014-2016 in Nepal for example (MOAD, 2017) [34] . Several studies have assessed this problem in the traditional farming settings. As these traditional systems become unstable, it is pertinent to understand the contemporary nature of degradation in soils under different agricultural land uses using Irewole Local Government Area of Osun State, Nigeria as a case study.
Materials and Methods
Materials and Methods
Study Area
The study area is Irewole Local Government Area of Osun State, Nigeria. It lies within latitude 7 ̊ 15 and 7̊ 30 N and between longitudes 4̊ 07 E and 4 ̊ 27 E with approximate land size of about 271 km 2 (Figure 1). It falls within the Tropical Rainforest vegetations zone with abundant tall ever green trees and climbers all the year round. The natural vegetation in this area is lowland Tropical Rainforest The climate of the study area is humid sub-equatorial type that is characterized by distinct dry and rainy season (Aweto, 1995) [5] , with a mean annual rainfall of 1300 mm while the mean annual temperature is about 27 0 C. The area was estimated to have about one hundred and forty three thousand five hundred and ninety nine (143,599) as according to 2006 census exercise (National Population Census, 2006).
Data Collection and Analysis
The basic data for this study were soil characteristics under varying land use type: arable land use (yam, maize and cassava), tree crops land use (cocoa, kola and citrus) and forest land use. Data on socio-economic characteristics was also collected focusing on farming problems, farming practices, farm investment and farmers' perception on farm productivity.
Stratified random sampling techniques was employed in selecting two hundred (200) farmers, (this was correlated with the farm size where soil samples were collected (Table 5). The study area was gridded with a regular grid of 1 x 1 km. From which 5 grids were selected. In each of the five study sites, 20 sampling points each were selected from under tree crops, arable crops and natural forest. Ten sampling points were selected from parcel of land under yam and citrus because these two crops were so frequently encountered in this area compared to others. From each of the sampling points, soils were taken at two depts., that is, 0-15cm and 15-30cm with the aids of bucket soil auger, which was package under standard control for physio-chemical laboratory analysis at Faculty of Agriculture, O. A. U. Ile-Ife, Nigeria. This sampling scheme indicated that there were 100 sampling points from which 200 soil samples were collected from under cocoa, kola, citrus, maize and cassava (i.e. 100 top and 100 sub-soil samples). Then 10 soil samples were taken at random from under natural forest; making 20 samples i.e. 10 top and 10 sub-soils. In essence, there were 110 sampling points from which 220 soil samples were collected. Bulk density was determined by the core method (Blake, 1965) [10] using core sample of known volume and oven-dried the soil at 105 0 C for 72 hours until constant weight was attained. Particle size distribution was determined by the hydrometer method (Bouyoucos, 1962) [9] using 5% of Sodium Hexametaphosphate (Calgon) as the dispersing agent. Soil pH was determined in both distilled water and 1.0M KCl (1:1 soil solution ratio) using glass electrode pH meter (Kent model 720) after equilibration for 30 minutes. Exchangeable acidity and exchangeable aluminum were determined as described by Maclean (1965). The organic matter content of the soil was determined by the chromic acid digestion method as described by Allison (1965) [4] . Available phosphorus was determined by the Bray-1 method (Olsen and Dean, 1954) [41] . One gram of soil was shaken for 6 minutes in a mixture of 0.30N NH 4 F and 0.025N HCl after which suspension was filtered.
| Soil Properties | Anova | — |
|---|---|---|
| Top Soil Mean Values | Sub Soil Mean Values | |
| Sand (%) | 78.7 | 70.7 |
| Silt (%) | 11.4 | 15.9 |
| Clay (%) | 5.4 | 13.7 |
| Bulk Density (g/cm) | 1.12 | 1.29 |
| pH | 6.37 | 6.14 |
| Total Nitrogen (%) | 3.62 | 4.55 |
| Organic Matter (%) | 2.98 | 1.78 |
| Available Phosphorus (ppm) | 30.15 | 26.25 |
| Calcium (cmol/Kg) | 3.58 | 3.37 |
| Magnesium (cmol/kg) | 3.03 | 2.85 |
| Potassium (cmol/Kg) | 0.55 | 0.48 |
| Sodium (cmol/kg) | 0.62 | 0.49 |
| Exchangeable acidity (cmol/kg) | 0.3 | 0.49 |
| Effective Cation Exchange Capacity (ECEC) (cmol/kg) | 7.77 | 0.28 |
Table text extracted from the original PDF; superscript letters are shown inline. The original table image is below.
View original table image
Results and Discussion
Results and Discussion
Properties of Soils under Arable Crops
Table 1 shows the various soil properties under arable crops in both of topsoil and subsoil in the study area. It is evident from the analysis that the soil was loamy, silt and clay with average percentages of 81%, 13% and 5% respectively. The dominating sandy-loam texture in the area is typical of the surface horizon of soils derived from crystalline basement complex rocks which could have been responsible factor for the high sand stone/soils composition found in the area (Adegoke 1969; Jones and Wild 1975 and Mudroch et al., 1976) [2,26,37] . The result also indicated that the top-soils under arable crops were moderately acidic with pH value of 5.1 -6.0 while top-soils under cassava and sub-soil under cassava and maize were slightly acidic with pH value of 6.1-6.9. Also organic matter and available phosphorus had lower mean value when compared with the natural forest. This may be due to the intensification of agricultural activities through clearing and cleans cultivation for annual cropping and nutrients absorption by crops without replacement (Greenland, 1995) [21] . The observed pattern in the sub-soil seems to imply that there is little deterioration in the soil chemical properties since the mean value under yam, maize and cassava have little differences when compared with that of natural forest (Table 1). Also, it was discovered that soil deterioration observed was greater in the top soil than that of sub-soil, as this was the level where uptake of nutrients take place and environmental activities such as leaching and erosion, also important was the low clay content of the soil which reduce the nutrients holding capacity of the soil at the topsoil level. Because most savannah soils and by extension tropical soils are sandy in nature, possessing low water holding capacity due to low clay content (Jones and Wild 1975) [26] . There is also lower clay content in the soil under sole cropping than soil under mixed cropping due to erosion as reported in a study carried out under grain in Kano for instance (Adamu and Andmaharazz 2014) [8] . This decline in organic carbon is expected in the tropical environment because addition of organic residues which determine the organic matter content in the soil is low and their loss through mineralization processes are on the high side (Binns et al., 2003) [8] . Another reason attributable for the loss of organic carbon is the intensification of agricultural activities in the area through clearing and cleans cultivation of soil for annual cropping (Greenland, 1995) [21] . From the foregoing the mean value of the organic content for the area is low, when compared with the accepted threshold of 34 g kg -1 for soil organic matter below which decline in soil quality is expected to occur (Loveland and Webb, 2003) [30] . NF means Natural Forest.
| Soil properties | Top soil | — | — | — | Sub soil | — | — | — |
|---|---|---|---|---|---|---|---|---|
| A | B | C | D | A | B | C | D | |
| NF | Yam | Maize | Cassava | NF | Yam | Maize | Cassava | |
| Sand % | 81.2 | 81.2 | 81.2 | 81.2 | 75.2 | 93.2 | 83.2 | 87.2 |
| Silt % | 13.4 | 13.4 | 13.4 | 11.4 | 11.4 | 3.4 | 5.4 | 7.4 |
| Clay | 5.4 | 5.4 | 5.4 | 7.4 | 13.4 | 3.4 | 3.4 | 5.4 |
| Bulk Density (g/cm3) | 0.96 | 1.21 | 1.11 | 1.11 | 1.30 | 1.42 | 1.35 | 1.40 |
| pH (H2O 1:10) | 5.84 | 5.85 | 5.64 | 6.48 | 5.63 | 5.78 | 6.14 | 3.84 |
| Total Nitrogen (g Kg-1) | 6.74 | 4.42 | 3.23 | 2.76 | 2.84 | 0.32 | 6.58 | 7.14 |
| Organic Matter % | 3.1 | 2.0 | 2.0 | 2.1 | 2.8 | 1.8 | 1.8 | 1.7 |
| Available phosphorus (mgkg-1) | 27.57 | 7.85 | 7.08 | 28.80 | 30.80 | 23.75 | 24.64 | 25.10 |
| Calcium (cmol Kg-) | 3.23 | 3.98 | 3.98 | 4.32 | 3.15 | 4.07 | 3.81 | 4.71 |
Table text extracted from the original PDF; superscript letters are shown inline. The original table image is below.
View original table image
The analysis of variance (ANOVA) test showed that only the main values of total Nitrogen and exchangeable acidity were significantly different (P0.05) in the sub-soil (Table 3). The outcome of this analysis could therefore be interpreted to mean that all crops have had impact on the soil total Nitrogen and exchangeable acidity.
| Soil Properties | ANOVA | — |
|---|---|---|
| Top Soil | Sub Soil | |
| Sand | NS | NS |
| Silt | NS | NS |
| Clay | NS | NS |
| Bulk Density | NS | NS |
Table text extracted from the original PDF; superscript letters are shown inline. The original table image is below.
View original table image
Properties of Soils under Tree Crops
Top Soils under natural forest and tree crops production were loamy sand, but those under citrus production were sandy loam.
The texture of the top-soils from tree crops was similar and was sandy loam. The soil under the tree crops are slightly acidic with pH value of 6.1 -6.9 while that of natural forest remained moderately acidic which means that these crops made soil to become more acidic. [33] . It was observed that organic matter, Nitrogen, available phosphorus, Calcium, Magnesium, Potassium and Sodium have similar pattern in the top soils and the mean values under the tree crops had little differences when compared with the natural forest. Trees can improve the nutrient balance of soil by reducing unproductive nutrient losses from erosion and leaching and by increasing nutrient inputs through nitrogen fixation and increase biological activities by providing biomass and suitable microclimate (Schroth and Sinclair, 2003) [44] . It was also evident that soil chemical properties were almost the same in soils under tree crops because the chemical properties had their greater values but soil samples under citrus had the least mean values. The observed pattern in the tree crops indicated that soil under citrus had the lower fertility than soil under Cocoa and Kola. It was therefore, clear that there is variation in soil deterioration under Cocoa, Kola and Citrus. This may be so as trees are known to ensured preferential nutrients enrichment of soils in term of Ca, Mg, Na, P and N (Sunita and Uma 1993) [48] . Also the improved soil fertility under cocoa/kola could probably be attributed to the high level of organic matter content maintained under the trees through the accumulation of litters (Ogunkunle and Awotoye, 2011) [7] . Bernhard-Reversat and Loumeto (2002) [6] affirmed that the most relevant parameter for soil organic matter binding-up could be the amount of standing litter on the soil which integrates litter fall and decomposition and also essential in the soil aggregate stability (Mbah et al, 2007; Emadi et al., 2008) [32,17] . Table 3 and 4 indicate that certain soil properties vary significantly under tree crops in both top-soil and sub-soil as revealed by (ANOVA) technique. (The level of significance was 5%)
Socio-Economic Analysis
It is evidenced that 89.9% of the farmers fell between the ages of 35-49 years while mean age was 42 years. The dominance of people within the active age in farming was an indication that farming activities may be high in this area. This is the age range at which people tend to have a lot of energy for labor-intensive ventures. The analysis of the sex of the farmers shows that 78.7% are Male. This means that farming in the area is Male dominated and is consistent with what is known about Southwestern Nigeria. The findings also indicated that the majority of the respondents (67.5 percent) were married while very small proportions were unmarried. This may also suggest greater use of the agricultural land to meet large demand. When more is required from the land as outputs, farmers will be concerned to get the most from the land using various methods of land use management known to them. A high proportion of the farmers (79.7 percent) had completed one form of formal schooling, while a little over onefifth (20.3 percent) of the respondents had no formal education. On general consideration, however, the level of education of the respondents could be described as moderately high 79.7 percent while only 20.3 percent never attended any form of formal education. This outcome has a lot of benefits. It means for example that a great proportion of the farmers were likely to respond positively to adoption of practices that can boost agricultural products. Table 6 showed that almost half of the respondents had between 3-9 hectares of land. Only 1.5 percent of the farmers had a total farmland size of about 15 hectares. The findings revealed that all the farmers with less than 3 hectares of farmland have their farms in one place. Such farmers are less likely to be involved in planting tree crops. They cannot also practice bush fallow because all their land is needed all the time for food crop production. More respondents that engaged in arable crops farming 40 percent had farm sizes less than 3 hectares, while 62 percent of farmers that engaged in tree crops holdings had farm sizes greater than 3 hectares. The findings also revealed that more farmers that engaged in tree crops cultivated 3-8 hectares (46 percent) than farmers in those that engage in Arable crops (43 percent). This also has implications on the ability of farmers to effectively manage the land to meet the demand for food crop production. The suggestions were measured by employing attitudinal scale of the form summated rating/likert scale (Gomez and Jones III 2010, Kumar 2011) [20,28] with response categories ranging from strongly agree to strongly disagree. The farmers indicated which of the statement best describes their opinion with respect to land management practices. Ten statements were presented to farmers their reactions were presented in table 6 showing suggestions score. From the table 29.5 agreed that land management practices are very important for the benefit of future generation and to prevent soil deterioration and environment degradation, 24 strongly agreed with the same notion while 21 were undecided/indifferent to the notion of preventing soil deterioration through land management. Still from the table 32.5 agreed that land management can only be practices by farmer, 26 farmers strongly agreed while 16.5 were indifferent to the course of farmer being solely responsible for land management. Also 32 strongly agreed that there should be adequate information on land management, 27 agreed while 16.5 were undecided whether there is need for the availability of information on land management. From the foregoing it is clear that the place of management in soil management cannot be over emphasized and that it is everybody concerns as expressed by the farmers interviewed. Even the authors cannot agreed less with the farmers as land/soil status/health is measured using its rate of productivity and can be classified into five different classes; very high productivity, high productivity, medium productivity, low productivity, and very low productivity. According to this rating the Nigeria soils are found to be of medium to high potentials (Nigeria Country Profile 1997), thus necessitated urgent and sustained need for soil management to prevent unimaginable soil deterioration. As Nigeria is included among the countries with high declining soil fertility (FAO 2001) [19] , and was estimated to be losing an average of 24 kg nutrients/ha per year (10 kg N; 4 kg P2O5, 10 kg K2O) in 1990 and 48 kg nutrients/ha per year in 2000, that is, a loss equivalent to 100 kg fertilizers/ha per year.
Conclusion
This study has revealed that when natural forest is opened to any kind of cultivation, the soil properties deteriorate. The results of comparing the means value of soil properties under agricultural land use with those under natural forest revealed this. The statistical method of Analysis of Variance (ANOVA) used revealed that all the arable crops have had similar impact on the soils and so were all the tree crops on the soils. It was noted that certain soil properties vary significantly under tree crops in both top and sub-soil. These include top soil cation exchangeable capacity. Sub-soil total nitrogen, sub-soil silt, top soil and subsoil clay and organic matter. It was also observed that soil chemical properties were almost the same in soils under Cocoa and Kola because the chemical properties had their greater values but soil samples under citrus had the least mean values with regard to chemical properties of the soil. To prevent further deterioration and degradation of land, farmer's use of sustainable land management practices has become an important factor which will ensure increase agricultural productivity, protect the land and recycle the soil nutrients. It is hereby recommended that application of plant residues which is known to have multi-benefit effects in maintaining the good soil physical condition should be encouraged. There is the need to establish land management information center for proper dissemination of information on land management practices to farmers in order to help them in the aspect of soil management. It is also recommended that existing agro-services centers should be equipped to handle analysis of soil samples for farmers. Also Economic and social assistance should be provided to farmers to purchase farm inputs and this will enhance high use of land management practices.
Figures and tables from the paper
| Soil properties | Top soil | — | — | — | Sub soil | — | — | — |
|---|---|---|---|---|---|---|---|---|
| A | B | C | D | A | B | C | D | |
| NF | Yam | Maize | Cassava | Nf | Yam | Maize | Cassava | |
| Sand % | 81.2 | 81.2 | 81.2 | 81.2 | 75.2 | 93.2 | 83.2 | 87.2 |
| Silt % | 13.4 | 13.4 | 13.4 | 11.4 | 11.4 | 3.4 | 5.4 | 7.4 |
| Clay | 5.4 | 5.4 | 5.4 | 7.4 | 13.4 | 3.4 | 3.4 | 5.4 |
| Bulk Density (g/cm3) | 0.96 | 1.21 | 1.11 | 1.11 | 1.30 | 1.42 | 1.35 | 1.40 |
| pH (H2O 1:10) | 5.84 | 5.85 | 5.64 | 6.48 | 5.63 | 5.78 | 6.14 | 3.84 |
| Total Nitrogen (g Kg-1) | 6.74 | 4.42 | 3.23 | 2.76 | 2.84 | 0.32 | 6.58 | 7.14 |
| Organic Matter % | 3.1 | 2.0 | 2.0 | 2.1 | 2.8 | 1.8 | 1.8 | 1.7 |
| Available phosphorus(mgkg-1) | 27.57 | 7.85 | 7.08 | 28.80 | 30.80 | 23.75 | 24.64 | 25.10 |
| Calcium (cmol Kg-) | 3.23 | 3.98 | 3.98 | 4.32 | 3.15 | 4.07 | 3.81 | 4.71 |
| Magnessium (cmol kg-1) | 2.85 | 2.59 | 2.83 | 3.40 | 2.42 | 3.05 | 2.70 | 3.78 |
| Potassium (cmol kg-1) | 0.51 | 0.59 | 0.51 | 0.67 | 0.47 | 0.62 | 0.49 | 0.66 |
| Sodium (cmol Kg-1) | 0.55 | 0.76 | 0.70 | 0.86 | 0.46 | 0.79 | 0.50 | 0.45 |
| Exchangeable acidity (cmol Kg-1) | 0.32 | 0.48 | 0.32 | 0.32 | 0.32 | 1.12 | 0.40 | 0.40 |
| Cation Exchange Capability (cmol Kg-1) | 7.46 | 9.14 | 8.05 | 7.02 | 6.50 | 8.46 | 6.61 | 7.43 |
Table text extracted from the original PDF; superscript letters are shown inline. The original table image is below.
View original table image
| Ph | NS | NS |
|---|---|---|
| Total Nitrogen | S | S |
| Organic Matter | NS | NS |
| Available Phosphorus | NS | NS |
| Calcium | NS | NS |
| Magnesium | NS | NS |
| Potassium | NS | NS |
| Sodium | NS | NS |
| Exchangeable Cation | S | S |
| Exchangeable Capacity | NS | NS |
Table text extracted from the original PDF; superscript letters are shown inline. The original table image is below.
View original table image
| Soil Properties | Anova | — |
|---|---|---|
| Top Soil Mean Values | Sub Soil Mean Values | |
| Sand (%) | 81.2 | 66.2 |
| Silt (%) | 12.9 | 6.4 |
| Clay (%) | 5.9 | 6.4 |
| Bulk Density (g/cm) | 1.09 | 1.37 |
| Ph | 5.95 | 6.09 |
| Total Nitrogen (%) | 4.29 | 4.22 |
| Organic Matter (%) | 2.3 | 1.33 |
| Available Phosphorus (ppm) | 17.83 | 26.07 |
| Calcium (cmol/Kg) | 3.88 | 3.94 |
| Magnesium (cmol/kg) | 2.92 | 2.99 |
| Potassium (cmol/Kg) | 0.57 | 0.56 |
| Sodium (cmol/kg) | 0.72 | 0.55 |
| Exchangeable acidity (cmol/kg) | 0.36 | 0.56 |
| Effective Cation Exchange Capacity (ECEC) (cmol/kg) | 8.44 | 8.59 |
Table text extracted from the original PDF; superscript letters are shown inline. The original table image is below.
View original table image
| — | SA | A | U | D | SD |
|---|---|---|---|---|---|
| Land management can only be practices by farmer | 26 | 32.5 | 16.5 | 26 | 9 |
| Water loss due to run off is prevented by mulching | 34.5 | 22 | 20 | 16.5 | 10 |
| There should be adequate information on land management | 32 | 27 | 16.5 | 14.5 | 10 |
| Crop rotation improves the soil texture | 14 | 33 | 32.5 | 14 | 6.5 |
| Farmers would engage in irrigation if given advise and other inputs | 27 | 35.5 | 16.5 | 15.5 | 5.5 |
| Drainage prevents water logging in the soil | 16.5 | 29 | 24 | 21.5 | 9 |
| Planting leguminous crop improves the soil fertility | 17 | 24.5 | 38.5 | 16.5 | 3.5 |
| Land management practices are very important for the benefit of future generation and to prevent soil deterioration and environment degradation | 24 | 29.5 | 21 | 19 | 6.5 |
| Bush fallow maintains soil fertility | 22.5 | 24.5 | 25 | 17 | 11 |
| Mulching reduces evaporation | 25 | 32.5 | 22.5 | 21.5 | 9 |
Table text extracted from the original PDF; superscript letters are shown inline. The original table image is below.
View original table image
References
49 in the original paper- Adamu GK, Andmaharaz AY. A Comparative Study of Changes in Soil Fertility Under two Farming Practices in the Kano Close-Settled Zone, European Scientific Journal. 2014; 10(2):313-323.
- Adegoke OS. Eocene stratigraphy of Southwestern Nigeria. Bureau Researches Geologiques Miners Memoirs. 1969; 3:23-48.
- Adeoye GO, Agboola AA. Critical levels for soil pH, available P, K, Zn and Mn maize content of P, Cu and Mn in sedimentary soils of south -western Nigeria. Fertilizer Res. 1985; 6:65-71.
- Allison E. Organic carbom. In: Black CA, et al. (eds). Methods of soil analysis. Part 2. American Society of Agronomy, Madison, 1965, 1367-1378.
- Aweto AO. Organic carbon diminution and estimates of carbon dioxide release from plantation soil. Environmentalist. 1995; 15:10-15.
- Bernhard Reversat F, Loumeto JJ. The litter system in African forest-tree plantation. In: Reddy MV (Ed.). Management of tropical plantation, forest and their soil litter system. Science Publishing Inc, New Hampshire, USA, 2002
- Ogunkunle CO, Awotoye OO. Soil Fertility Status under Different Tree Cropping System in a Southwestern Zone of Nigeria. Notulae Scientia Biologicae. 2011; 3(2):123-128.
- Binns JA, Machonachie RA, Tanko AI. Water, Land and Health in Urban and Peri-urban food production: The case Kano,Nigeria; www.cityfarmer.org. In Adamu G. K Andmaharaz A. Y (2014) A Comparative Study of Changes in Soil Fertility Under Two Farming Practices in the Kano Close-Settled Zone, European Scientific Journal. 2003; 10(2):313-323.
- Bouyoucos GJ. Hydrometer method improved for making participle size analysis of soils. Soil Science Society of America Proceedings. Madison. 1962; 26:464-465.
- Blake GR. Bulk Density, In: Black C.A.Methods of Soil Analysis.Vol. I A.S.A., Madison, Wisconsin, 1965, 374-390.
- Corwin DL, Kffka SR, Hopmans JW, Mori Y, van Groenigen JW, et al. Assessment and Field-Scale Mapping of Soil Quality Properties of a Saline-Sodic Soil. Geoderma. 2003; 114:231-259.
- Panday D Ojha, Chalise RB, et al. Spatial Variability of Soil Properties under Different Land use in the Dang district of Nepal. Cogent Food and Agriculture. 2019; 5:1600460.
- Ekanade O. Small scale cocoa farmers and environmental changes in tropical rainforest region of South-Western Nigeria. Journal of Environment Management. 1985; 25:6170.
- Ekanade O. The Nutrient status of soils under peanut cocoa Farms of varying ages in Southwestern Nigeria. Biological Agriculture and Horticulture. 1988; 5:155-167.
- Ekanade RO. Hill-Slope Agro-Ecosystem and their implications on Environmental System in Rural Southwestern Nigeria. Agriculture, Ecosystem and Environment. 1997; 61:92-102.
- Salami AT, Orimoogunje OOI. Environmental Research and Challenges of Sustainable Development in Nigeria, Obafemi Awolowo University Press, Ile-Ife Nigeria, 2011, 31-62.
- Emadi MM, Baghernejad G, Emadi M. Effect of shifting cultivation on distribution of nutrient elements and carbohydrates within water-stable aggregates in Northern Iran. Pak J Biol Sci. 2008; 11:195-201.
- FAO. Land Resources Evaluation and the role of Landrelated indicators. In W.G Sombroek. Land Quality Indicator and Their Uses in Sustainable Agriculture and Rural Development. Land and Water Bulletin No. 5 Rome, 1997.
- FAO. Soil Fertility Management in Support of Food security in Sub-Saharan African, 2001. Available on ftp://ftp.fao.org/agl/agll/docs/foodsec.pdf
- Gomez B, Jones III JP. Research Methods in Geography: A Critical Introduction. John Wiley and Sons Ltd. 2010; 1:5052
- Greenland DJ. Long-Term Cropping Experiments in Developing Countries: The Need, The History, and Future. In:J. C. Waterlow, D. G. Armstrong, L. Fowden and R. Riley (eds.). Feeding the World Population of more than Eight Billion people: A Challenge to Science. Oxford University Press, Oxford, UK, 1995.
- Mulima IM, Ismaila M, Benisheikh KM, Saminu I. Assessment of Micronutrients Status of Soils under Millet Cultivation in Geidam Local Government Yobe State, Nigeria, Asian Journal of Basic and Applied Sciences. 2015; 2(2):32-41. www.multidisciplinaryjournals.com
- Hălbac Cotoară Zamfir R, Keesstra S, Kalantari Z. The impact of political, socio-economic and cultural factors on implementing environment friendly techniques for sustainable land management and climate change mitigation in Romania. Science of the Total Environment. 2019; 654:418-429.doi:10.1016/j.scitotenv.2018.11.160.
- Panday D Ojha, Chalise RB, Saurav D, et al. Spatial Variability of Soil Properties under Different Land use in the Dang district of Nepal. Cogent Food and Agriculture. 2019; 5:1600460.
- Jeje LK, Nabegu H. Sediment Yield in response to rainstorms and land use in small drainage basins in Ife Area of Southwestern Nigeria, Nigeria Geographical Journal. 1982; 25(1-2):87-103.
- Jones MJ, Wild A. Soils of the West African Savanna commonwealth Agriculture, Burcaux, Herpenden England, 1975, 246.
- Mulima IM, Ismaila M, Benisheikh KM, Saminu I. Assessment Of Micronutrients Status Of Soils Under Millet Cultivation In Geidam Local Government Yobe State, Nigeria, Asian Journal of Basic and Applied Sciences. 2015; 2 (2): 32-41. www.Multidisciplinaryjournals.com
- Kumar R. Research methodology: step by step approach for beginners.sage publication ltd. 2011; 3:167-175.
- Leemans R, Van dam Born GJ. Determining the Potential Global Distribution of Natural Vegetation, Crops and Agricultural Productivity. Nat. Air Soil Pollution. 1994; 76:133-161.
- Loveland P, Webb J. Is there a critical level of Organic Matter in the Agricultural Soils of Temperate Regions: A review. Soil and Tillage Res. 2003; 70(1):1-18.
- Joachim HJR Makoi, Ndakidemi PA. Selected Chemical Properties of Soil in the Traditional Irrigation Schemes of the Mbulu District, Tanzania. African Journal of Agricultural Research. 2008; 3(5):348-356. http://www.academicjournals.org/AJAR
- Mbah CN, Anikwe MAN, Onweremadu EU, Mbagwu JSC. Soil organic matter and carbohydrate content of a dystric leptosol under organic waster management and their role in structural stability of soil aggregates. Int J Soil Sci. 2007; 2:268-277.
- Mclean EO. Aluminum. In Black, C.A. (Ed.) (1965) Methods of Soil Analysis: Part 2. Chemical Methods. Madison: Asa, P.978-998. In Cassio Hamilton Abreu Jr.; Takashi Muraoka; André Fernando Lavorante (2003) Exchangeable Aluminum Evaluation In Acid Soils; Scientia Agricola. 2003; 60(3):543-548.
- MOAD. Statistical Information on Nepalese Agriculture 2015/16. Government of Nepal, Ministry Of Agricultural Development, Singhdurbar, Kathmandu, Nepal. In Panday, D. Ojha, R.B, Chalise, D. Saurav Das and Twanabasu, B, (2019). Spatial Variability of Soil Properties under Different Land use in the Dang district of Nepal. Cogent Food and Agriculture. 2017; 5:1600460.
- Mouazen AM, Dumont K, Maertens K, Ramon H. Two dimensional prediction of spatial variation in topsoil compaction of a sandy loam field based on measured horizontal force of compaction sensor, cutting depth and moisture content. Soil Till Res. 2003; 74:91-102.
- Panday D Ojha, Chalise RB, Saurav Das D, et al. Spatial Variability of Soil Properties under Different Land use in the Dang district of Nepal. Cogent Food and Agriculture. 2019; 5:1600460.
- Mudroch et al. Soils of The Western State Savnna in Nigeria. Vol. 1.The Environment Land Resources Division, Ministry of Overseas Development. Tolworth Tower, Surbiton, England KT6 7DY. In Nwachokor, M.A and Uzu, F.O. (2008). Updated Classification of Some Soil Series in Southwestern Nigeria, Journal of Agronomy. 1976; 7(1):7681
- National Population Commission (NPC), Federal republic of Nigeria official gazette, Lagos, 2006, 96(2).
- Nigeria Country Profile. Implementation of Agenda 21: Review of Progress Made since the United Nations Conference on Environment and Development, 1992.
- Ogunkunle CO, Awotoye OO. Soil Fertility Status under Different Tree Cropping System in a Southwestern Zone of Nigeria. Notulae Scientia Biologicae. 2011; 3(2):123-128.
- Olsen SR, Cole CV, Watanabe FS, Dean LA. Estimation of available Phosphorus in Soils by extraction with Sodium bicarbonate. U.S. Dep. of Agric. Circ, 1954, 939.
- Panday D, Maharjan B, Chalise D, Shrestha RK, Twanabasu B. Digital soil mapping in the Bara District of Nepal using Kriging tool in ArcGIS. PloS one. 2018; 13(10):e0206350. doi:10.1371/journal.pone.0206350.
- Panday D Ojha, Chalise RB, et al. Spatial Variability of Soil Properties under Different Land use in the Dang district of Nepal. Cogent Food and Agriculture. 2019; 5:1600460.
- Schroth G, Sinclair FL. Trees, crops and Soil fertility concepts and research methods. CABI Publishing, Wallingfold, 2003.
- Ogunkunle CO, Awotoye OO. Soil Fertility Status under Different Tree Cropping System in a Southwestern Zone of Nigeria. Notulae Scientia Biologicae. 2011; 3(2):123-128.
- Spurgeon DJ, Keith AM, Schmidt O, et al. Land-use and land-management change: Relationships with earthworm and fungi communities and soil structural properties. BMC Ecology. 2013; 13(1):46.
- Panday D Ojha, Chalise RB, Saurav Das D, et al. Spatial Variability of Soil Properties under Different Land use in the Dang district of Nepal. Cogent Food and Agriculture. 2019; 5:1600460.
- Sunita M, Uma M. Environment and Agro-forestry. Indian Farmers Digest. 1993; 25(3):29-30.
- Tellen VA, Yerima Bernard PK. Effects of land use change on soil physicochemical properties in selected areas in the North West region of Cameroon. Environmental systems research. 2018; 7(3):1-29.