
Research article · 2019 · Full text
International Journal of Agriculture and NutritionSpectrophotometric estimation of ascorbic acid and total phenol and flavonoid contents of certain fruits in Sivasagar, Assam, India
Volume 1(3) · Pages 12–16 · DOI: 10.33545/26646064.2019.v1.i3a.22 ↗
Research areasPsidium guajava Extracts and ApplicationsPlant Physiology and Cultivation Studies
Abstract
Author-writtenFruits contain various biologically active compounds and vitamins that can promote certain synergistic and health-related activities which signify the phrase that “fruit juices are the pure gifts from mother nature”. Ascorbic acid (Vitamin C) cannot be synthesized by humans directly hence needs to be supplemented with the diet of their natural form. Besides the biologically active compounds such as phenols and flavonoids which is the natural source of antioxidants, ascorbic acid plays a vital role in various beneficial activities. The present studies were conducted to estimate the phenol and flavonoid, and ascorbic acid contents in fruits like Spondias pinnata (L.F.) Kurz., Psidium guajava L., Syzynium cumini (L.) Skeels., Syzynium jambos((L.) Alston., Prunus persica (L.) Stokes and Pyrus communis L. were estimated by the spectrophotometric method. The vitamin C, total phenol and flavonoid contents were determined by the standard protocol. The vitamin C estimation was found highest in P. guajava (0.300±0.030) followed by S. cumini (0.280±0.039) and S. jambos (0.027±0.021). The phenol content was found significantly highest in S. cumini (0.153±0.013) followed by S. jambos (0.127±0.018) and P. guajava (0.123±0.018). Also the flavonoid content was observed highest in P. guajava (0.587±0.067), S. jambos (0.245±0.074) and S. cumini (0.192±0.056). The results of the present investigation were analyzed statistically by using ANOVA single factor analysis and the p value was found less than the significant level (p < 0.05). The data so obtained reflects that the fleshy fruits are an important source of phytochemicals with potent antioxidant activity.
Summary
Source-checkedPlain-language reading of the full paper, prepared with AI and checked against the text. Each point links to the authors' own words.
Why it matters
- Fruits provide health benefits and protection against diseases because they contain vitamins like ascorbic acid and polyphenol compounds. View evidence ↗
- Bioactive compounds in fruits have shown potential in addressing serious health issues, including cancer, diabetes, and cardiovascular diseases. View evidence ↗
- Since humans cannot produce Vitamin C (ascorbic acid) on their own, it must be obtained through dietary sources. View evidence ↗
The question
- The study aimed to use spectrophotometric methods to measure the levels of ascorbic acid, phenols, and flavonoids in six specific fruit species. View evidence ↗
What they did
- Fruit samples were gathered from the Sivasagar district of Assam, India, between June and July 2019. View evidence ↗
- To prepare extracts, 100 mg of dried fruit samples were soaked in 100 ml of methanol. View evidence ↗
- The researchers used the Folin Ciocalteu method for phenols, the Colorimetric aluminum chloride method for flavonoids, and the 2,4-dinitrophenyl hydrazine (DNPH) method for Vitamin C. View evidence ↗
- Data from the experiments were analyzed using single-factor analysis of variance (ANOVA) to determine statistical significance. View evidence ↗
What they found
- Psidium guajava had the highest Vitamin C content at 0.300±0.030 mg/g, followed by S. cumini (0.280±0.039 mg/g). View evidence ↗
- The highest phenol content was found in S. cumini (0.153±0.013 mg/g), with S. jambos (0.127±0.018 mg/g) and P. guajava (0.123±0.018 mg/g) following. View evidence ↗
- The highest flavonoid content was observed in Prunus persica (0.587±0.067 mg/g), followed by Pyrus communis (0.245±0.074 mg/g) and S. cumini (0.192±0.056 mg/g). View evidence ↗
- All six fruit samples tested positive for the presence of phenols, flavonoids, alkaloids, terpenoids, and tannins. View evidence ↗
- Statistical analysis confirmed a significant difference (p < 0.05) in the concentrations of the measured compounds across the different fruit samples. View evidence ↗
What it means
- The authors conclude that the studied fruits contain bioactive vitamins and polyphenols that may have promising curative effects on various diseases. View evidence ↗
- The authors recommend further experimental research to investigate the nutritional values of other unknown fruits used by different tribes and regional populations. View evidence ↗
Visual summary
2 visualsIllustrations explain the paper; charts are replotted from the paper's own table values.
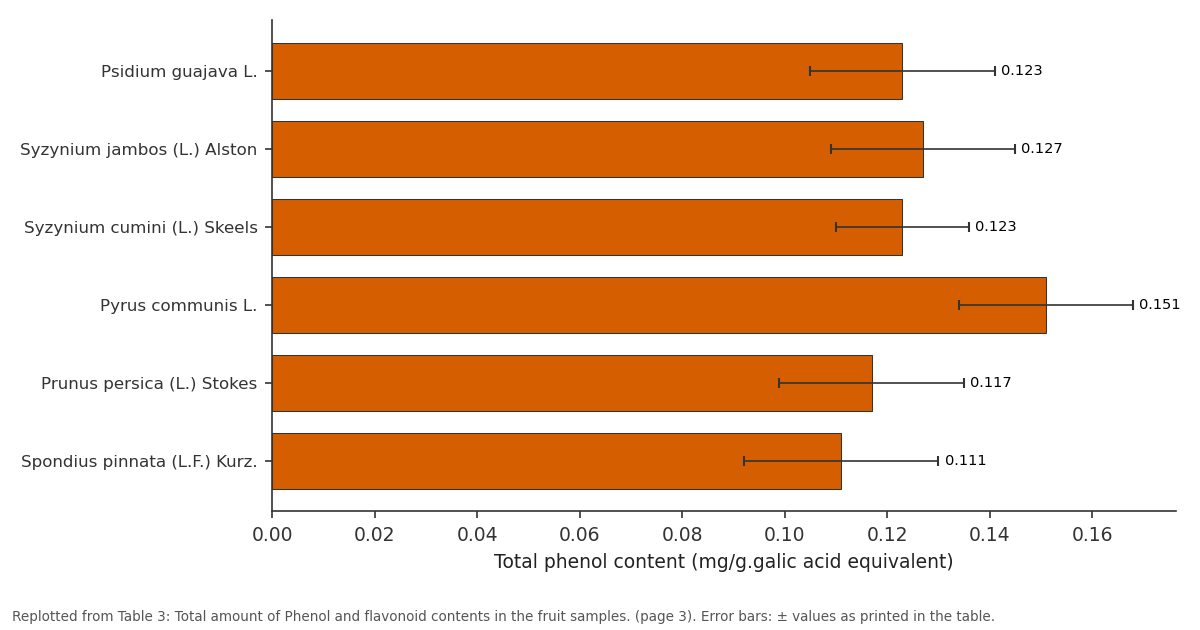
Total phenol content (mg/g.galic acid...: Psidium guajava L. vs Syzynium jambos (L.)... vs Syzynium cumini (L.)... vs Pyrus communis L. vs Prunus persica (L.)...
Replotted from Table 3 (page 3) of the original paper. Every bar is the paper's own table value.
View source evidence ↗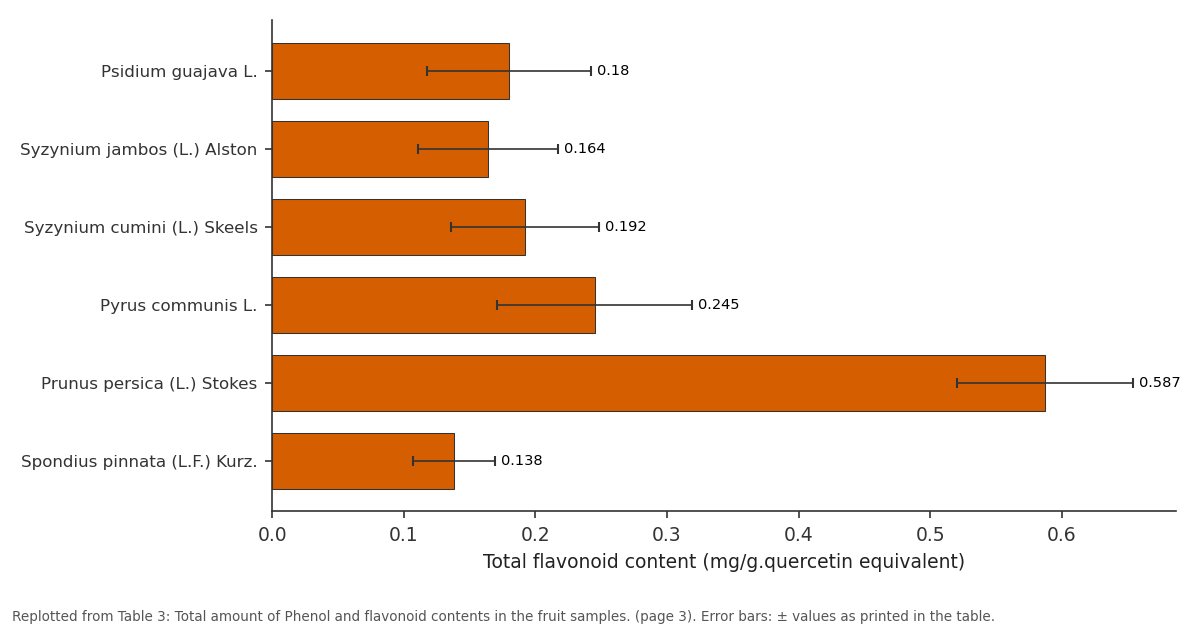
Total flavonoid content (mg/g.quercetin...: Psidium guajava L. vs Syzynium jambos (L.)... vs Syzynium cumini (L.)... vs Pyrus communis L. vs Prunus persica (L.)...
Replotted from Table 3 (page 3) of the original paper. Every bar is the paper's own table value.
View source evidence ↗Figures & tables
From the original paper Table 1
 Table 2
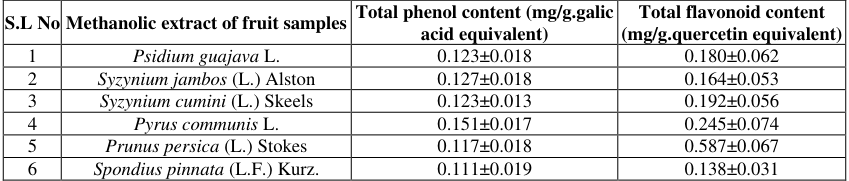 Table 3
 Table 4
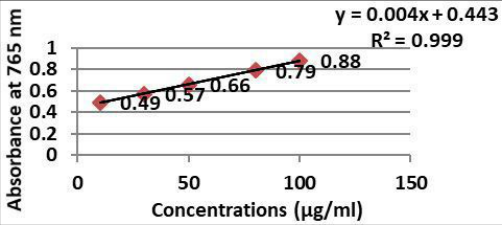 Figure 1
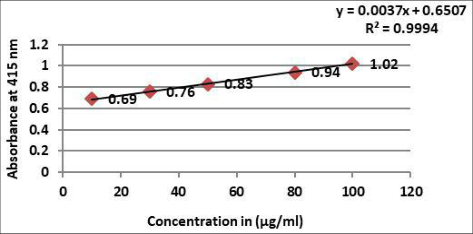 Figure 2
 Table 5
 Table 6
 Table 7
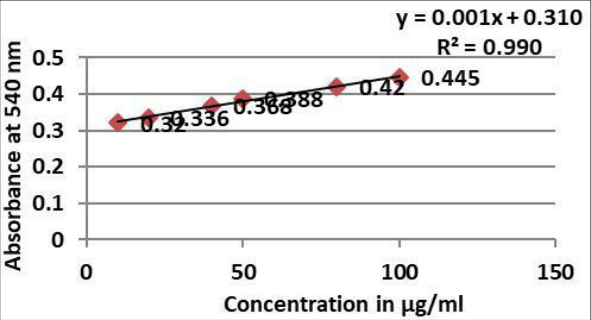 Figure 3
Introduction
"An apple a day keeps a doctor away" the popular phrase that reveals the importance of fruits in our day to day life. Interestingly, from the time of traditional Ayurveda, there exist strong evidence and belief about the nutraceutical and medicinal importance among the peoples at that time. Fruits are one of the pure products of mother nature having certain physiological benefits related to human health due to the presence of certain polyphenols compounds, vitamins (ascorbic acid) imparting a protective role against several diseases. Recent studies have shown promising results for these compounds in various pathological complications such as diabetes, atherosclerosis, cardiovascular diseases (CVDs), cancer, and neurological disorder Most of the nutraceuticals have antioxidant activity with the ability to counteract this situation. Hence, they are considered as healthy sources of health promotion, especially for the prevention of life-threatening diseases [1,2,3] . Phytochemical screening involves botanical identification, extraction with suitable solvents, purification, and characterization of the bioactive constituents of pharmaceutical importance [4,5,6] . Such substances may range from isolated nutrients, dietary supplements and specific diets to genetically engineered designer foods, herbal products, processed foods and beverages [7,8,9] . Polyphenols form a large group of phytochemicals, which are produced by plants as secondary metabolites to protect them from photosynthetic stress, reactive oxygen species. There are approximately 8,000 different classes of polyphenols, the most important being flavonols, flavones, flavan-3-ols, flavanones, and anthocyanins. The highly branched phenylpropanoid pathway synthesizes the majority of polyphenols. The most commonly occurring polyphenols in food include flavonoids and phenolic acids [10,11,12] . Assam, due to its diverse climate, topography and agricultural conditions can be considered as one of the richest biodiversity hotspots of the world. There may exist different diversity among the different fruits such as wild, semi-wild, semi-domesticated and cultivated Because of this widespread use, it is incumbent on the scientific community to have access to rigorous and reliable information of the experimental and clinical pharmacology of fruit products. Therefore, based on several informative reviews published in the concerned area, this paper aims to provide an overview of the importance of the nutraceutical properties of indigenous fruits.
Materials and Methods
Materials and Methods
Collection of plant materials
The fruit samples have been collected from Sivasagar district, Assam during June-July 2019. The fruits collected for the study were healthy, since microbial and other infections may change the metabolites produced by the specimens. The materials were dried in hot air oven (30-40ºC) to become suitable for grinding.
Extract preparation
The dried fruit materials were pulverized using a sterile electric blender to a fine powder and stored in airtight dark bottles at room temperature. The methanolic extracts were prepared by soaking 100 mg of dried fruit samples in 100 ml of methanol. The extracts were filtered and were stored in airtight dark bottles for various analyses.
Phytochemical Screening of secondary metabolites
The methanolic fruit extracts were assessed for the existence of photochemical constituents by using the standard methods described by [13,14,15] .
Test for Flavonoids Shinoda test:
To the crude extract, 5ml of 95% of ethanol, few drops of concentrated HCL and few pieces of magnesium turnings were added. Appearance of pink or magenta red color indicates the presence of flavonoids.
Alkaline reagent test:
To check the presence of flavonoid a few drops of sodium hydroxide solution were mixed with 1ml of each extract. Intense yellow color was formed which becomes colorless on addition of few drops of dilute acetic acid that confirmed the presence of flavonoids.
Test for Phenolics compounds
Ferric chloride test: 2ml of the extract was dissolved in distilled water and to this 2-3 drops of 5% ferric chloride were added. appearance of deep blue color or black color indicates the presence of phenol compounds and tannins.
Test for Tannins
Lead acetate test: To 1ml of each extract, a few drops of 10% lead acetate were added to check the presence of tannins. Appearance of precipitation confirms the presence of tannins.
Test for Terpenoids Salkowski's test
The methanolic extracts of each plant were mixed with chloroform and filtered. Formation of red color ion the lower layer suggests the presence of steroids. Presence of terpenoids was well confirmed by formation of reddish brown color of edges after addition of concentrated sulphuric acid.
Tests for Alkaloids
Tests for Alkaloids
Determination of total phenol and flavonoid contents
Folin Ciocalteu method, as described by [16,17,18] was used for phenol content determination, briefly, 100 mg plant samples were dissolved in 10ml methanol of 50 % (V/V of distilled water). The solution was filtered. 0.5 ml of the filtrate was mixed with 2ml of folin Ciocalteu reagent (1:1 diluted with distilled water) and mixed thoroughly. After 5 minutes, 2ml of 10% Na 2 CO 3 solution was added. The solution was warmed for 1 minute and then cooled. After 1 hour at room temperature absorbance was measured at 765 nm with a UV-visible spectrophotometer. Sample blank was prepared to contain 0.5ml distilled water, 2ml of folin Ciocalteu reagent, 2ml of Na 2 CO 3 dissolved in water.
Total phenol content was calculated as gallic acid equivalent from a calibration curve. The calibration curve was prepared by gallic acid solution at different concentrations in methanol (50%). Total phenol content is expressed in terms of gallic acid equivalent as mg/g of dry mass.
The Colorimetric aluminum chloride method, as described by [19] was used for flavonoid content determination. The total content of flavonoid was determined in terms of quercetin calibration curve. 100 mg of plant samples was dissolved in 10 ml of methanol. The solutions were filtered. From the above filtrate, 2ml was taken in a test tube, mixed with 100 µl of 10% aluminum chloride, 100µl of 1M potassium acetate and 2.8 ml distilled water. The mixture was then incubated for 30 minutes at room temperature and the absorbance was recorded at 415 nm. To prepare the calibration curve quercetin solution was prepared in different concentrations in methanol. Total flavonoid content was calculated in terms of quercetin equivalent as mg/g of dry mass. All the tests were performed in triplicates.
Determination of Vitamin C content
The total vitamin C in fruit samples, was determined by 2,4dinitrophenyl hydrazine methods (DNPH) [20,21,22] . This was a simplified method for the simultaneous determination of the total vitamin C employed coupling reaction of 2,4dinitrophenylhydrazine dye with vitamin C and followed by the spectrophotometric determination. To the filtered sample solution few drops of bromine water were added until the solution became colored (to confirm the completion of the oxidation of ascorbic acid to dehydroascorbic acid). Then few drops of thiourea were added to it to remove the excess bromine and thus the clear solution was obtained. Then 2,4-dinitrophenyl hydrazine solution was added thoroughly with all standards and also with the oxidized ascorbic acid. Total vitamin C employing coupling reaction of 2,4-dinitrophenyl hydrazine dye with vitamin C and followed by the spectrophotometric determination.
Results and Discussion
The phytochemical analysis of the fruit samples extracts from methanol has shown the presence of vital secondary metabolites such as phenol, flavonoids, terpenoids, tannins, alkaloids. The results obtained were recorded in Table 2. The total amount of phenol, flavonoid and vitamin C contents were calculated in terms of gallic acid (y = 0.004x+0.443, R 2 = 0.999), quercetin (y =0.003x + 0.650, R 2 = 0.999) and ascorbic acid (y = 0.001x+0.310, R 2 = 0.990) standard curves respectively (Figure 1, 2 and 3). The total phenol, flavonoid and vitamin C contents were summarized in (Table 3 and4). The statistical analysis for the phenol, flavonoid and vitamin C contents were recorded in (Table 5, 6 and7). The phenol, flavonoid and vitamin C content of the fruit samples were comparatively highest thus acting as a source of natural antioxidants. The quantification of antioxidant properties can serve as a guide for the use of the plants in ROS related diseases. The replicated data of all the experiments were checked through analysis of variance (ANOVA) against a single factor [23,24] . From the data analysis, it was found that there was a significant difference among the different concentrations of the fruit samples against absorbance at p<0.05 level under in-vitro conditions.
| Anova: Single Factor | — | — | — | — | — | — |
|---|---|---|---|---|---|---|
| Source of Variation | SS (sum of squares) | Df (Degrees of freedom) | MS (Mean square) | F (variation between samples mean value) | P (probability value) | F crit(critical value) |
| Between Groups | 0.00281 | 2 | 0.001405 | 4.086687 | 0.044301 | 3.885294 |
| Within Groups | 0.004125 | 12 | 0.000344 | |||
| Total | 0.006935 | 14 |
Table text extracted from the original PDF; superscript letters are shown inline. The original table image is below.
View original table image
| S.L No | Methanolic extract of fruit samples | Total phenol content (mg/g.galic acid equivalent) | Total flavonoid content (mg/g.quercetin equivalent) |
|---|---|---|---|
| 1 | Psidium guajava L. | 0.123±0.018 | 0.180±0.062 |
| 2 | Syzynium jambos (L.) Alston | 0.127±0.018 | 0.164±0.053 |
| 3 | Syzynium cumini (L.) Skeels | 0.123±0.013 | 0.192±0.056 |
| 4 | Pyrus communis L. | 0.151±0.017 | 0.245±0.074 |
| 5 | Prunus persica (L.) Stokes | 0.117±0.018 | 0.587±0.067 |
| 6 | Spondius pinnata (L.F.) Kurz. | 0.111±0.019 | 0.138±0.031 |
Table text extracted from the original PDF; superscript letters are shown inline. The original table image is below.
View original table image
| S.L No | Methanolic extract of plant species | Phenols | Flavonoids | Alkaloids | Terpenoids | Tannins |
|---|---|---|---|---|---|---|
| 1 | Spondius pinnata (L.F.) Kurz. | + | + | + | + | + |
| 2 | Psidium guajava L. | + | + | + | + | + |
| 3 | Syzynium cumini (L.) Skeels | + | + | + | + | + |
| 4 | Syzynium jambos (L.) Alston | + | + | + | + | + |
| 5 | Prunus persica (L.) Stokes | + | + | + | + | + |
| 6 | Pyrus communis L. | + | + | + | + | + |
Table text extracted from the original PDF; superscript letters are shown inline. The original table image is below.
View original table image
Conclusions
This paper focuses on the beneficial effect of fruits in day to day life. As the fruits contain a significant amount of bioactive compounds that aid in providing desirable health benefits besides the basic nutrition, the present study reveals the presence of pharmaceutically important bioactive compounds such as polyphenols and vitamins in the fruit samples that have a promising curative effect related to various disease symptoms. The fruit nutraceuticals offer an advantage over synthetic drugs. Therefore, an effort to be forwarded in the research areas experimentally to investigate certain other fruits which values are still unknown among the peoples of certain areas and tribes.
Acknowledgements
Authors are grateful to the Department of Biotechnology, Ministry of Science and Technology, Government of India, New Delhi, India for financial support in the form of Institutional Level Biotech Hub.
Figures and tables from the paper
| Sl. No | Scientific Name | Family | Vernacular Name | Time of availability | Taste |
|---|---|---|---|---|---|
| 1 | Spondias pinnata (L.F.) Kurz. | Anacardiaceae | Amora | August- October | Sweetish sour |
| 2 | Psidium guajava L. | Myrtaceae | Modhuri | May- June | Sweetish sour |
| 3 | Syzynium cumini (L.) Skeels | Myrtaceae | Kola jamuk | June-July | Sweet |
Table text extracted from the original PDF; superscript letters are shown inline. The original table image is below.
View original table image
| SL No | Methanolic extract of fruit samples | Vitamin C content (mg/g.galic acid equivalent) |
|---|---|---|
| 1 | Psidium guajava L. | 0.300±0.030 |
| 2 | Syzynium jambos (L.) Alston | 0.277±0.021 |
| 3 | Syzynium cumini (L.) Skeels | 0.280±0.039 |
| 4 | Pyrus communis L. | 0.270±0.047 |
| 5 | Prunus persica (L.) Stokes | 0.275±0.034 |
| 6 | Spondius pinnata (L.F.) Kurz. | 0.270±0.069 |
Table text extracted from the original PDF; superscript letters are shown inline. The original table image is below.
View original table image
| Anova: Single Factor | — | — | — | — | — | — |
|---|---|---|---|---|---|---|
| Source of Variation | SS (sum of squares) | Df (Degrees of freedom) | MS (Mean square) | F (variation between samples mean value) | P (probability value) | F crit (critical value) |
| Between Groups | 0.031306 | 2 | 0.015653 | 4.766028 | 0.029962 | 3.885294 |
| Within Groups | 0.039412 | 12 | 0.003284 | |||
| Total | 0.070718 | 14 |
Table text extracted from the original PDF; superscript letters are shown inline. The original table image is below.
View original table image
| Anova: Single Factor | — | — | — | — | — | — |
|---|---|---|---|---|---|---|
| ANOVA | ||||||
| Source of Variation | SS (sum of squares) | Df (Degrees of freedom) | MS (Mean square) | F (variation between samples mean value) | P (probability value) | F crit (critical value) |
| Between Groups | 0.010652 | 2 | 0.005326 | 18.93057 | 0.000194 | 3.885294 |
| Within Groups | 0.003376 | 12 | 0.000281 | |||
| Total | 0.014028 | 14 |
Table text extracted from the original PDF; superscript letters are shown inline. The original table image is below.
View original table image
References
20 in the original paper- Cai YZ, Sun M, Corke H. Antioxidant activity of betalains from plants of the Amaranthaceae. J Agric Food Chem. 2003; 51(8):2288-2294.
- Gokmen V, Serpen A, Fogliano V. Direct measurement of the total antioxidant capacity of foods: the 'QUENCHER' approach. Trends in Food Science and Technology. 2009; 20(6-7):278-288.
- Prakash D, Gupta C, Sharma G. Importance of phytochemicals in nutraceuticals. Journal of Chinese Medicine Research and Development. 2012; 1(3):70-78.
- Hassimotto NMA, Genovese MI, Lajolo FM. Antioxidant Activity of Dietary Fruits, Vegetables, and Commercial Frozen Fruit Pulps. Journal of Agricultural and Food Chemistry. 2005; 53(8):2928-2935.
- Zheng W, Wang SY. Oxygen Radical Absorbing Capacity of Phenolics in Blueberries, Cranberries, Chokeberries, and Lingonberries. Journal of Agricultural and Food Chemistry. 2003; 51(2):502-509.
- Das L, Bhaumik E, Raychaudhari U, Chakraborty R. Role of nutraceuticals in human health. J Food Sci Technol. 2012; 49(2):173-183.
- Haq IU, Rab A. Characterization of physico-chemical attributes of litchi fruit and its relation with fruit skin cracking. J Anim Plant Sci. 2012; 22(1):142-14.
- Chavez-Santoscoy RA, Gutierrez-Uribe JA, Serna-Saldívar SO. Phenolic Composition, Antioxidant Capacity and In Vitro Cancer Cell Cytotoxicity of Nine Prickly Pear (Opuntiaspp) Juices. 2009.Plant Foods for Human Nutrition. 64(2):146-152.
- Dutta B. Study of secondary metabolite constituents and curcumin contents of six different species of genus Curcuma. J Med Plants Stud. 2015; 3(5):116-119.
- Praksh D, Gupta C, Sharma G. Importance of Phytochemicals in Nutraceuticals. Journal of Chinese Medicine Research and Development (JCMRD). 2012; 1(3):70-78.
- Pandey N, Barve D. Phytochemical and pharmacological review on Annona squamosa L. Int J Res Pharm Biomed Sci. 2011; 2(4):1404-1412.
- Dutta B, Mahanta B. Studies on secondary metabolites, total phenol and flavonoid contents of Eupatorium cannabinum L. in Assam, India. JMPS. 2016; 4(2):130-133.
- Moyer RA, Hummer KE, Finn CE, Frei B, Wrolstad RE. Anthocyanins, Phenolics, and Antioxidant Capacity in Diverse Small Fruits: Vaccinium, Rubus, and Ribes. Journal of Agricultural and Food Chemistry. 2002; 50 (3):519-525.
- Juhaimi FAL, Ozcan MM, Ghafoor K, Babiker EE, Hussain S. Comparison of cold-pressing and soxhlet extraction systems for bioactive compounds, antioxidant properties, polyphenols, fatty acids and tocopherols in eight nut oils. J Food Sci Technol. 2018; 55(8):3163-3173.
- Dutta B. Study of secondary metabolites of Gomphostemma niveum Hook. f. in Assam, India. JMPS. 2014; 2(5):24-28.
- Khan Rahman MM, Rahman MM, Islam MS, Begum SA. A Simple UV-spectrophotometric Method for the Determination of Vitamin C Content in Various Fruits and Vegetables at Sylhet Area in Bangladesh. Journal of Biological Sciences. 2006; 6(2):388-392.
- Gonord FP, Bidel LPR, Fanciullino AL, Gautier H, Lopez FL. Urban. Health Benefits of Vitamins and Secondary Metabolites of Fruits and Vegetables and prospects to increase their concentrations by agronomic approaches. Journal of Agricultural and Food Chemistry. 2010; 58(23):12065-12082.
- Adem SM, Leung SH, Elles LMS, Shaver LA. A Laboratory Experiment for Rapid Determination of the Stability of Vitamin C. Journal of Chemical Education. 2016; 93(10):1766-1769.
- Kim TK. Understanding one-way ANOVA using conceptual figures. Korean journal of anesthesiology. 2017; 70(1):22.
- Saxena M, Saxena J, Pradhan A. Flavonoids and phenolic acid as antioxidants in plants and human health. Int. J. Pharm. Sci. Rev. Res. 2012; 16(2):130-134.