
Research article · 2020 · Full text
International Journal of Biology SciencesEconomic valuation of ecosystem services of Lake Dambal in Oromia regional state, Ethiopia
Volume 2(1) · Pages 41–49 · DOI: 10.33545/26649926.2020.v2.i1a.65 ↗
Research areasAquatic Ecosystems and BiodiversityWater resources management and optimizationEconomic and Environmental Valuation
Abstract
Author-writtenProtecting Lake Ecosystem is crucial not only to protect this country’s public and economic health, but also to preserve and to restore the natural environment for all aquatic and terrestrial living things. Even if the Dambal is known for its` multifuctionality and rich in it’s` lake resources, some parts of this lake is now degraded. This study was initiated to estimate households’ mean willingness to pay (WTP) for the protection of the lake and to identify factors that affects the maximum willingness to pay for protection of Dambal lake. To meet these objectives, data from 237 rural households were collected using multi stage random sampling procedures. In the study both descriptive and econometrics analysis are employed. Econometric models such as, seemingly unrelated bivariate probit and double hurdle models were used to estimate mean WTP and determinants of WTP, respectively. Factors such as age of household head, credit acess, distance from home to the lake, frequency of extension contact and participation in lake conservation practices have significant effect on the households’ WTP. Thus, critical consideration of such factors is pertinent to increase the level of public support towards the rehabilitation intervention. Econometric models such as, seemingly unrelated bivariate probit and double hurdle models were used to estimate mean WTP and determinants of WTP, respectively. The result shows that the mean WTP values from double bounded dichotomous choice ranges From 195.5 to 250.7ETB per year per household. Therefore, the aggregate welfare gain expected from the protection intervention ranges from 5,540,733.6 to 6,352,405.1 per year.
Summary
Source-checkedPlain-language reading of the full paper, prepared with AI and checked against the text. Each point links to the authors' own words.
Why it matters
- Ecosystem services provide essential benefits to humans, including food, water, flood regulation, and cultural values. View evidence ↗
- Lake Dambal is a multifunctional freshwater resource used for fishing, irrigation, and water supply, but it is currently facing degradation due to land and water use activities. View evidence ↗
- Because many lake ecosystem services are not traded in traditional markets, specialized non-market valuation techniques are required to determine their economic worth. View evidence ↗
The question
- The study aimed to estimate the mean amount rural households are willing to pay (WTP) to protect Lake Dambal and to identify the factors influencing this maximum payment. View evidence ↗
What they did
- The researchers collected data from 237 rural households using a multi-stage random sampling approach. View evidence ↗
- A double-bounded dichotomous choice method was used, with initial bid amounts of 150, 180, 200, and 245 ETB per year per household. View evidence ↗
- The study employed a seemingly unrelated bivariate probit model to estimate mean WTP and a double hurdle model to determine the factors affecting WTP. View evidence ↗
What they found
- The estimated mean willingness to pay for the protection of the lake ranges from 195.5 to 250.7 ETB per year per household. View evidence ↗
- The total expected aggregate welfare gain from the lake protection intervention is estimated between 5,540,733.6 and 6,352,405.1 ETB per year. View evidence ↗
- A large majority of surveyed households (87.76%) expressed a willingness to contribute to the lake's protection, while 12.24% were unwilling. View evidence ↗
- Proximity to the lake positively affects WTP; for every additional minute of walking distance from home, the probability of being willing to pay decreases by 0.6%. View evidence ↗
- Increased interaction with extension agents improves WTP, with each additional contact increasing the probability of willingness to pay by 5.78%. View evidence ↗
- Households with larger landholdings near the lake are less likely to pay for protection, with a 5.2% decrease in WTP probability for every additional hectare of land. View evidence ↗
- Access to credit services was found to negatively impact WTP, reducing the probability of willingness to pay by 34.65% compared to non-users. View evidence ↗
- Livestock ownership serves as a proxy for wealth and positively influences the payment amount, with each additional Tropical Livestock Unit (TLU) increasing WTP by 12 ETB. View evidence ↗
- The age of the household head negatively affects the payment amount, with each additional year of age decreasing the WTP by 1.25 ETB. View evidence ↗
What it means
- The authors conclude that socio-economic and institutional factors are more influential than demographic factors in determining both the probability and the amount of willingness to pay. View evidence ↗
- The authors recommend that stakeholders and project planners specifically account for the significant socio-economic variables identified in the study when designing lake protection plans. View evidence ↗
Visual summary
3 visualsIllustrations explain the paper; charts are replotted from the paper's own table values.
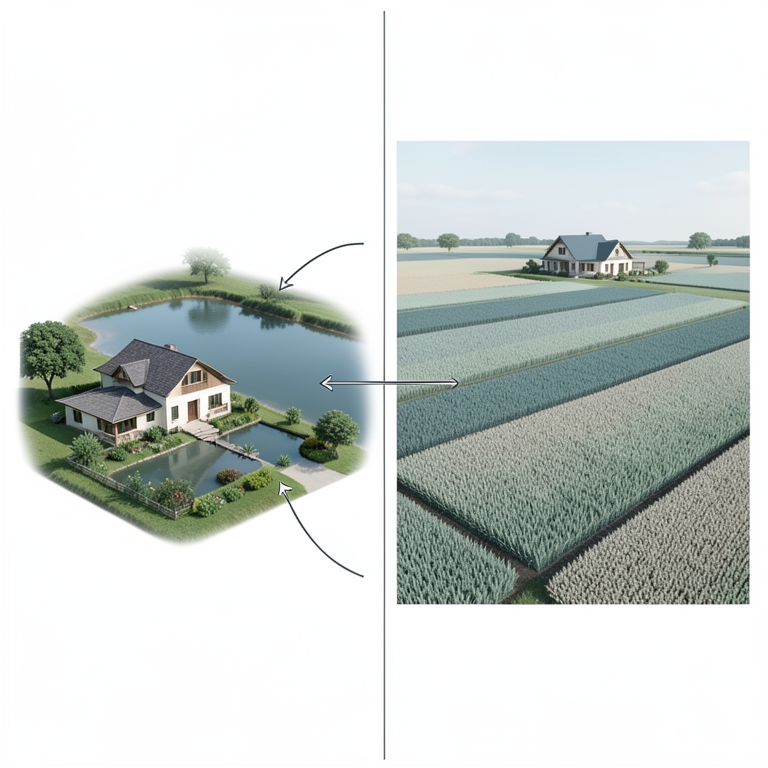
Factors Influencing WTP Probability
AI-generated conceptual illustration (Lake Dambal in Ethiopia and surrounding rural farmland). It explains the idea and does not show study data.
View source evidence ↗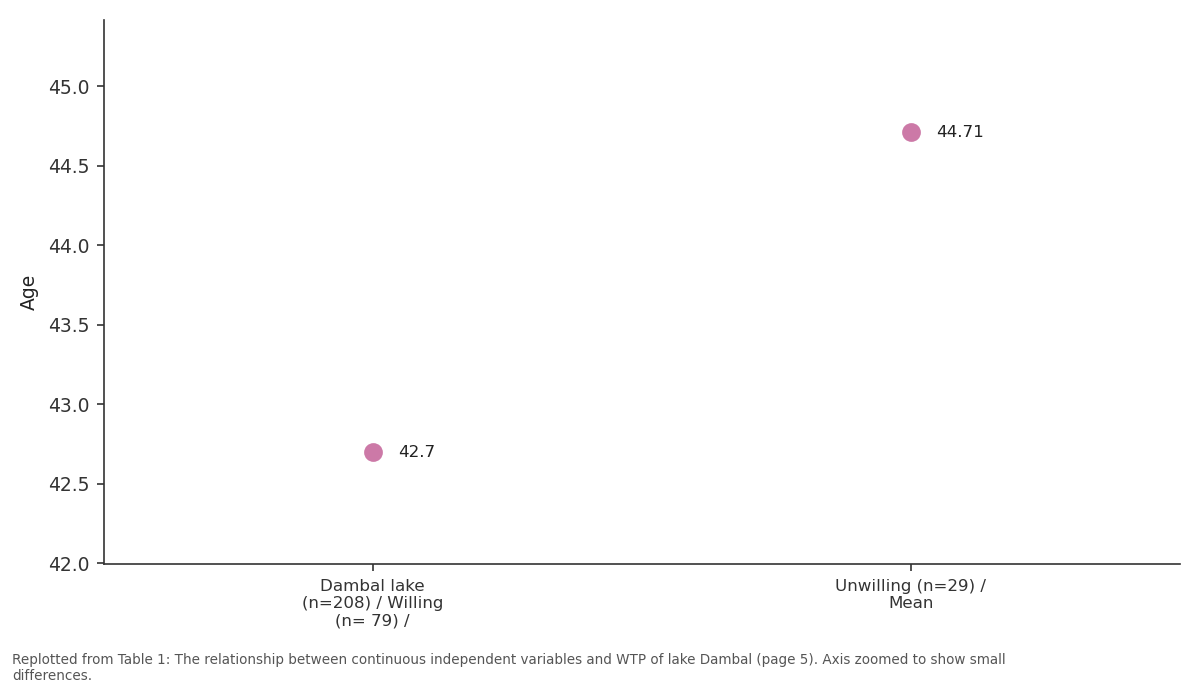
Age: Dambal lake (n=208) /... vs Unwilling (n=29) / Mean
Replotted from Table 1 (page 5) of the original paper. Every bar is the paper's own table value.
View source evidence ↗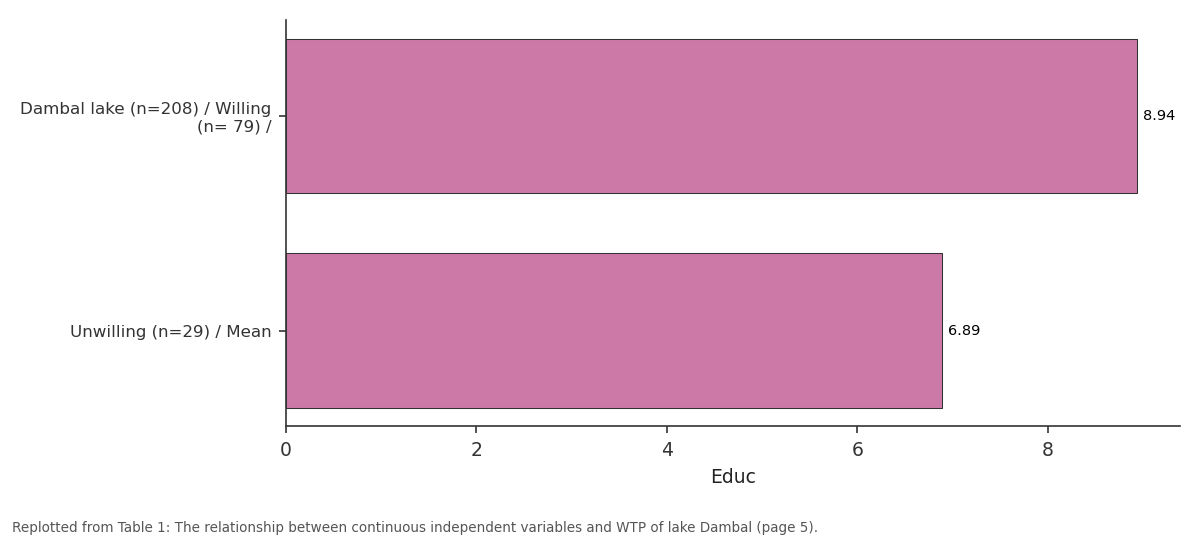
Educ: Dambal lake (n=208) /... vs Unwilling (n=29) / Mean
Replotted from Table 1 (page 5) of the original paper. Every bar is the paper's own table value.
View source evidence ↗Figures & tables
From the original paper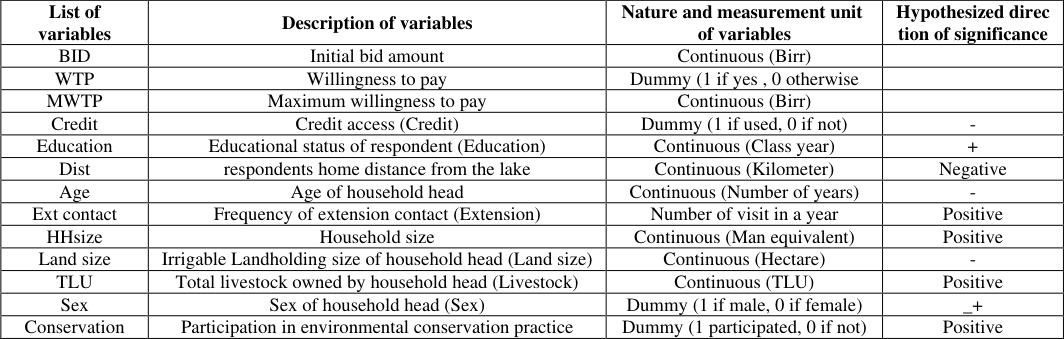 Table 1
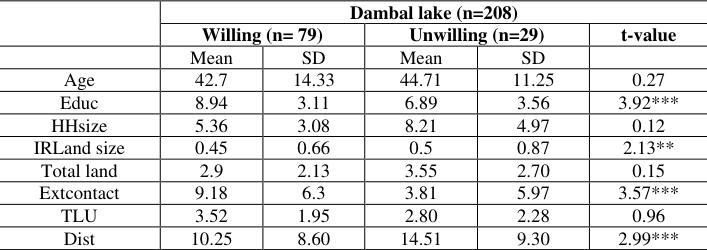 Table 1
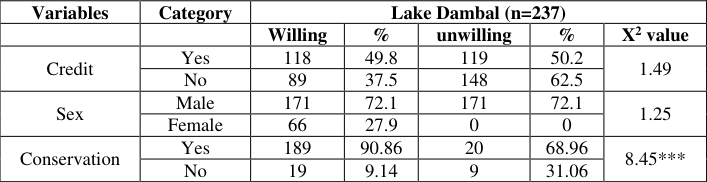 Table 3
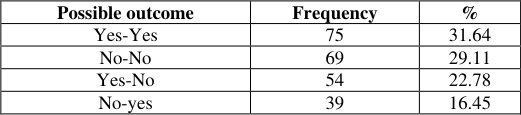 Table 4
 Table 5
 Table 6
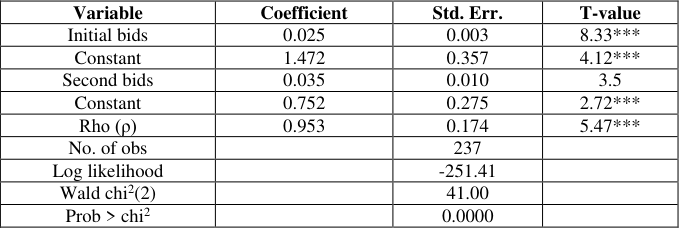 Table 7
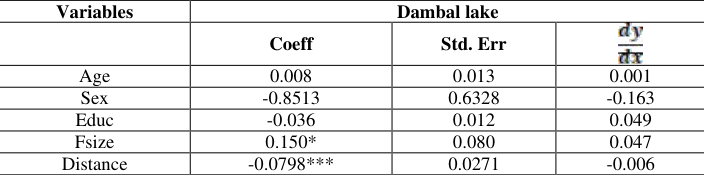 Table 9
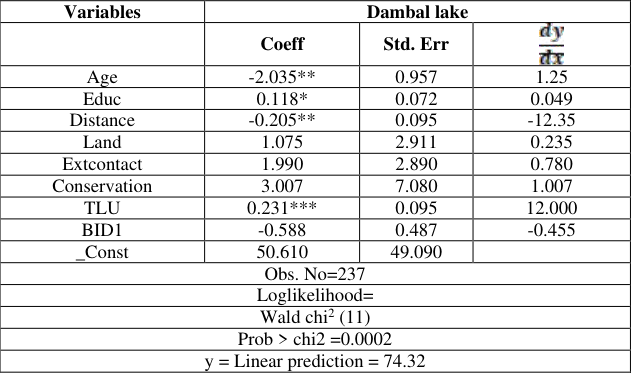 Table 10
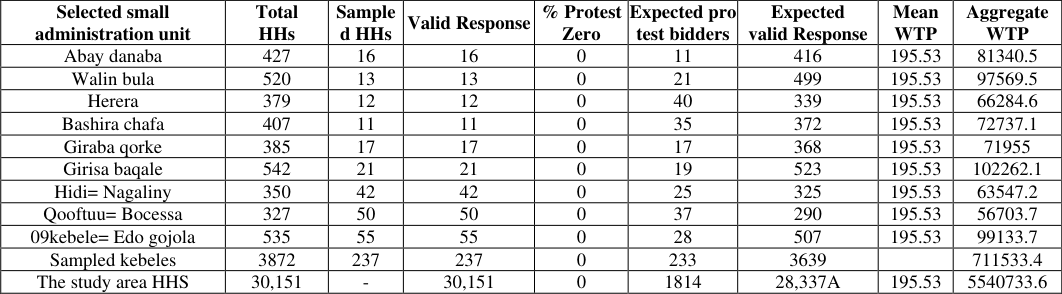 Table 11
Introduction
Ecosystem service is defined as "the benefits people obtain from ecosystems. These include provisioning services such as food and water; regulating services such as regulation of floods, drought, land degradation, and disease; supporting services such as soil formation and nutrient cycling; and cultural services such as recreational, spiritual, religious, and other nonmaterial benefits"(CGIA, 2016). The livelihoods of people living in, or near to the wetlands depend on ecosystem services in deferent levels. Loss or degradation of the water balance harms them directly and indirectly as ecosystems play a critical role in their daily life and in maintaining the quality of the environment by absorbing and processing waste products (Petra et al., 2008). Lakes (and more generally freshwater resources) provide many services. Some of them are directly valued by humans (increased water quantity, reduced damage due to flooding) whereas others benefit mainly to environment (reduced erosion, improved habitat for species). Since most of these services are not traded on markets, their economic valuation is not straightforward. As a result a wide non-market valuation literature has developed in the last decades and numerous lake valuation studies have been performed. Due to the wide range of valuation methods, characteristics of lakes and value estimates, it is very difficult to assess whether any systematic trends can be distilled from this literature and to shed light on what factors determine a lake's value (Reynaud, 2015) [22] . Diversion of lakes water for use in irrigation, industry, invasion of plants and exotic species are threatening facts on lake ecosystems. In addition, contamination by toxics and nutrients from industry, farm, sewage, and urban runoff are threatens on lakes. Almost, in all of the continents except Antarctica, all the above listed threatens are a common threatens on lake ecosystem ( 2000). In most parts of the world, anthropogenic impacts on lakes are spreading geographically due to human population increment and the globalization of trade (Ayres et al. 1996, French 2000). Conservation of natural and water resources based on amounts that people are willing to pay to protect or increase the resources' services. A typical approach to explain why individuals place values on a natural resource is based on distinguishing between those who use the resource and those who do not (Freeman 1993) [8] . As a result, total economic value is not only use value, but the sum of both use and non-use. Economists developed several techniques for placing monetary values of non-market goods and services. There are various non-market valuation techniques used to estimate the values of environmental resources (Mitchell and Carson, 1989) [19] . One of these techniques is a contingent valuation technique which is applied for this study. The wetland ecosystem of Ethiopia includes twelve drainage systems/basins, over fifteen natural lakes, many swamps, marshes, floodplains, and man-made reservoirs. As a land locked country, Ethiopia lacks wetlands that are associated with coastal areas; otherwise, all wetland types (Ramsar convention 1971) that exist in different parts of the globe also available in the country. Most of the wetlands in the country can be considered as freshwater wetlands. There are abundant lacustrine type of wetlands that include lakes of the Rift Valley (Lakes Ziway, Langano, Awassa, Shalla, etc), Lake Tana, Lake Bishoftu and many other crater lakes and their associated wetlands (Forum for environment, 2007). When we come to the study area, lake is a freshwater lake supporting multitude uses, including irrigation, fishing, water supply and recreation. However, the lake is being degraded primarily because of various land-and water-use activities in its watershed. In order to minimize some threats lake conservation or protection programs are required. To achieving better management of these resources require understanding of the function of the ecosystem. And also it needs sufficient planning, financial resource and community participation. Trying to identify if there exists an unobserved valuation function that determines a lake's value given its physical, economic and geographic characteristics will be the main objective of our paper. Information regarding economic valuation of ecosystems services of these lake is not available or very limited. Therefore, this study will be conducted in order to value the use value of ecosystem services of Dambal Lake. Such studies will be important and lead to improved understanding of the main ecosystems services of this lake and their values and examines the major reasons for its losses.
Objectives of the study
The broad objective of the study will be to investigate the economic value of ecosystems services of Lake Dambal Lake and the possibility of its conservation.
Specific Objective
To examine whether respondent are willing to pay for protection of wetlands of this lake=nigiste To estimate farmers' mean willingness to pay for the conservation of wetlands this lake =erkie To identify factors that affects the maximum willingness to pay for protection of wetlands of this lake =nigste , erkie Technologies such as fish smoking technology was demonstrated at Tullu Gudo under Lake Ziway condition. The lake has high economic importance for its natural resources (such as water, fish, wildlife, etc.), bio-diversity, recreational value and horticultural crops production as it is easily accessible and situated near the main asphalted highway, which is extended from the southern part of the country to Addis Ababa market outlets. The lake exhibits fresh water quality and is an important element of the
Research
Research
Sample size and Sampling Technique
For this study, a multiple stage random sampling technique were used for the selection of representative respondents. In the first stage, Dambal Lake was selected through purposive sampling technique. At the second stage strata sampling were used to select 9 kebeles from each selected water bodies depending on livelihood activities of households of surrounding lake. In third stage, based on lists of households in each strata random sampling of respondent were employed to select sample households.
Simple random sampling was used to select respondents from Lake Dambal Lake. Respondents for this study were residents around Dambal Lake. A representative sample size were estimated using formula of yemane (1967
Where: n = Sample size, N = Population size, e = Level of precision or the error in which the researcher was tolerate.
As the population in the study area is homogenous in many characteristics such as livelihood strategy, cultural and other socioeconomic and institutional setups, the precision level used was 6.45%. Therefore, the sample size was determined to be 237 rural households.
n = =237
Data type, sources and method of collecting data Both primary and secondary data were employed for this study. Primary data was collected from selected households from selected woredas of surrounding Lake Dambal. Primary data was collected using informal and formal surveys. The informal survey employed for this study was PRA technique like Focus group discussion and key informants interviews by using checklists. The formal survey was undertaken through formal interviews with randomly selected households around the selected water bodies using a pre-tested semi-structured questionnaire. Before data collection, the questionnaire was pretested on 20 respondents selected form each lake to evaluate the appropriateness of the design, clarity and interpretation of the questions, relevance of the questions and time taken for an interview. Hence, appropriate modifications and corrections was made on the questionnaire.
Method of Data Analysis
Both descriptive and econometric analysis was employed to infer the data. Descriptive statistics such as mean, standard deviation, percentage, ratios and frequency were used to compare and contrast different categories of sample units with respect to the desired characteristics and contingency valuation method was employed for measuring the total value households head give for lakes management. Ecosystem services which are not traded in markets remain un-priced. The relative economic worth of the functions was estimated using non-market valuation techniques. In order to value the provisioning ecosystem goods and services of Lake Dambal, the study were used estimating Willingness to Pay (WTP) which is part of Contingent Valuation Method (CVM) (Freeman, 2003). CVM is one of the methods which used for valuing ecosystem and CVM is hypothetical market by preparing survey which includes close and open ended questions (Bishop and Heberlein, 1990). The study were used close ended questions by putting bid value or different price for ecosystem services for Lake Dambal. The bid values obtained from pretested questionnaire survey by using open ended questions with giving their prices from household heads and small scale irrigation respondents.
Constructed hypothetical market scenario
In the first part of the CV scenario, detail information about wetland degradation and its consequence were presented by relating with some evidences from Ethiopia and abroad. In addition, information that describes how the wetland would look like if intervention measures could not be undertaken was also presented in detail. After this, as Ndebele et al.
Elicitation method and initial bid sets
Using a series of questions in the DB-DC elicitation method can progressively narrow down households stated amount to their true WTP amount. For this reason, DB-DC elicitation method with follow up question was adopted to estimate mean WTP amount. The initial bids offered can be determined by using information obtained from the pretesting questionnaire using 20 randomly selected households. Therefore, initial bids that give maximum efficiency in estimating mean WTP was obtained by offering an initial bid amount closer to the true mean WTP value (Haab and McConnell 2002) using mean, median and mode of the WTP amount from the open-ended pre-test question. Hence, the initial bids that were equally and randomly allotted to each sampled households were 150, 180, 200 and 245 ETB per year per household.
Econometric Model Specification Mean Willingness to Pay Estimation method
With two binary responses (WTP1 and WTP2), it is impossible to use the conventional probit or logit model to estimate these two equations simultaneously. Thus, seemingly unrelated bivariate probit model, which simultaneously estimate the initial and follow-up bid equations, becomes appropriate. Estimation of mean WTP using such model could lead to a more statistically efficient WTP estimation (Malama 2015) [17] . A study by Signorello (1998) also confirms that, when there is interdependence between the two responses, which is manifested by the significant correlation coefficient (<0.85), seemingly unrelated bivariate probit could be appropriate econometric model to estimate the mean WTP. Therefore, seemingly unrelated bivariate probit was employed to estimate households' mean WTP for the protection of the selected lakes of the study area. There are four possible outcomes in the double bounded dichotomous choice elicitation method with their probability (Hanemann et al 1991). Where, B1, B2 and WTP are initial bid, second bid amount and WTP amount for the follow up question respectively. According to Lemi (2015) [14] , seemingly unrelated bivariate probit model can be specified as follows:
Where, Y1 and Y2 are WTP responses for the first and second equations respectively, B1 and B2 are the bid in the first and second bid questions, α's and β's are parameters to be estimated and 1 and 2 are unobservable random components and correlation coefficient ρ, is the covariance between the errors for the two WTP function. Therefore, the mean WTP was calculated by using the coefficients from the constant term and the bids offered. These coefficients were obtained by regressing the dependent variables (WTP1 and WTP2) on the initial and follow up bid amount holding other explanatory variables constant (Haab and McConnell 2002). Thus, mean WTP was calculated by using the formula:
Where, α is a coefficient for the constant term, β is a coefficient offered bids to the respondents.
Determinants of households' WTP
WTP amount is the final amount that households are willing and able to pay for the proposed conservation/protection intervention. This variable has continuous value for those who are willing to pay and zero for those who are not. To identify the model that best fit, different methods were implemented.
Based on the Likelihood ratio statistics at 11degree of freedom, double hurdle model was selected than Tobit model. Hence, factors that influence the probability of households' WTP and its amount can be determined separately in the double hurdle model.
Therefore, the first decision (first hurdle) was specified using probit model as follows:
Where 𝑊𝑇𝑃𝑖 is a dummy variable that takes the value 1 if the household head is willing to pay for the rehabilitation intervention and zero otherwise; 𝑋𝑖 is a vector of household characteristics and is a vector of parameters.
In the second hurdle, the decision on maximum amount of WTP were specified as follows:
Where Max WTP𝑖 represents the maximum amount that the household are willing to contribute; 𝑋𝑖 is a vector of the individual's characteristics and 𝑜, is a vector of parameters The total aggregate WTP estimates depend on both the benefits per person or household and the number of beneficiaries. The populations that accumulate benefits from the proposed program were those residential that live in near Lake Dambal.
Total revenue=RxM
Where; R is the mean/median amount of WTP and M is the total number of residential or housing units.
Results and Discussion
This chapter deals with the result and discussions of the data which is obtained from the contingent survey. It has two parts. The first part discusses about the descriptive analysis while the second part talks about the econometric analysis.
Descriptive statistics
From the surveyed households 87.76% of them were willing to contribute in favour of the protection intervention, whereas 12.24% of them were not willing for the proposed protection program for various reasons. In this regard, the household's decision to accept or reject the offered bid amount is found to be a function of many demographic, socioeconomic and institutional factors. Hence, the relationship between these factors and households' WTP are presented below.
Demographic and socioeconomic characteristics of sampled respondents
On the other hand, livestock rearing contributes to the rural livelihood next to crop production. The average distance from households' home to the lake Dambal Lake were found to be 10.25 minutes of walk for the households who are willing to pay for the lake conservation. This distance from home to the wetland also varies across willing and non-willing households.
As presented in Table 1 households who were not willing to contribute to the lake conservation are situated at a distance of 15.51 minutes of walk on average. Households, who are WTP for the protection of Dambal lake has less irrigable land around the lake as compared to the unwilling household heads this mean difference in ownership of irrigable land is also statistically significant. It is consistent with the finding of Zhu et al. (2016) households who have more land around the buffer zone of the wetland might discern the intervention negatively due to fear of lose in their irrigable land.
| — | Dambal lake (n=208) | — | — | — | — |
|---|---|---|---|---|---|
| Willing (n= 79) | Unwilling (n=29) | t-value | |||
| Mean | SD | Mean | SD | ||
| Age | 42.7 | 14.33 | 44.71 | 11.25 | 0.27 |
| Educ | 8.94 | 3.11 | 6.89 | 3.56 | 3.92*** |
| HHsize | 5.36 | 3.08 | 8.21 | 4.97 | 0.12 |
| IRLand size | 0.45 | 0.66 | 0.5 | 0.87 | 2.13** |
| Total land | 2.9 | 2.13 | 3.55 | 2.70 | 0.15 |
| Extcontact | 9.18 | 6.3 | 3.81 | 5.97 | 3.57*** |
| TLU | 3.52 | 1.95 | 2.80 | 2.28 | 0.96 |
| Dist | 10.25 | 8.60 | 14.51 | 9.30 | 2.99*** |
Table text extracted from the original PDF; superscript letters are shown inline. The original table image is below.
View original table image
| List of variables | Description of variables | Nature and measurement unit of variables | Hypothesized direc tion of significance |
|---|---|---|---|
| BID | Initial bid amount | Continuous (Birr) | |
| WTP | Willingness to pay | Dummy (1 if yes , 0 otherwise | |
| MWTP | Maximum willingness to pay | Continuous (Birr) | |
| Credit | Credit access (Credit) | Dummy (1 if used, 0 if not) | - |
| Education | Educational status of respondent (Education) | Continuous (Class year) | + |
| Dist | respondents home distance from the lake | Continuous (Kilometer) | Negative |
| Age | Age of household head | Continuous (Number of years) | - |
| Ext contact | Frequency of extension contact (Extension) | Number of visit in a year | Positive |
| HHsize | Household size | Continuous (Man equivalent) | Positive |
| Land size | Irrigable Landholding size of household head (Land size) | Continuous (Hectare) | - |
| TLU | Total livestock owned by household head (Livestock) | Continuous (TLU) | Positive |
| Sex | Sex of household head (Sex) | Dummy (1 if male, 0 if female) | + _ |
| Conservation | Participation in environmental conservation practice | Dummy (1 participated, 0 if not) | Positive |
Table text extracted from the original PDF; superscript letters are shown inline. The original table image is below.
View original table image
In terms of frequency of extension visit, willing households have the chance of frequent extension visit compared to the non-willing households in the study area.
Institutional characteristics of sampled respondens
As indicated in the table 3 below, there was a significant variation in the participation for the selected lake conservation among willing (87.76%) and non-willing (12.24%) households.
| Variables | Category | Lake Dambal (n=237) | — | — | — | — |
|---|---|---|---|---|---|---|
| Willing | % | unwilling | % | X2 value | ||
| Credit | Yes | 118 | 49.8 | 119 | 50.2 | 1.49 |
| No | 89 | 37.5 | 148 | 62.5 | ||
| Sex | Male | 171 | 72.1 | 171 | 72.1 | 1.25 |
| Female | 66 | 27.9 | 0 | 0 | ||
| Conservation | Yes | 189 | 90.86 | 20 | 68.96 | 8.45*** |
| No | 19 | 9.14 | 9 | 31.06 |
Table text extracted from the original PDF; superscript letters are shown inline. The original table image is below.
View original table image
This implies that willing households have better exposure for environmental conservation participation than their non-willing do.
Response patterns for the Double bounded-dichotomous choice
In the double-bounded dichotomous choice elicitation method, the response patterns tending towards the two extremes of "Yes -Yes" and "No -No". As Table 4 shows, majority (31.64%) of the sampled households accept both the initial and follow-up bids. On the other hand, 29.11%) of them reject both bids offered. In between these two extremes, 22.78% and 16.45% of the responses in the DB-DC elicitation method were "Yes-No" and"No-Yes" respectively.
| Possible outcome | Frequency | % |
|---|---|---|
| Yes-Yes | 75 | 31.64 |
| No-No | 69 | 29.11 |
| Yes-No | 54 | 22.78 |
| No-yes | 39 | 16.45 |
Table text extracted from the original PDF; superscript letters are shown inline. The original table image is below.
View original table image
Reasons for rejecting or accepting the offered bids
Respondents' decision to accept or reject the offered bids is dependent on many demographic, environmental, socioeconomic, biophysical and institutional factors. However, households might reject the offered bids either from their disapproval or from genuine behaviour. In this regard, the genuine and protest behaviours were identified by using a welldesigned interview questions. Accordingly, 27.7% of the nonwilling households were protest zero bidders and the remaining were genuine zero. For the genuine zero responses, the main reasons for rejecting the offered bids were financial problem and it should be the NGO`s and government concern. On the other hand, some households protest the payment for protection intervention with the reasons of they are not obtaining benefits. From 237 valid responses, 87.76% of the sampled households were willing to contribute in favour of the proposed protection of the selected lake. These willing households had different motivations to pay for the program. In addition to this, around Lake Dambal respondents, FGD and key informants' interview indicates that most part of this lake is covered by Bofofe tree and Aware grass and it is a good source of cash income for landless youth and surrounding communities. Those individuals sold this grass two times per week with an average of 300ETB per trip.
Estimation of mean willingness to pay
Estimation of mean willingness to pay
Factors affecting households WTP Decision Credit access:
The exceptional result of this study was the negative relationship between credit utilization and WTP decision. This can be interpreted as: being a credit service user decreases the probability of WTP by -34.65% compared to nonusers. In addition to this, the FGD and KII result confirms that due to its higher interest rate and misallocation of the borrowed money, once the households enter into the credit system they could not repay their loan in most cases. Hence, credit user households have lower probability of WTP compared to the non-users.
Distance from home to the wetland (DIST):
As the distance from home to the lake increase by one minute of walk, the probability of willingness to pay in favor of the protection intervention decreases by 0.6% for lake Dambal. Thus, households who are situated far from the wetland are less likely to pay for the rehabilitation of the wetland. This attributes to the fact that those households who are situated at a distance from the wetland might perceived as they are less beneficiary from the wetland compared to the nearest. This result is also in consistent with the findings of Shang et al. (2012).
Frequency of Extension contact (Ext contact):
Extension contact found to have a significant and positive effect on the probability of households' WTP. This can be interpreted as; each additional extension contact by extension agent increases the probability of household's WTP by 5.78% for protection of lake Dambal lake at 5% significance level. The possible reason is that having more extension contact always associated with enhancement in households' awareness regarding the degradation level of the wetland and its consequence. This inspires households to conceive as rehabilitation of the wetland is pertinent to enhance the benefits obtained from it.
Participation in environmental conservation practice (CONSERV):
Households who participate in environmental conservation practices have 15% at 5% probability level for protection of Dambal Lake more probability to be willing to pay compared to those who do not participate. The rationality is that households, who participate in natural resources conservation, become well informed about the advantages of lake conservation. This finding is also consistent with the findings of Lamsal et al. (2015), which affirms that participation in environmental conservation practice determines WTP decision positively.
Irrigable land size around the lake (Land): the results in the table below shows that households with more land around the wetland are less likely to accept the payment for the conservation of the of the Dambal lake. Hence, as households' land size around the Dambal Lake increased by one hectare, the probability of WTP in favour of the protection intervention decreases by 5.2%. This finding indicate that households plough up to the edge of the Lake Dambal illegally when the water retreats every year. However, the perceived risk of loss in their irrigable land during protection program intervention could negatively affect their WTP decision.
Determinants of Households`MWTP
Total Livestock Unit (TLU): livestock holding measured in tropical livestock unit found to have a significant and positive influence on the households' willingness to pay amount for Dambal Lake protection. Thus, holding other factors constant, a one-unit increase in livestock holding in TLU increases the amount that the household could pay by 12 ETB for Dambal lake protection at 1% significance level. The possible reason is that livestock holding is a proxy for household's wealth and serves as a main source of income next to crop production.
Education level of household head: Education level of respondent has expected positively and significantly affect the maximum willingness to pay (MWTP) since highly educated respondents have high understanding and knowledge about environmental conservation and since they have high income than that of lower educated respondents, they are highly willing to pay for the proposed project. The result shows that education level of household head is positively associated to the protection of selected lakes. It has positive and significant effect on the WTP amount for the protection of Dambal Lake at 10% significance level holding all other factors constant. The positive sign indicates that as people get more educated their awareness for resource conservation are improved would also increase amount of WTP for protecting Lake.
Distance: it has a negative and significant effect on the MWTP for the protection of Dambal Lake at 5% significance level by keeping all other factors constant. The result shows that remaining other thing constant if the distance of the respondent increases let us say by one kilometres, the probability of the respondent willingness to pay amount for protection of lake Dambal lake reduces by 12.35ETB.
Age of the household head (AGE):
It has a negative influence on the WTP amount that the households could contribute to the protection of Lake Dambal. Thus, holding the effect of other factors constant, an increase in the age of the household head by one year decreases the amount that the household could pay by 1.25 ETB. Such negative and significant relationship between age of the household head and WTP amount might be associated with lower financial capability of the old aged households compared to the young and the middle-aged households.
Estimating Aggregate Willingness to Pay and Total Revenue
As indicated in in Table 11, the mean WTP estimated from SUR bivariate probit model ranges from 195.53 to 250.71 ETB for the initial and follow-up bids respectively. After excluding expected protest bidders, about 416, 499, 339, 372, 368, 523,325,290,507 and 28337 households are expected to pay for the protection of the selected lakes in , Abay danaba, Walin bula, Herera, Bashira chafa, Giraba qorke, Girisa Maqale, Nagaliny, Bocessa and Edo gojola and ion the study area respectively. Therefore, by using mean WTP amount from the initial bid, the expected aggregate welfare gain from the conservation of the selecte crater lake is about 81340.5, 97569.5, 66284.6, 72737.1, 71955, 102262.1, 63547.2, 56703.7, 99133.7, and 5540733.6 ETB per year for the households in Abay danaba, Walin bula, Herera, Bashira chafa, Giraba qorke, Girisa baqale, Nagaliny, Bocessa and Edogojola and in the study area respectively. Therefore, the aggregated benefit expected from the proposed protection ranges from 5,540,733.6 to 6,352,405.1 per year averagely.
| Selected small administration unit | Total HHs | Sample d HHs | Valid Response | % Protest Zero | Expected pro test bidders | Expected valid Response | Mean WTP | Aggregate WTP |
|---|---|---|---|---|---|---|---|---|
| Abay danaba | 427 | 16 | 16 | 0 | 11 | 416 | 195.53 | 81340.5 |
| Walin bula | 520 | 13 | 13 | 0 | 21 | 499 | 195.53 | 97569.5 |
| Herera | 379 | 12 | 12 | 0 | 40 | 339 | 195.53 | 66284.6 |
| Bashira chafa | 407 | 11 | 11 | 0 | 35 | 372 | 195.53 | 72737.1 |
| Giraba qorke | 385 | 17 | 17 | 0 | 17 | 368 | 195.53 | 71955 |
| Girisa baqale | 542 | 21 | 21 | 0 | 19 | 523 | 195.53 | 102262.1 |
| Hidi= Nagaliny | 350 | 42 | 42 | 0 | 25 | 325 | 195.53 | 63547.2 |
| Qooftuu= Bocessa | 327 | 50 | 50 | 0 | 37 | 290 | 195.53 | 56703.7 |
| 09kebele= Edo gojola | 535 | 55 | 55 | 0 | 28 | 507 | 195.53 | 99133.7 |
| Sampled kebeles | 3872 | 237 | 237 | 0 | 233 | 3639 | 711533.4 | |
| The study area HHS | 30,151 | - | 30,151 | 0 | 1814 | 28,337A | 195.53 | 5540733.6 |
Table text extracted from the original PDF; superscript letters are shown inline. The original table image is below.
View original table image
Conclusion and Recommendation
Majority of the respondents indicated their support towards the conservation of lakes by paying their cash based on their interests. The mean WTP amount that each respondents could pay for the protection of the selected lakes is about 195.53 and 250.71 ETB per year for the initial and follow up bids respectively. In conclusion, the probability and intensity of WTP are mainly determined by the socio-economic and institutional factors than the demographic factors. Thus, for successful conservation of selected lake, policymakers and other concerned parties should consider the following determinants critically. Based on the findings of this study, the following policy implications are suggested. As the result of the study shows, there are different socioeconomic variable that affect the proposed lake protection plan. So, the project planners and any other stakeholders should take in to consideration those significant variables that affect respondents WTP and MWTP responses separately for Lake Dambal.
Acknowledgement
AcknowledgmentI would like to express my sincere gratitude to Oromia Agricultural Research Institute for funding the research work and all staff of Ziway Fish and other aquatic life research center for the facilitating the fund for the research activity. Special thanks goes to all fishermen Administrative and experts of livestock and fishery development offices of East Showa Zone.
Figures and tables from the paper
| Reasons for accepting maximum WTP | Frequency | % |
|---|---|---|
| It is a tourist recreational place and destination | 25 | 12.01 |
| It`s conservation is just our culture | 20 | 9.61 |
| It is the source of my income | 63 | 30.28 |
| It is better if we kept it for future generation | 26 | 12.5 |
| The benefits I derived is greater than the payment | 73 | 35.09 |
Table text extracted from the original PDF; superscript letters are shown inline. The original table image is below.
View original table image
| Reasons for rejection | Frequency | % |
|---|---|---|
| It is the government’s and NGOs concern | 7 | 24.13 |
| I do not have enough income to pay | 13 | 44.82 |
| I am not obtaining benefit from it | 5 | 17.24 |
| I do not have a confidence on the future protection of the lake | 4 | 13.8 |
Table text extracted from the original PDF; superscript letters are shown inline. The original table image is below.
View original table image
| Variable | Coefficient | Std. Err. | T-value |
|---|---|---|---|
| Initial bids | 0.025 | 0.003 | 8.33*** |
| Constant | 1.472 | 0.357 | 4.12*** |
| Second bids | 0.035 | 0.010 | 3.5 |
| Constant | 0.752 | 0.275 | 2.72*** |
| Rho (ρ) | 0.953 | 0.174 | 5.47*** |
| No. of obs | 237 | ||
| Log likelihood | -251.41 | ||
| Wald chi2(2) | 41.00 | ||
| Prob > chi2 | 0.0000 |
Table text extracted from the original PDF; superscript letters are shown inline. The original table image is below.
View original table image
| Variables | Dambal lake | — | — |
|---|---|---|---|
| Coeff | Std. Err | ||
| Age | 0.008 | 0.013 | 0.001 |
| Sex | -0.8513 | 0.6328 | -0.163 |
| Educ | -0.036 | 0.012 | 0.049 |
| Fsize | 0.150* | 0.080 | 0.047 |
| Distance | -0.0798*** | 0.0271 | -0.006 |
Table text extracted from the original PDF; superscript letters are shown inline. The original table image is below.
View original table image
| Variables | Dambal lake | — | — |
|---|---|---|---|
| Coeff | Std. Err | ||
| Age | -2.035** | 0.957 | 1.25 |
| Educ | 0.118* | 0.072 | 0.049 |
| Distance | -0.205** | 0.095 | -12.35 |
| Land | 1.075 | 2.911 | 0.235 |
| Extcontact | 1.990 | 2.890 | 0.780 |
| Conservation | 3.007 | 7.080 | 1.007 |
| TLU | 0.231*** | 0.095 | 12.000 |
| BID1 | -0.588 | 0.487 | -0.455 |
| Const _ | 50.610 | 49.090 | |
| Obs. No=237 | |||
| Loglikelihood= | |||
| Wald chi2 (11) | |||
| Prob > chi2 =0.0002 | |||
| y = Linear prediction = 74.32 |
Table text extracted from the original PDF; superscript letters are shown inline. The original table image is below.
View original table image
References
23 in the original paper- Barbier EB, Acreman MC, Knowler. Economic Valuation of Wetlands: A Guide for Policy Makers and Planners, Ramsar Convention Bureau, Gland, 1997.
- Bochstael Naney, Freeman M. Welfare Theory and Valuation The hand Book Environmental change in North Holland Khalid Abdul (2008). Contingent Valuation Method (CVM). The Regional Training Workshop Economic Valuation of the Goods and Services of Coast Habitats. Samut Songkram Province, Thailand, 2005.
- Costanza R, Fisher B, Mulder K, Liu S, Christopher T. Biodiversity and Ecosystem services: a multi-scale empirical study of the relationship between Species richness and net primary production Ecological Economics, Districts of West Shewa Zone, Ethiopia. Haramaya University, 2007, 61.
- Dixon AB, Wood AP. Local Institutions for Wetland Management in Ethiopia: Sustainability and State Intervention; Centre for Wetlands, Environment and Livelihoods, University of Huddersfield, Huddersfield, UK, 2003.
- Edwards S. (ed.) Ethiopian Environment Review No 1. Forum for Environment, Addis Ababa, 2010.
- Emerton L. Economic Tools for Valuing Wetlands in Eastern Africa. IUCN -The World Conservation Union, Eastern Africa Regional Office, Nairobi, Kenya, 1998.
- Engel S, Pagiola S, Wunder S. Designing Payments for Environmental Services in Theory and Practice-An Overview of the Issues. Ecol. Econ. 2008;65:663-674.
- Freeman M. Measurement of Environmental and Resource Values Theory and Methods. Washington, 1993.
- Haneley N, Spash C. Cost-benefit analysis and the environment, Edward Elgar publishing Ltd, England, 1993.
- Hanemann M. Welfare evaluation in contigent valuation experiments with discrete responses. Agri. Economics. 1989;71(4):1057-1061.
- Hanemann M. Welfare evaluation in contigent valuation experiments with discrete responses. Agri. Economics. 1984;67(3):334-341.
- Hanley, Shogren NF, Janson, White B. Environmental economics in theory and practices. Macmillan press limited, London, 1997.
- IIED. Valuing Forests: A Review of Methods and Applications in Developing Countries. International Institute for Environment and Development of Methods and Applications in Developing Countries. International Institute for Environment and Development Environmental Economics Programme, 3 Endsleigh Street, London WCIH 0DD, UK, 2003.
- Lemi G. Farmers' Willingness to Pay for Improved Forage Seed in LIVES, 2015.
- Leykun Abunie. The distribution and status of Ethiopian wetlands: an overview. Addis Ababa., Ethiopia, 2003.
- Loomis J. Measuring the benefits of removing dams and restoring the Elwha River: results of a contingent valuation survey. Water Resources Research. 1996;32(2):441-447.
- Malama M. Willingness to Pay for Improved Irrigation Water Supply in Zambia, 2015.
- Millennium Ecosystem Assessment (MA). Ecosystems and human well-being synthesis, 2005.
- Mitchell RC, Carson RT. Using surveys to value public goods: The Contingent valuation method. The John Hopkins University press Washington D.C, 1989.
- Perman R, Ma Y, McGillivray J, Common M. Natural Resource and Environmental Economics. Edinburgh, Longman, 3rd edition, 2003.
- Reynaud, FAERE. Valuing Ecosystem Services Provided by Lakes: Insights from a Meta-Analysis, 2015.
- Schuijt K. Land and Water Use of Wetlands in Africa: Economic Values of African Wetlands. Interim Reports on work of the International Institute for Applied Systems Analysis receive only limited review, 2002.
- Whittington Dale. "Improving the Performance of Contingent Valuation studies in Developing Countries". Environmental and Resource Economics, Kluwe Academic publishes printed in the Netherlands, 2002.