
Research article · 2022 · Full text
International Journal of Biology SciencesAssessment of water quality around Odi, Sampou and Agbede Upper Nun River, Bayelsa State Nigeria
Volume 4(1) · Pages 50–54 · DOI: 10.33545/26649926.2022.v4.i1a.54 ↗
Research areasWater Quality and Pollution Assessment
Abstract
Author-writtenAssessment of water physico-chemical parameters of surface water in a section of the Upper Nun River, around Agbere, Sampou and Odi, in Bayelsa State, Nigeria was carried out. Water samples were collected biweekly in triplicates for three months using water sampling bottles. The physicochemical water quality parameters determined in this study includes Salinity, Electrical Conductivity (EC), Total dissolved solids (TDS), Total suspended solids (TSS), Total alkalinity (TA), Total hardness (TH), Turbidity, pH, Chloride (Cl), Sulfate (SO4), Nitrate (NO3), Iron (Fe), Manganese (Mn), Magnesium (Mg), Bicarbonate (HCO3), Calcium (Ca), Sodium (Na) and Potassium (K). Salinity and pH, were measured in-situ while others were analysed in the laboratory. The study used the Completely Randomized Design. A one-way ANOVA was used to show variance between the means at (p
Summary
Source-checkedPlain-language reading of the full paper, prepared with AI and checked against the text. Each point links to the authors' own words.
Why it matters
- Water is essential for the survival of all living organisms. View evidence ↗
- Physicochemical water parameters are critical because they influence how fish migrate and where they are distributed. View evidence ↗
The question
- The study aimed to determine if the physicochemical parameters of the Upper Nun River were within or exceeded permissible limits set by regulatory bodies. View evidence ↗
What they did
- The research assessed surface water quality in the Upper Nun River across three locations in Bayelsa State, Nigeria: Agbere, Sampou, and Odi. View evidence ↗
- Water samples were collected in triplicate every two weeks over a period of three months. View evidence ↗
- Data analysis was performed using a one-way ANOVA to identify significant variances between means at a p < 0.05 level. View evidence ↗
What they found
- The pH values ranged from 6.273 to 6.810, which generally falls within the permissible limits of 6.5 to 8.5. View evidence ↗
- Turbidity levels (18.720–28.360 NTU) significantly exceeded the drinking water permissible limit of 5 NTU, indicating the water is not fit for drinking. View evidence ↗
- Chloride levels (7.33–16.33 mg/l) are safe for human drinking (limit 250 mg/l) but exceed the 1.10 mg/l threshold required to support aquatic life. View evidence ↗
- Magnesium levels (0.923–2.687 mg/l) were found to be higher than the permissible limit of 0.2 mg/l. View evidence ↗
- Iron levels (0.170–0.233 mg/l) remained within the permissible drinking water limit of 0.3 mg/l. View evidence ↗
- Manganese levels (0.010–0.021 mg/l) were below the permissible limit of 0.05 mg/l. View evidence ↗
What it means
- The authors concluded that the water quality is suboptimal because several parameters exceeded permissible limits. View evidence ↗
- The authors recommend finding alternative drinking water sources and implementing better refuse disposal and banning pier toilets. View evidence ↗
Visual summary
3 visualsIllustrations explain the paper; charts are replotted from the paper's own table values.
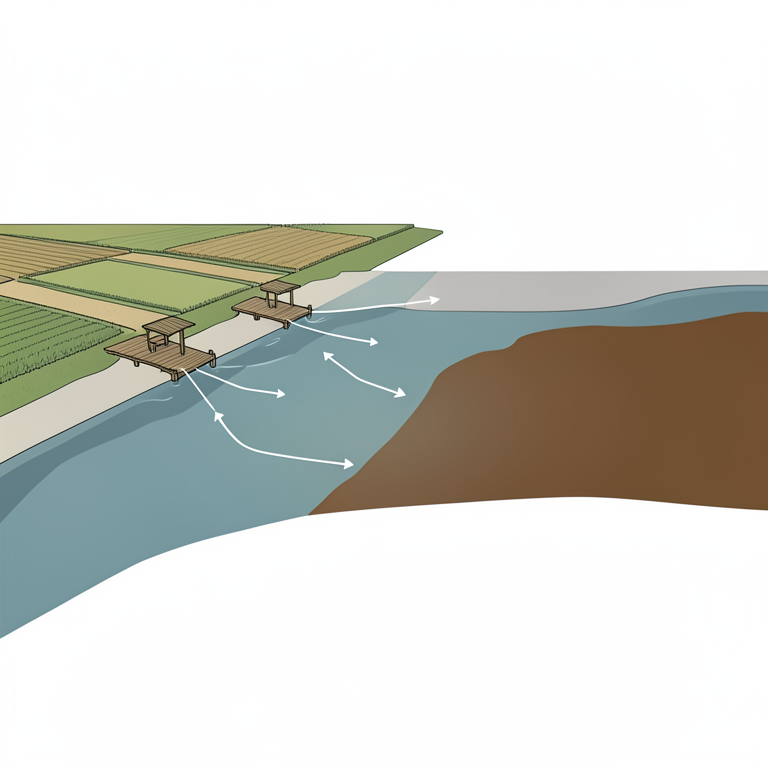
Sources of Contamination and Impact
AI-generated conceptual illustration (The Upper Nun River in Bayelsa State, Nigeria). It explains the idea and does not show study data.
View source evidence ↗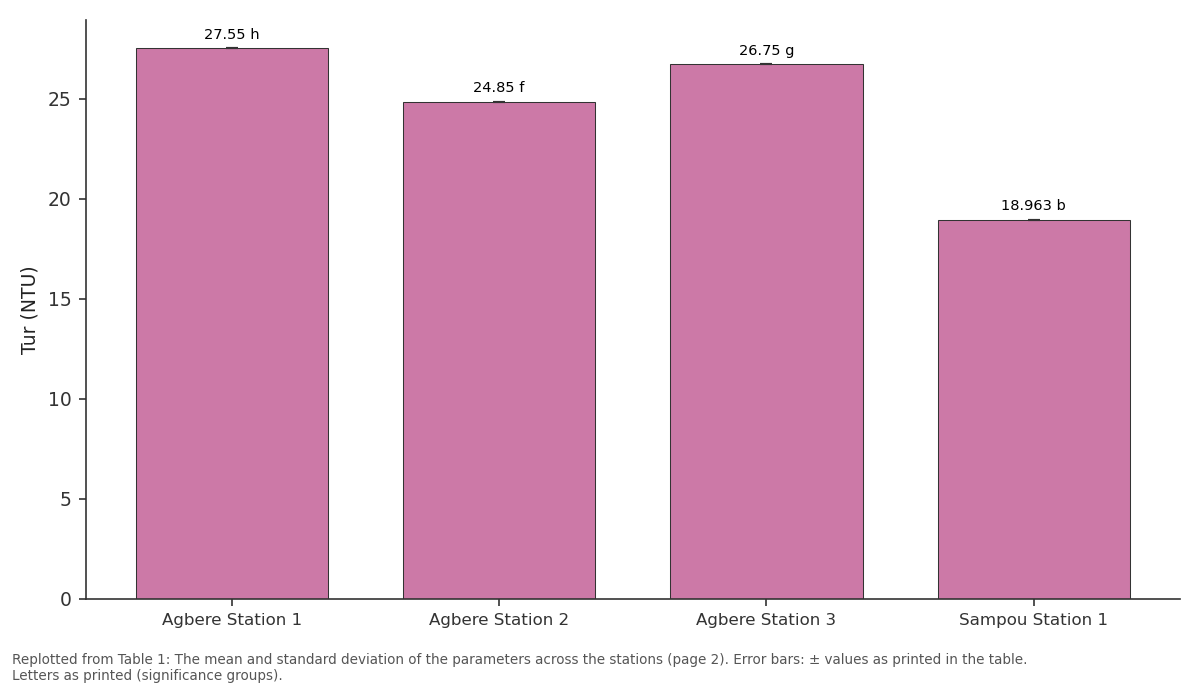
Tur (NTU): Agbere Station 1 vs Agbere Station 2 vs Agbere Station 3 vs Sampou Station 1
Replotted from Table 1 (page 2) of the original paper. Every bar is the paper's own table value.
View source evidence ↗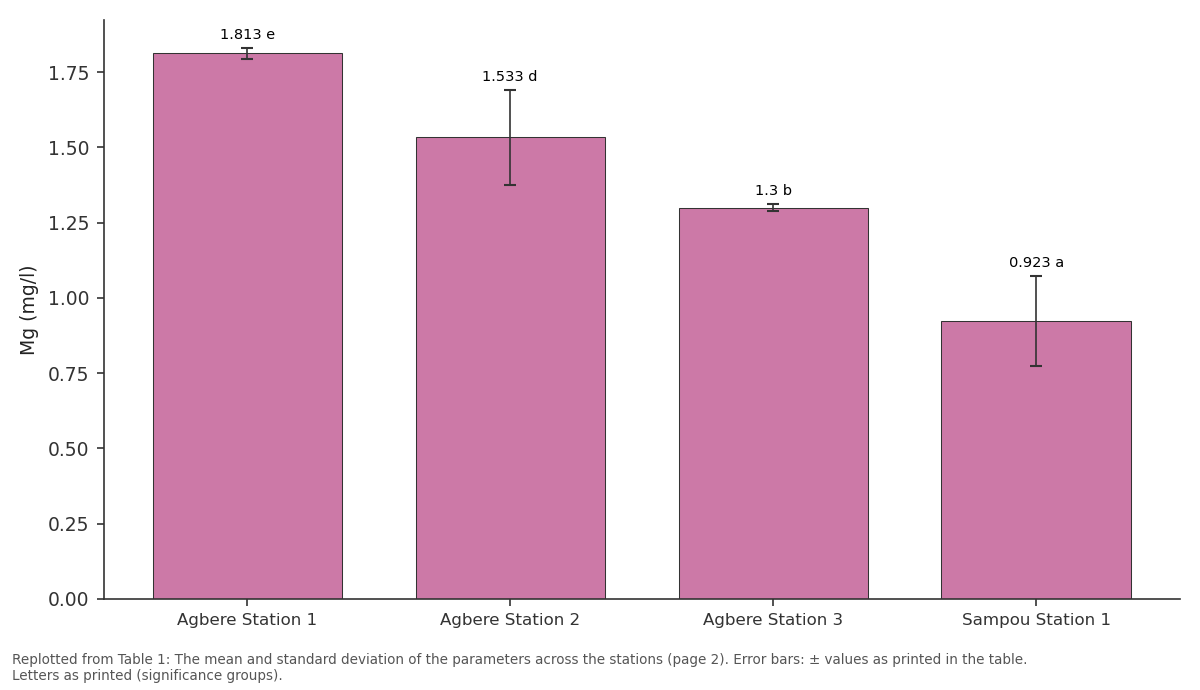
Mg (mg/l): Agbere Station 1 vs Agbere Station 2 vs Agbere Station 3 vs Sampou Station 1
Replotted from Table 1 (page 2) of the original paper. Every bar is the paper's own table value.
View source evidence ↗Figures & tables
From the original paper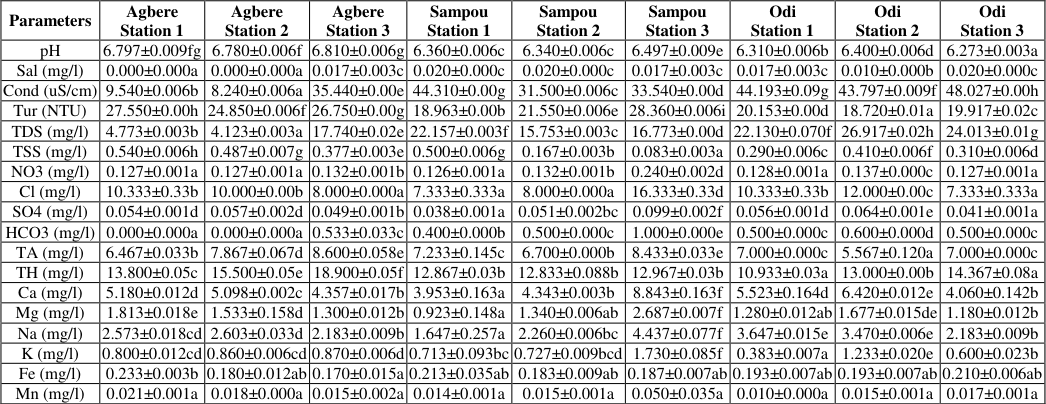 Table 1
Introduction
Water is a vital component to the sustenance of all living organisms (Dirican, 2015, Aghoghovwia et al., 2018) [5] . The physiochemical and biological features of a given water body, determines the productivity of such water (Aghoghovwia et al., 2018) [5] . Most substances that fall on water, quickly settle to bottom sedimentmaking it a probable major pollutant recipient. The anthropogenic activities and other factors in nature, invariably cause contamination of the water column especially the locals who build pie toilets on aquatic mileu (Seiyaboh et al., 2016) [22] . There exists the threat of the contaminants (physiochemical parameter) surpassing their permissible limits and thereby unlashing mayhem to living organisms that abound in the aquatic milieu. Many physiochemical parameters in the water are known to be essential variables that influence fish distribution and migration, (Ama-Abasi and Akpan, 2011) [6] . The monitoring of water quality is therefore expedient in order to ascertain the status of the streams, Rivers ot water bodies especially those that are constantly receiving entry of contaminants due to industrialization and population explosion (Ite et al., 2013; Taiwo et al., 2012; Patil et al., 2012) [24] . Available information of physicochemical characteristics of the upper Nun river around Odi, Sampou and Agbere axis of Bayelsa State, Nigeria are hardly captured in chronograph. The study therefore, assessed the levels of some physicochemical parameters of the Upper Nun River water to know if they are within or above specific permissible limits specified by relevant bodies.
The River Nun is coordinate latitude, 5° 0 1 37.31 1 and longitude 6°17 1 38.58 1 . The river transverses the aforementioned three (3) communities and serve many purposes to the locals. These include fishing, dredging, gravel mining, farming along the River bank, refuse dump site, transportation, laundry among others.
Sampling Techniques
Triplicate water samples were collected at the three different sampling sites.
Sampling Collection
Samples were collected using sterile two (2) litre Mrs capacity labelled plastic bottles with screw cap 30cm depth and taken to the laboratory for analysis (Obasahan and Orosanye 2000).
Analysis procedure Some of the physicochemical properties such as pH, conductivity, Total dissolved solids, Turbidity, Total suspended solids and salinity were analyzed in-situ by means of their respective probes. On the other hand, total hardness, nitrate, alkalinity, bicarbonate, sulphate, calcium, magnesium, sodium, potassium, manganese and iron were analyzed using the methods of Adeoroti (1996) and AHPA (1998).
Statistical analysis
One-way analysis of variance was used to compare the means across the various stations at a level of significance (p<0.05). Spearman's rho correlation was used to determine the relationship between the parameters. The statistical packages for social sciences software version 20 was used for statistical analysis.
Odi
Station 3 pH 6.797±0.009fg 6.780±0.006f 6.810±0.006g 6.360±0.006c 6.340±0.006c 6.497±0.009e 6.310±0.006b 6.400±0.006d 6.273±0.003a Sal (mg/l) 0.000±0.000a 0.000±0.000a 0.017±0.003c 0.020±0.000c 0.020±0.000c 0.017±0.003c 0.017±0.003c 0.010±0.000b 0.020±0.000c Cond (uS/cm) 9.540±0.006b TSS (mg/l) 0.540±0.006h 0.487±0.007g 0.377±0.003e 0.500±0.006g 0.167±0.003b 0.083±0.003a 0.290±0.006c 0.410±0.006f 0.310±0.006d NO3 (mg/l) 0.127±0.001a 0.127±0.001a 0.132±0.001b 0.126±0.001a 0.132±0.001b 0.240±0.002d 0.128±0.001a 0.137±0.000c 0.127±0.001a Cl (mg/l) 10.333±0.33b 10.000±0.00b 8.000±0.000a 7.333±0.333a 8.000±0.000a 16.333±0.33d 10.333±0.33b 12.000±0.00c 7.333±0.333a SO4 (mg/l) 0.054±0.001d 0.057±0.002d 0.049±0.001b 0.038±0.001a 0.051±0.002bc 0.099±0.002f 0.056±0.001d 0.064±0.001e 0.041±0.001a HCO3 (mg/l) 0.000±0.000a 0.000±0.000a 0.533±0.033c 0.400±0.000b 0.500±0.000c 1.000±0.000e 0.500±0.000c 0.600±0.000d 0.500±0.000c TA (mg/l) 6.467±0.033b 7.867±0.067d 8.600±0.058e 7.233±0.145c 6.700±0.000b 8.433±0.033e 7.000±0.000c 5.567±0.120a 7.000±0.000c TH (mg/l) 13.800±0.05c 15.500±0.05e 18.900±0.05f 12.867±0.03b 12.833±0.088b 12.967±0.03b 10.933±0.03a 13.000±0.00b 14.367±0.08a Ca (mg/l) 5.180±0.012d 5.098±0.002c 4.357±0.017b 3.953±0.163a 4.343±0.003b 8.843±0.163f 5.523±0.164d 6.420±0.012e 4.060±0.142b Mg (mg/l) 1.813±0.018e 1.533±0.158d 1.300±0.012b 0.923±0.148a 1.340±0.006ab 2.687±0.007f 1.280±0.012ab 1.677±0.015de 1.180±0.012b Na (mg/l) 2.573±0.018cd 2.603±0.033d 2.183±0.009b 1.647±0.257a 2.260±0.006bc 4.437±0.077f 3.647±0.015e 3.470±0.006e 2.183±0.009b K (mg/l) 0.800±0.012cd 0.860±0.006cd 0.870±0.006d 0.713±0.093bc 0.727±0.009bcd 1.730±0.085f 0.383±0.007a 1.233±0.020e 0.600±0.023b Fe (mg/l) 0.233±0.003b 0.180±0.012ab 0.170±0.015a 0.213±0.035ab 0.183±0.009ab 0.187±0.007ab 0.193±0.007ab 0.193±0.007ab 0.210±0.006ab Mn (mg/l) 0.021±0.001a 0.018±0.000a 0.015±0.002a 0.014±0.001a 0.015±0.001a 0.050±0.035a 0.010±0.000a 0.015±0.001a 0.017±0.001a
Water
Water is vital for the survival of life on earth. The accessibility of water plays a substantial role in the location, and actions of human beings, because growth explosion is placing great demands on natural fresh water resources (Waziri and Ogugbuaja, 2010) [26] . For a given river the water quality depends on so many interrelated parameters with local and temporal variation which are influenced by the water flow during the year (Mandal et al., 2010) [15] . In this study, the water quality parameters are seen to have differed across the various stations, hence the different water qualities at the three locations.
pH
The pH was within the values of 5.80-7.57 recorded in Epie Creek (Ben-Eledo et al., 2017) [12] , and 5.53-6.85 reported by Ogamba et al., (2015b) [17] from Ikoli Creek and also 6.61-7.50 in Kolo Creek (Aghoghovwia and Ohimain, 2014) [4] . But lower than the ranges of 7.19-7.89 and 6.89-7.53 for wet and dry season in Usuma River which Ugwu and Wakawa, (2012) [25] reported. The pH values of this study were similarly lower than ranges of 7.27-7.47 in Oni River (Andem et al., 2012) [8] , ranges of 7.11-7.32 forIgbedi Creek (Seiyaboh et al., 2013b), 7.4 -8.9 recorded in Egbe Reservoir (Edward and Ugwumba, 2010) [14] , 7.3-8.4 in Awba Reservoir which was reported by (Anago et al., 2013) [7] and finally 7.2 in Taylor Creek (Daka et al., 2014) [13] .
However, the value from this study lies within the permissible limit of as 6.5-8.5 given by W.H.O (1984) [27] and NDWQ (SON 2007) [23] .
Salinity
The salinity concentration recorded in this study which lies within the range of 0 -0.020 mg/l is similar to 0.03 mg/l reported for the Nun river at Gbarantoru and Tombia axis (Aghoghovwia et al., 2018) [5] but lower when compared to the range of 0.03 -0.04 mg/l which was reported for Kolo Creek (Aghoghovwia and Ohimain, 2014; Ogamba et al., 2015a) [4] , 0.12 -2.58 mg/l observed in Epie Creek by Ben-Eledo et al., (2017) [12] , but falls within the range of 0.00 -0.050 mg/l reported in the Nun river at Amassoma axis (Agedah et al., 2015; Ogamba et al., 2015c) [2,18] and the Range of 0.01 -0.03 mg/l in Ikoli Creek (Ogamba et al., 2015b) [17] . However, the similarity of the value of salinity across the various stations shows that the water is homogeneous, that is to say, it is freshwater (Ben -Eledo et al., 2017) [12] .
Electrical Conductivity
The Electrical Conductivity of the water samples as reported in this study ranged from [11] . But lower than the value range of 59.70-71.65µS/cm in the Nun River (Aghoghovwia et al., 2018) [5] , 270.35µS/cm -297.56 µS/cm in Ona river which was reported by Andem et al., (2012) [9] , 81.30 µS/cm-299.00 µS/cm for Usuma Dam, and range of 82.30-102.00 µS/cm reported by Aghoghovwia and Ohimain (2014) [4] . The EC value in this study is below the permissible limit for Electrical Conductivity given by (SON 2007) [23] and WHO (1984) [27] as 1000µS/cm.
Turbidity
The Turbidity value reported for the water sample in this study ranged from [2] and Ogamba et al., (2015c) [18] , 27.37-40.5 NTU as was reported by Agedah et al., (2015) [3] and Ogamba et al., (2015c) [18] , 31.29-105.04 NTU which was reported by Ben-Eledo et al., (2017) [12] for Epie Creek, as well as 27.37-40.5 NTU recorded for Kolo Creek (Aghoghovwia and Ohimain 2014) [4] and much lower than the mean value of 58.96 NTU obtained in Taylor Creek, but on the other hand it is similar to the value of 18.52-18.99 NTU recorded by Aghoghovwia et al., (2018) [5] in the Nun river at Gbarantoru and Tombia axis. However, the value range is higher than the permissible limit of 5NTU for drinking water quality given by WHO (1984) [27] and (SON 2007) [23] . This implies that the Nun river at this stations is highly turbid, and is not fit for drinking. This is due to the high rate of farming activities observed across the stations, as well as sand mining and other related anthropogenic activities.
Total dissolved Solids
The TDS range of 4.123 -26.917 mg/l was recorded across the stations and is lower than the value of 29.83.83 mg/l observed in Nun River (Aghoghovwia et al., (2018) [5] , 33.00-546.50 mg/l reported for Epie Creek (Ben-Eledo et al., 2017) [12] , 48.80 mg/l -179.50 mg/l and 168.90 mg/l -465.20 mg/l during dry and wet seasons respectively in Usuma dam (Ugwu and Wakawa, 2012) [25] , 41.45-51.00 mg/l which was reported in Kolo Creek (Aghoghovwia and Ohimain 2014) [5] . Meanwhile the value is above the value of 0.02 mg/l -2.28 mg/l in Egbe Reservoir, reported by Ugwumba (2010) [14] , but it is below the permissible limit of 500 mg/l (SON 2007) [23] and WHO (1984) [27] .
Total Suspended Solids
The TSS range of 0.08 -0.54 mg/l was recorded across the stations, and when compared with previous works, is lower than the range of 1.96-2.13 mg/l in the Nun river at Gbarantoru and Tombia axis, 3.74-10.562 mg/l in Epie Creek by Ben-Eledo et al., (2017) [12] , 3.43-5.47 mg/l (Ogamba et al., 2015c) [18] , 1.75-3.42 mg/l in Kolo Creek (Ogamba et al., 2015a), whereas it is higher than range of 0.05-0.25 mg/l which was recorded by Aghoghovwia and Ohimain (2014) [5] . On the other hand, it is lower than the permissible limit as given by Canadian Drinking Water Quality (1978) is 10.0 mg/l.
Bicarbonate
The Bicarbonate level range of 0.00-1.00 mg/l was recorded across all locations which is within the range of 0.97-1.43 mg/l in the Nun river at Gbarantoru and Tombia axis (Aghoghovwia et al., 2018) [5] , but lower than the range of 2.18-4.28 mg/l in which Ben-Eledo et al., (2017) [12] recorded for Epie Creek.
Sulphate
The Sulfate concentration range of 0.038 -0.099 mg/l was recorded across all stations. In comparison, it is lower than the range of 6.50-14.30 mg/l in Epie Creek (Ben-Eledo et al., 2017) [12] , 1.79-2.53 mg/l by Aghoghovwia et al., (2018) [5] in Nun river at Gbarantoru and Tombia axis, . Nevertheless, the value is lower than 0.57-0.87 mg/l in Amasosoma axis of the Nun river, (Ogamba et al., 2015c) [18] as well as as 0.1-0.57 mg/l in Kolo Creek (Ogamba et al., 2015a). The value is within the permissible limit of 500 mg/l (SON 2007) [23] .
Nitrate-N(NO3)
Nitrate(NO3) is the major form of nitrogen found in naturalwaters and is one of the common pollutants in surface water (Jagessar and Sooknundun, 2011). Its value range in this study was 0.126 -0.24 mg/l. in comparison, this range is lower than 0.63-1.69 mg/l Ben-Eledo et al., (2017) [12] reported in Epie Creek, 0.32-4.15 mg/l recorded by Seiyaboh et al., (2013a) at the Tombia bridge construction area, 0.63-1.69 mg/l in Kolo creek (Agedah et al., 2015; Ogamba et al., 2015c) [3,18] , but similar to 0.18-0.35 mg/l in the Nun river at Gbarantoru and Tombia axis (Aghoghovwia et al., 2018) [5] , 0.10-0.24 mg/l in Kolo Creek (Aghoghovwia and Ohimain, 2014; Ogamba et al., 2015a) [4] , 0.12-0.26 mg/l in Ikoli Creek (Ogamba et al., 2015b). However, the value is with a little margin higher than 0.0.9-0.226 mg/l (Seiyadon et al., 2013b) in Igbedi Creek, but fall within the permissible limit for drinking water but above the limit permitted for aquatic life which are 10.0 mg/l and 0.06 mg/l (WHO, 1984; SON 2007) [27,23] . With respect to nitrates, the water is safe for dinking as increased levels of nitrates often indirectly harm the environment by causing bacterial growth and huge algae blooms (Yanamadala, 2005). Nitrate levels of over 5mg/l indicate man-made pollution and become extreme at 200mg/l (Bellingham, 2012).
Chloride
The Chloride range of 7.33 -16.33 mg/l recorded in this study compares favourably with 11.10-14.33 mg/l documented lower Nun river at Gbarantoru and Tombia axis (Aghoghovwia et al., 2018) [5] , and however higher than 0.36-0.46 mg/l in Igbedi Creek (Seiyaboh et al., 2013b), 1.60-3.40 mg/l in Ikoli Creek (Ogamba et al., 2015b) [17] , 1.257-1.467 mg/l in Kolo Creek (Ogamba et al., 2015a) and 0.50-3.47 mg/l in the Nun river (Ogamba et al., 2015c) [18] . Chloride is non-toxic to humans, although there is a secondary drinking water standard of 250 mg/l above which it can give rise to detectable taste in water, but the threshold depends upon the associated cations (Saxena et al., 2016). It is within the permissible limit of 250 mg/l for drinking water but higher than 1.10 mg/l (2.0 ug/l) (health and welfare Canada, 1979a) for aquatic life. The chloride level in this study does not support aquatic life but safe for drinking with respect to chloride.
Calcium (Ca)
The Calcium values range of 3.953 -8.843 mg/l were recorded which are within the range of 7.05-9.20 mg/l recorded by Aghoghovwia et al., (2018) [5] in the Nun river at Gbarantoru and Tombia axis, but higher than 0.80-2.33 mg/l in the lower Nun river, Amassoma axis (Ogamba et al., 2015c) [18] , 1.107-1.83 mg/l in Kolo Creek (Ogamba et al., 2015a) [17] and 3.78 mg/l recorded for Taylor Creek (Daka et al., 2014) [13] . The permissible limit of calcium of <1000 mg/l was given by WHO (1984) [27] . Although the Calcium level of the study area was within permissible limit, it is high compared to the other values gotten from other recent works. This can be attributed to high cations exchange in the water (Ben-Eledo et al., 2017) [12] .
The level of magnesium obtained range between 0.923 -2.687 mg/l and is within the range of 0.39-14.66 mg/l in the lower Nun river at Amassoma axis (Ogamba et al., 2015c) [18] , 1.92-3.17 mg/l in the lower Nun river at Gbarantoru and Tombia axis (Aghoghovwia et al., 2018) [5] , but higher than 0.37-0.5 mg/l observed in Kolo Creek (Ogamba et al., 2015a) [17] , whereas the Magnesium range of 3.07-10.46 mg/l in Epie Creek (Ben-Eledo et al., 2017) [12] is higher than the level observed in this study area. The magnesium value in this study is higher than the permissible limit of 0.2 mg/l (SON, 2007) [23] .
Sodium (Na)
The level of Sodium recorded span between 1.647 -4.437 mg/l but were however lower than the range of 3.55-4.84 mg/l, 2.27-16.02 mg/l in Epie Creek (Ben-Eledo et al., 2017) [12] , 7.42 mg/l in Taylor Creek (Daka et al., 2014) [13] , but higher than 0.55-1.31 mg/l for the Amassoma axis of the Nun river, 0.58-0.68 mg/l in Kolo Creek (Ogamba et al., 2015a) [17] . However, it is below the permissible limit of 200 mg/l (SON 2007, WHO, 1984) [23,27] .
Potassium (K)
The concentration of Potassium generated ranged from 0.383 -1.730 mg/l which is similar to 1.17-1.38 mg/l in the Nun river at Gbarantoru and Tombia axis, 0.33 -0.82 mg/l in Nun river Amassoma axis (Ogamba et al., 2015c) [18] , but lower than 2.24 -5.26 mg/l in Epie Creek (Ben-Eledo et al., 2017) [12] , and higher than 0.31 -0.36 mg/l documented in Kolo Creek by Ogamba et al., (2015a) [17] .
Iron (Fe)
Iron is one of the most abundant elements in the earth's crust with variable oxidation states of 2 and 3 as in Fe2 + and Fe3 + respectively. The level of Iron ranged between 0.170 -0.233 mg/l and is somehow similar to Fe values of 0.122-0.159 mg/l obtained in the lower Nun river at Gbarantoru and Tombia axis (Aghoghovwia et al., 2018) [5] and 0.137-0.157 mg/l Kolo, Imiringi and Otusega (Ogamba et al., 2017) but is within the permissible limit of 0.3 mg/l for drinking water (WHO, 1984) [27] .
Total Alkalinity
Total alkalinity refers to the total concentration of bases in water expressed as mg/l of equivalent calcium. Total alkalinity concentration computed, were in ranges of 5.57-8.60 mg/l which also fall within the range of 5.50-13.40 mg/l in the lower Nun river at Gbarantoru and Tombia axis (Aghoghovwia et al., 2018) [5] . Values obtained in this study are lower than 19.20 -62.00 mg/l in Epie Creek (Ben-Eledo et al., 2017) [12] , 50.64 -67.61 mg/l in Igbedi Creek (Seiyaboh et al., 2013b), 67.76 mg/l -82.64 mg/l in Egbe reservoir (Edward and Ugwumba, 2010) [14] . However, it is within the permissible limit of 20 mg/l (WHO 1984) [27] . The value of total alkalinity sheds light on the acidity of the water medium (Aghoghovwia et al., 2018) [5] .
Total Hardness
The concentration of Total Hardness of this study ranged between 10.933 -18.90 mg/l and is comparatively lower than 52.86-280.00 mg/l in Epie Creek (Ben-Eledo et al., 2017) [12] , 22.20 -23.30 mg/l in the lower Nun river at Gbarantoru and Tombia axis.Values generated in this experiment are however higher than 0.90 -3.33 mg/l in the lower Nun river at Amassoma axis (Ogamba et al., 2015c) [18] , 1.03 -1.37 mg/l in Kolo Creek (Ogamba et al., 2015a) [17] . There was high level of anthropogenic activities across the various stations, which could have led to the differences in Total hardness across the stations. Nonetheless, Total hardness value is within the permissible limit of 800 mg/l (WHO 1984) [27] .
Manganese
Manganese is essential for normal physiological functioning of humans and animals and exposure to low levels of manganese in the diet is considered nutritionally essential in humans (Mebrahtu and Zebrabruk, 2011). The level of Manganese was found to range from between 0.010 -0.021 mg/l which is higher than the value of 0.017 mg/l recorded for Kolo Creek at Kolo and 0.013 mg/l recorded for both Otusega and Imiringi parts of Kolo Creek (Ogamba et al., 2017). Manganese values in this experiment islower than 0.05 mg/l which is the permissible limit for Manganese given by (SON, 2007) [23] .
Figures and tables from the paper
| Parameters | Agbere Station 1 | Agbere Station 2 | Agbere Station 3 | Sampou Station 1 | Sampou Station 2 | Sampou Station 3 | Odi Station 1 | Odi Station 2 | Odi Station 3 |
|---|---|---|---|---|---|---|---|---|---|
| pH | 6.797±0.009fg | 6.780±0.006f | 6.810±0.006g | 6.360±0.006c | 6.340±0.006c | 6.497±0.009e | 6.310±0.006b | 6.400±0.006d | 6.273±0.003a |
| Sal (mg/l) | 0.000±0.000a | 0.000±0.000a | 0.017±0.003c | 0.020±0.000c | 0.020±0.000c | 0.017±0.003c | 0.017±0.003c | 0.010±0.000b | 0.020±0.000c |
| Cond (uS/cm) | 9.540±0.006b | 8.240±0.006a | 35.440±0.00e | 44.310±0.00g | 31.500±0.006c | 33.540±0.00d | 44.193±0.09g | 43.797±0.009f | 48.027±0.00h |
| Tur (NTU) | 27.550±0.00h | 24.850±0.006f | 26.750±0.00g | 18.963±0.00b | 21.550±0.006e | 28.360±0.006i | 20.153±0.00d | 18.720±0.01a | 19.917±0.02c |
| TDS (mg/l) | 4.773±0.003b | 4.123±0.003a | 17.740±0.02e | 22.157±0.003f | 15.753±0.003c | 16.773±0.00d | 22.130±0.070f | 26.917±0.02h | 24.013±0.01g |
| TSS (mg/l) | 0.540±0.006h | 0.487±0.007g | 0.377±0.003e | 0.500±0.006g | 0.167±0.003b | 0.083±0.003a | 0.290±0.006c | 0.410±0.006f | 0.310±0.006d |
| NO3 (mg/l) | 0.127±0.001a | 0.127±0.001a | 0.132±0.001b | 0.126±0.001a | 0.132±0.001b | 0.240±0.002d | 0.128±0.001a | 0.137±0.000c | 0.127±0.001a |
| Cl (mg/l) | 10.333±0.33b | 10.000±0.00b | 8.000±0.000a | 7.333±0.333a | 8.000±0.000a | 16.333±0.33d | 10.333±0.33b | 12.000±0.00c | 7.333±0.333a |
| SO4 (mg/l) | 0.054±0.001d | 0.057±0.002d | 0.049±0.001b | 0.038±0.001a | 0.051±0.002bc | 0.099±0.002f | 0.056±0.001d | 0.064±0.001e | 0.041±0.001a |
| HCO3 (mg/l) | 0.000±0.000a | 0.000±0.000a | 0.533±0.033c | 0.400±0.000b | 0.500±0.000c | 1.000±0.000e | 0.500±0.000c | 0.600±0.000d | 0.500±0.000c |
| TA (mg/l) | 6.467±0.033b | 7.867±0.067d | 8.600±0.058e | 7.233±0.145c | 6.700±0.000b | 8.433±0.033e | 7.000±0.000c | 5.567±0.120a | 7.000±0.000c |
| TH (mg/l) | 13.800±0.05c | 15.500±0.05e | 18.900±0.05f | 12.867±0.03b | 12.833±0.088b | 12.967±0.03b | 10.933±0.03a | 13.000±0.00b | 14.367±0.08a |
| Ca (mg/l) | 5.180±0.012d | 5.098±0.002c | 4.357±0.017b | 3.953±0.163a | 4.343±0.003b | 8.843±0.163f | 5.523±0.164d | 6.420±0.012e | 4.060±0.142b |
| Mg (mg/l) | 1.813±0.018e | 1.533±0.158d | 1.300±0.012b | 0.923±0.148a | 1.340±0.006ab | 2.687±0.007f | 1.280±0.012ab | 1.677±0.015de | 1.180±0.012b |
| Na (mg/l) | 2.573±0.018cd | 2.603±0.033d | 2.183±0.009b | 1.647±0.257a | 2.260±0.006bc | 4.437±0.077f | 3.647±0.015e | 3.470±0.006e | 2.183±0.009b |
| K (mg/l) | 0.800±0.012cd | 0.860±0.006cd | 0.870±0.006d | 0.713±0.093bc | 0.727±0.009bcd | 1.730±0.085f | 0.383±0.007a | 1.233±0.020e | 0.600±0.023b |
| Fe (mg/l) | 0.233±0.003b | 0.180±0.012ab | 0.170±0.015a | 0.213±0.035ab | 0.183±0.009ab | 0.187±0.007ab | 0.193±0.007ab | 0.193±0.007ab | 0.210±0.006ab |
| Mn (mg/l) | 0.021±0.001a | 0.018±0.000a | 0.015±0.002a | 0.014±0.001a | 0.015±0.001a | 0.050±0.035a | 0.010±0.000a | 0.015±0.001a | 0.017±0.001a |
Table text extracted from the original PDF; superscript letters are shown inline. The original table image is below.
View original table image
References
24 in the original paper- Adeworofi CMA. Standard method for water and Eliment analysis Foludex press Ltd Ibadan, 1998.
- Agedah EC, Ineyougha ER, Izah SC, Orutugu LA. Enumeration of total heterotrophic bacteria and some physico-chemical characteristics of surface water used for drinking sources in Wilberforce Island, Nigeria. Journal of Environmental Treatment. 2015;3(1):28-34.
- Agedah EC, Ineyougha ER, Izah SC, Orutugu LA. Enumeration of total heterotrophic bacteria and some physico-chemical characteristics of surface water used for drinking sources in Wilberforce Island, Nigeria. Journal of Environmental Treatment. 2015;3(1):28-34.
- Aghoghovwia OA, Ohimain EI. Physicochemical characteristics of lower Kolo creek, Otuogidi, Bayelsa state, Nigerian. Journal of Agriculture, Food and Environment. 2014;10(1):23-26.
- Aghoghovwia OA, Miri FA, Izah SC. Impacts of Anthropogenic Activities on Heavy Metal Levels in Surface Water of Nun River around Gbarantoru and Tombia Towns, Bayelsa State, Nigeria, Annals of Ecology and Environmental Science. 2018;2(2):1-8.
- Ama-Abasi D, Akpan ER. Emigration of Juvenile Bonga, Ethmalosa fimbriata from the Cross River estuary, Nigeria. Nig. Journal. Fish. 2011;8(1):220-226.
- Anago IJ, Ejenowo IK, Ugwuaba AAA. The PhyscoChemical and Plankton Diversity of Awba Reservoir, International Journal of Agriculture and Nutrition https://www.biologyjournal.net/ University of Ibadan, Ibadan Nigeria. Research journal of Environmental and earth Science. 2013;5(11):638644.
- Lecepede, 1803) (Chrysichthys, Bagridae) from Itu Head Bridge, Akwa Ibom State, Nigeria. International Journal of Science and Research. 2012;2(9):258-260
- Lecepede, 1803) (Chrysichthys, Bagridae) from Itu Head Bridge, Akwa Ibom State, Nigeria. International Journal of Science and Research. 2012;2(9):258-260
- APHA. Standard method for the Examination of water and Wastewater. 20 th Edition, Amarica Public Health Association. Amarican water works Association and water Environmental Feuation Washington D.C, 1998.
- Aremu MO, Gav BL, Opaluwa OD, Atolaiye BO, Madu PC, Sangari DU. Assessment of physicochemical contaminants in waters and fishes from selected rivers in Nasarawa State, Nigeria. Research Journal of Chemical Science. 2011;1(4):6-17.
- Daka ER, Amakiri-Whyte B, Inyang IR. Surface and groundwater in some oil field communities in the Niger Delta: implications for domestic use and building construction. Research Journal of Environmental and Earth Sciences. 2014;6(2):78-84.
- Edward JB, Ugwumba AAA. Physico-chemical parameters and plankton community of Egbe Reservoir, Ekiti State, Nigeria. Research Journal of Biological Sciences. 2010;5(5):356-367.
- Mandal Upadhyay PR, Hasan A. Seasonal and special variation of Yamuna River water quality in Delhi, India, Environmental modelling and Assessment. 2010;170(1-4):661-670.
- Obasohan EE, Oronsaye JAO, Eguavoen OI. A comparative Assessment of the Heavy Metal Loads in the tissues of a common catfish (Clarias gariepinus) from Ikpoba and Ogba Rivers in Beini city Nigeria. African scientist. 2008;9(1):13-23.
- Pali PN, Sawant DV, Deshmukh RN. Physico-Chemical parameters for testing of water. Department of Engineering Chitrainagari, Kolhapur, Maharashta. 2012;5(3):0976-4402.
- Seher D. Assessment of water quality using Physicochemical parameters of Camligoze Dam Lake in Sivas, Tukey. Department of fisheries Cumhuriyet University. 2015;5(1):1-7.
- Seiyabor EI, Izah SC, Oweibi S. Physico-chemical characteristics of sediment from Sagbama creek, Nigeria. Biotechnology Research. 2017;3:25-28.
- Seiyabor EI, Inyang IR, Izah SC. Spatial variation in physico chemical characteristics of sediment from Epie creek, Bayelsa State, Nigeria. Greener Journal of Environmental management and public safety. 2016;5:100-105.
- SON. Nigerian Standard for Drinking Water Quality. Standard Organization Nigeria, 2007.
- Taiwo AM, Olujimi OO, Bamgbose O, Ande Arowolo TA. Surface water Quality monitoring in Nigeria: Situational analysis and future management strategy. Environmental management and Toxicology, University of Agriculture, Abeokuta Nigeria, 2012. https://www.researchgate.net/publication/224829944.
- Ugwu AI, Wakawa RJ. A study of seasonal physicochemical parameters in River Usuma. American Journal of Environmental Sciences. 2012;8(5):569-576.
- Waziri M, Ogugbuaja VO. Interrelationship between physico-chemical water pollution indicators: A case study of River Yobe-Nigeria. American Journal of Scientific and Industrial Research. 2010;1(1):76-80.
- WHO. International Standard for drinking water 3 rd guidelines for drinking water quality Health criteria and other supporting Information. World Health Organization, 1984, 2.
Cited by 1
From OpenAlex, OpenCitations and reference lists read by Scinovex
- Water Quality Index (NSFWQI) of the River Nun, Bayelsa State, Nigeria ↗
Abinotami W Ebuete, Nato I Puanoni, YARWAMARA IBIM EBUETE, Eluan Ebuete · American Journal of Environment and Climate · 2023
Water remained the second most required and useful natural resource after air; but its usefulness is underscored through quality and quantity among various sources; of all sources of water, surface water occupied 70% of the earth's surface in various forms at a given time in space. Despite the abundance, water quality remained a global burden such that hardly could there…
❝ 2PDF