
Research article · 2022 · Full text
International Journal of Agriculture and Food ScienceDeterminants to decision and intensity of adoption by taro farmers under lowland and upland production systems in Anambra State, Nigeria
Volume 4(2) · Pages 52–62 · DOI: 10.33545/2664844x.2022.v4.i2a.99 ↗
Research areasLivestock and Poultry ManagementAgricultural Innovations and Practices
Abstract
Author-writtenDeterminant factors to adoption and intensity of taro cocoyam production technologies in Anambra State, Nigeria was studied. A well-structured questionnaire and secondary data were used for the study. Multistage sampling techniques were used to select 120 cocoyam producing households. Descriptive statistics (mean, standard deviation and frequency) was used to describe variables under consideration whereas econometric models; probit and Tobit were applied to and identify the factors governing the adoption and intensity respectively of improved cocoyam production technologies. The result of analyses revealed that the determinant factors to adoption of esculentus production technologies were farm income, farm size and farming experience. In addition, the factors affecting the intensity of adoption of improved cocoyam technologies were household size, membership of organization, access to credit and annual income. Therefore, infrastructural development, enhancing farmers’ access to land, providing inputs access, creating financial viability and strengthening farmer’s organization are areas that need policy attentions.
Summary
Source-checkedPlain-language reading of the full paper, prepared with AI and checked against the text. Each point links to the authors' own words.
Why it matters
- Taro (Colocasia esculenta) is a critical staple food for over 400 million people in tropical and sub-tropical regions, and it can be grown in both upland and lowland systems, though lowland systems typically yield more. View evidence ↗
- Nigeria is a global leader in taro production; in 2014, it produced 3,273,000 metric tons, representing about 32% of the world's total output. View evidence ↗
- Despite its importance, taro's potential is under-exploited because farmers have not fully adopted improved production technologies needed to overcome constraints like pests, diseases, and poor soil fertility. View evidence ↗
The question
- The study aims to identify the factors that drive or inhibit the adoption of improved taro technologies and to determine the extent of this adoption among farmers in the study area. View evidence ↗
What they did
- The researchers used a probit model to analyze the decision to adopt the technology and a Tobit model to analyze the intensity of that adoption. View evidence ↗
- Adoption intensity was measured as the ratio of the area allocated to improved taro varieties relative to the total area used for all cocoyam production. View evidence ↗
What they found
- The average intensity of improved taro adoption was 45.6% for upland farmers and 42.1% for lowland farmers. View evidence ↗
- Increasing age had a significant negative effect on the decision to adopt taro technology in both upland and lowland systems, suggesting older farmers are less willing to change their practices. View evidence ↗
- Higher educational levels significantly increased the likelihood of farmers deciding to adopt improved taro technologies in both production systems. View evidence ↗
- Farm size influenced adoption differently: larger farms increased the likelihood of adoption for upland farmers but decreased it for lowland farmers. View evidence ↗
- Membership in organizations like cooperatives significantly increased adoption intensity, raising it by 44.3% for upland farmers and 65.2% for lowland farmers. View evidence ↗
- Larger household sizes positively influenced adoption intensity in both systems; adding one member of labor age increased adoption intensity by 27.1%. View evidence ↗
- Access to credit increased adoption intensity by 25.64% for upland farmers, but had a negative relationship for lowland farmers, where decreased access led to a 19.89% decrease in adoption intensity. View evidence ↗
- Each additional year of farming experience increased adoption intensity by 23.9% for upland farmers and 13.8% for lowland farmers. View evidence ↗
What it means
- The authors conclude that adoption decisions are primarily driven by farm income, size, and experience, while the intensity of use is driven by household size, organization membership, credit, and annual income. View evidence ↗
- The authors recommend that the government provide low-interest loans and encourage farmers to join cooperatives to improve access to subsidized inputs. View evidence ↗
Visual summary
2 visualsIllustrations explain the paper; charts are replotted from the paper's own table values.
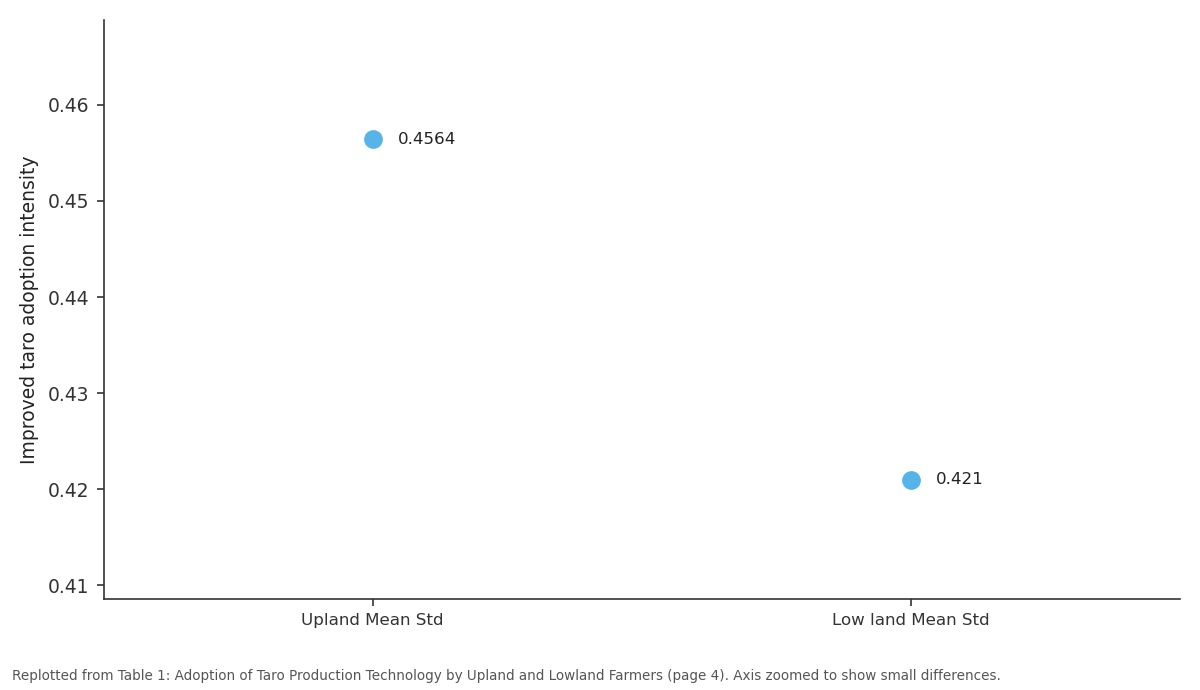
Improved taro adoption intensity: Upland Mean Std vs Low land Mean Std
Replotted from Table 1 (page 4) of the original paper. Every bar is the paper's own table value.
View source evidence ↗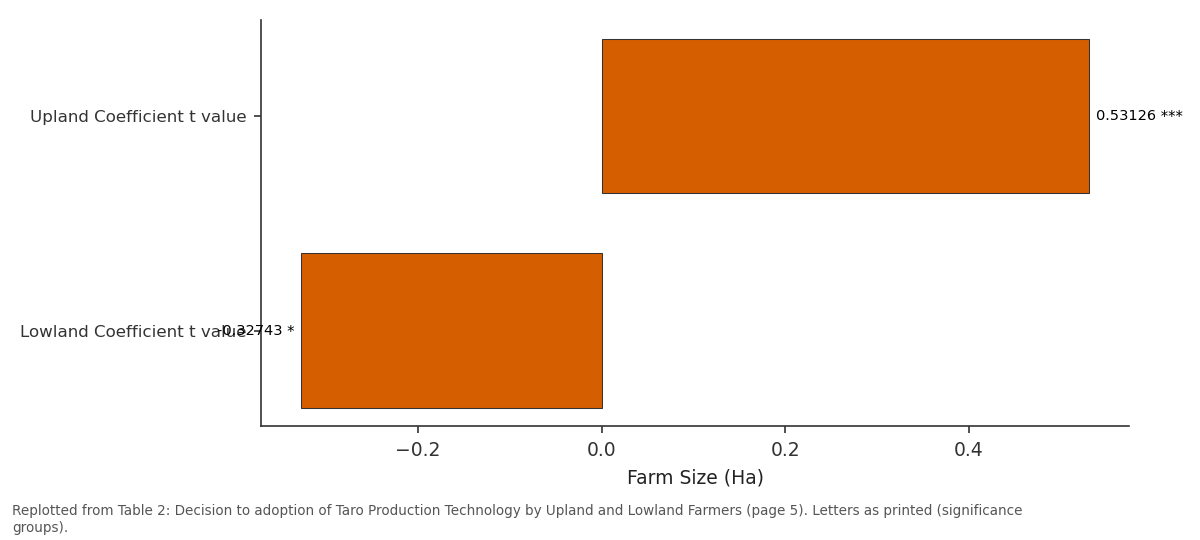
Farm Size (Ha): Upland Coefficient t... vs Lowland Coefficient t...
Replotted from Table 2 (page 5) of the original paper. Every bar is the paper's own table value.
View source evidence ↗Figures & tables
From the original paper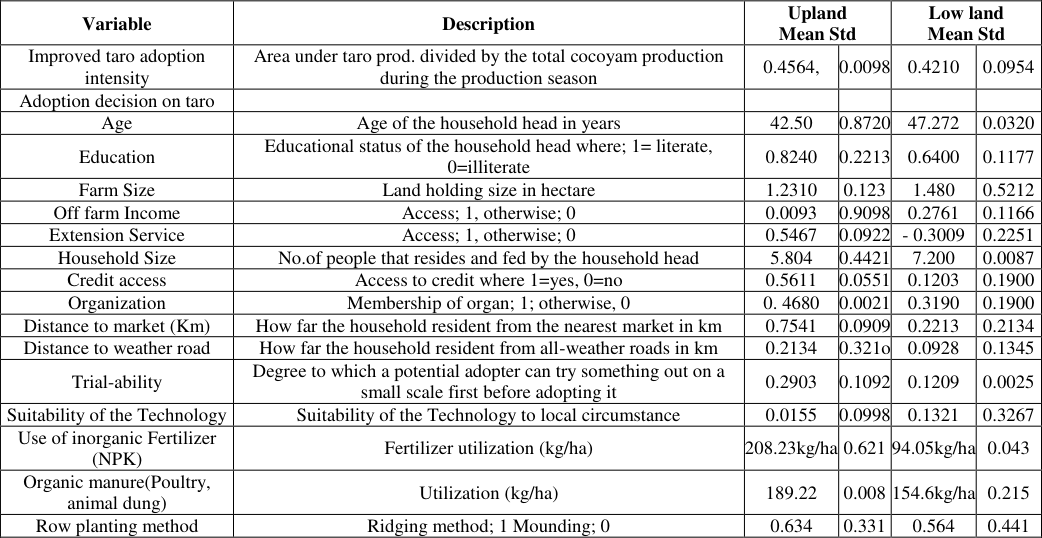 Table 1
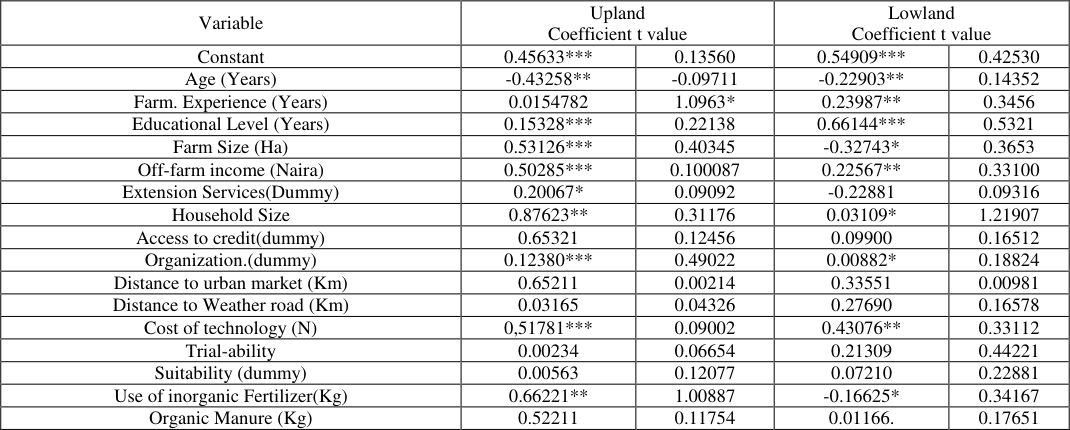 Table 2
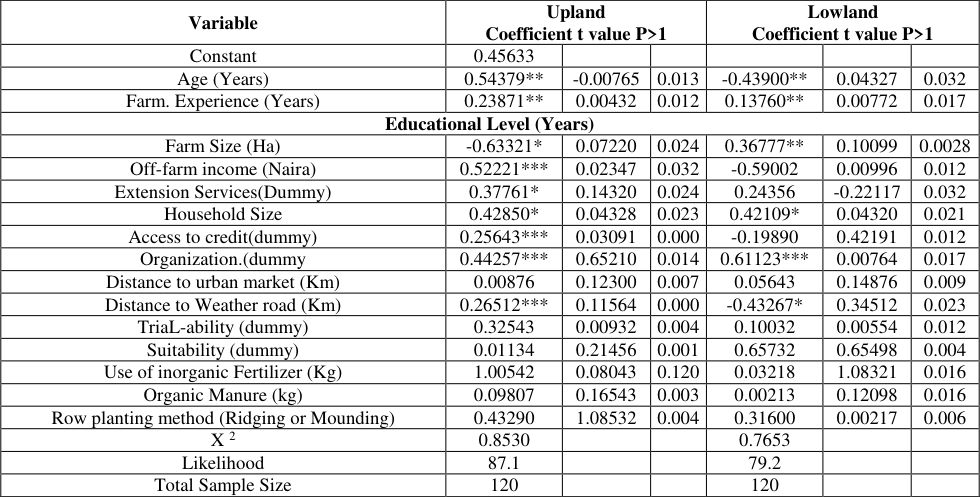 Table 3
Introduction
Taro belongs to the genus Colocasia, within the sub-family Colocasioideae of the monocotyledonous family Araceae (Ekwe, Nwosu and Ekwe, 2007) [8] . Colocasia esculenta, is native to Southeast Asia and Southern India, but today cultivated to other parts of the world (Food Agriculture Organization, (FAO), 2014) [13] . Globally, several numbers of agronomic cultivars of Taro groups exist, distinguished by their corms, cormels (shoot) characteristics, agronomic characteristics and culinary behavior (Okwuowulu, 2000) [29] . There are at least two groups of colocasia esculentum with Eddoes (Colocasia esculenta (L.) Schott var. antiquorum (Schott) and Dashen (Colocasia esculenta (L.) Schott var. esculenta ;) being the most popular, Okwuowulu maintained.Onwueme, reported that the Eddoes type has features of having small corm and large cormel, whilst Dasheen type possesses large corm and small cormels. Nutritionally, cocoyam generally supersedes all roots and tubers, as it comprises of 70-80% water, 20-25% starch and 15-30% protein (Enyinnaya, 1992) [9] . Taro (Colocasia) is a good source of potassium. The leaves of Taro when cooked is eaten as vegetable. It contains "β-main corm or rhizome or the small lateral tubers. According to FAOSTAT (2014) [13] , in 2014, Nigeria was the largest world produced of taro with output of 3,273,000 metric tons, which accounts for approximately 32% of the world share, followed by China, Cameroon, Ghana etc with their productions and cultivated areas statistics Cocoyam production generally in Nigeria is ranked third after staple root and tuber crops like yam, cassava and sweet potato in terms of importance, total output and production area (Dimelu, Okoye and Okoye 2009) [27] . The South South, middle belt, South East and South West agro-ecological zones of the country formed the bulk produced of the crop. Despite economic importance of cocoyam, it's potentials has not only been overlooked but also under exploited as relevant production technologies basically to surmount the farmers production constraints(underutilization and over utilization of farm inputs, unreliable distribution of rainfall, drought, pest and diseases infections, poor agricultural practices and equipment and poor soil fertility) in bid to boost their income and welfare are either not or fully adopted( Ekwe, Nwosu and Ekwe, 2007) [8] . In Nigeria, with courtesy of National Root Crop Research Institute (NRCRI) and International Institute Tropical Africa (IITA),developed production recommendation aimed at boosting cocoyam production through adoption of the technologies, The technologies included appropriate pesticide application, timely weeding, pests and diseases control, plant geometry, quality of planting material, fertilizer applications, timely harvest, adequate tillage and mounding/ridging (Udensi, Tarawali and Favour, 2011, Okwuowulu, 2000) [39,29] . Adoption of the improved technologies offers a innumerable prospective gains for enhancing productivity, thus leading to poverty alleviation and enhancing food security, lowering per unit costs of production, boosting rural incomes and reducing hunger In addition, Improved agricultural technology adoption has the potential to deepen the market share of agricultural output through which the smallholder farmers' resource use and output diversification decisions could be guided increasingly by their objective of profit maximization. Thus, leading to an emphasis on the importance of purchased inputs and a reduction in the use of non-traded inputs-boosting the growth of specialized commercial farming units. To fully tap the potentials of the technology, there is need to according to Okoye, Okoye and Okoroa for, (2009) [27] and Hagos, Ndemo and Yosuf (2018) [18] unveil push and pull factors which inspire or dispirit the taro farming households to practice improved technologies. Literatures show that researchers are using myriads of models to analyze clients' characteristics and the factors affecting the technology adoption of technologies (Challa, 2013, Onyeneke, 2017) [6,34] , whereas others examine the characteristics of technology and its effect on technology adoption (Ex Dixon, J, Nalley, Kosina, La Rovere, Hellin, and Aquino, 2015; Food Agricultural Organisation (FAO), 2014) [13] . However, many scholars merged the clients, technology characteristics and institutional factors (Diiro, 2013; Hagos, Demo and Yosuf, 2018; Grabowski, Kerr, Haggblade and Kabwe (2016) [7,18,17] to comprehend the drivers of adoption and what factors determine its rate of diffusion and the path it follows. Infact, understanding the adoption of technologies and the drivers at farmers and institutional levels in developing economy in particular and developed countries to less extent is posing series of problems to researchers, programme planners and policy makers. Thus, this study focuses specifically to identify the drivers and inhibitors for improved taro cocoyam adoption and the extent by the producers in study area.
Materials and Methods
The Study Area Anambra State of Nigeria is the study area and it is located between latitude 5 0 38' and 6047'E of equator and longitude 6 0 36'-7 0 [22] and land area of 248Km 2. The State has annual rainfall range of 1600mm -1700 mm with mean temperature of 27 o c. Anambra state is divided into four agricultural zones (Awka, Anambra, Onitsha and Aguata), is agrarian and engages in other economic activities such as hunting, vulcanizing, mechanic, petty trading and barbering.
Sampling Procedure and Sample Size.
Purposive and multi-stage random sampling techniques were used to select zones, blocks, cycles and respondents. In the first stage, three Agricultural zones were purposively selected from four zones because of intensity of esculentum production in the zones. The selected zones were Onitsha, Awka and Aguata zones. In the second stage, two blocks were randomly selected from each of the selected zones. This brought to a total of six blocks. In the third stage, ten circles were randomly selected from each of the six blocks, making a total of sixty circles. Finally, four farmers from the lists of farmers provided by the extension agents covering the area and the local leader from each of the sixty circles. These brought to a total of two hundred and forty (One hundred and twenty each from upland and swamp farmers respectively) for detailed studies
Method of Data Analysis
Percentage responses, mean and standard deviation were employed to describe the socioeconomic profiles of the respondents, Probit and to bit model analyses were used to identify factors affecting the decision to adoption and intensity of adoption of improved taro cocoyam in study area. Dependent variable is improved taro adoption intensity which is measured as an area allocated for improved taro to the total area allocated for cocoyam production.
It was specified as: Taro adoption intensity = Area covered by the variety/ total area covered by both variety and other varieties in hectare for upland and swamp farmers Improved SPSS version 21 was used for data entry and management whereas STATA-12 was used for data analysis both descriptive and econometric analysis. X1,= Age of the farmer in years, X2 =Farming Experience in years, X1 = Educational Level in years, X4 = Extension services (dummy), X5 = Farm size(Hectare), X6 = Access to credit (dummy), X7= Organization (dummy), X8 =Distance to urban market(Km), X9 = Distance to weather road (Km), X10 = Cost of technology (N), X11, = Technology trialability(dummy), X12 = Suitability (dummy), X13 = Use of inorganic fertilizer(kg), X14 =Use of inorganic manure(Kg) Model Specification
Probit regression
The probit regression model was used to analyse the decision to adopt cocoyam technology by the rural households in the study area. The probit model which is based on the cumulative probability function was adopted because of its ability to deal with a dichotomous dependent variable and a well-established theoretical background. Probit regression, according to ExDixon, Nalley, Kosina, La Rovere, Hallin and Aquino, (2015) [12] is a uni/multivariate technique which allows for estimating the probability that an event will occur or not through prediction of a binary dependent outcome from a set of independent variables. The model is specified following the decision to adopt taro cocoyam technology.
A household -level regression model is estimated thus:
Where Yi is the dummy variable for house hold adoption status (1= adopter; 0=Non-adopter). Xk and Xi are vectors of exogenous variables influencing households' adoption status. Also, bk and bi are vectors of parameters to be estimated, ui is a zero-mean error term, and f (.) is a probit or logit function. Studies show that t in most applications, both probit and lo git models are quite similar. The main dissimilarity however, is that the conditional probability Pi approaches zero or one at a slower rate in logit than in probit. He concludes that there is no compelling reason to choose one over the other, and in practice, the choice depends on the ease of computation, which is not a serious problem with sophisticated statistical packages that are now readily available. The model estimates are in 0-1 range and these probabilities are non-linearly related to the explanatory variables. In this paper, the probit model is employed to estimate the parameters of the model. Variables included in the model are presented as Follows Y=Apotion status of the household (1 = adopter, 0 if otherwise)
Explanatory variable
Explanatory variable
To bit analysis Explanation on to bit
In a Probit model, y* is the variable of theoretical concern which is unobserved, while, y is Observed, a dummy variable which takes on a value of 1 if yi* is greater than 0, and 0 if otherwise. In the other hand, Spelt, et. al. [1994] developed what became recognized as the Two bit (Tobin's probit) or censored normal regression model for circumstances in which y is observed for values greater than 0 but is not observed (that is censored) for values of zero or less.
The standard to bit model is defined as (8) Where yl* is the underlying reliant variable, yi is the observed dependent variable, xi is The vector of the independent variables, â is the vector of coefficients, and the i's are Presumed to be independently normally distributed: åi ~ N (0, ó2) (and therefore yl ~ N (Xie, ó2)
It should be noted that observed 0's on the dependent Because y* is normally distributed (as the a's are normally distributed), f (.) and F (.), and, hence, the log -likelihood function, may be reexpressed in terms of the density function and the cumulative density function of the standard normal distribution, (.) and Ô (.), and the log-likelihood function can be represented in the conversant form: (10) Maximum likelihood estimation can then proceed in the usual fashion.2 To interpret the estimation results, the Marginal Effects (ME) of the independent variables on some conditional mean functions should be examined. In the familiar OLS model y = ax + å, there is only one conditional mean function, E (y) = ax, and E (y)/ xk = âk, where xk is the kth independent variable. This makes interpretation easy: âk measures the marginal effect on y of the kth independent variable. In the Tobit model, though, there are three different conditional means: those of the latent variable y*, the observed dependent variable y, and the uncensored observed dependent variable y / y> 0. Therefore, understaninterpretation is influenced by whether one is concerned with the marginal effect of x on y*, y, or y / y> 0. Once the marginal effect that is of concern is estimated, then the marginal effects of x on the suitable conditional expectations are observed. The three marginal effect expressions are arrived at by employing standard results on moments of truncated/censored normal distributions and according to Maddalas, (1983) [44] is as follows: (11) (12) (13) Where
Clearly, only for the latent index y* can â be interpreted as the marginal effects of the independent variables. To reiterate, the standard Tobit model assumes, among other things, that the dependent variable is censored at zero. If no censoring has occurred or if censoring has occurred but not at zero, then the standard to bit specification is inappropriate. For example, Mabawonku and Olomola clearly warned against using the Two bit model 2 the model is described in most econometrics texts e.g. Green (1997) [16] . The purpose here is to highlight its most essential aspects. Equation ( 5) can be decomposed into two parts for ease of interpretation (Mc Donald and Moffit 1980) [47] . Roncek (1992) [48] provides an example.4 There can be cases in which the mean of the latent y* is of central interest, but when the data are censored the mean of the observed y is usually of greater interest. When no censoring has occurred. One might, for example, consider using a to bit model to study lending decisions in agricultural institutions. In a situation where the institution decides on how much it prefers or wishes to give an applicant then the data. Configuration can be modelled via to bit, for the lending institution might wish that it could make a "negative response" to an unworthy candidate by not giving him any amount. In that case the underlying propensity to lend to a particular candidate can be imagined to include negative as well as positive values, with no representing a censored negative observation.
Results and Discussion
Table 1. Variables description and their descriptive statistics. The summary of the socio-economic characteristics of the taro farmers are shown in Table 1. In the study area an average age of farmers in the upland and lowland production systems were about 42.5 and 47.27 years with respondents ages range from 25-82 years and 26-78 years for upland and lowland producers respectively. This implies the majority of smallholder farmer's ages are in the category of active labour forces. Also, the average household size was about 5.8 and 7.2 for upland and lowland producers respectively with upland farmers having a minimum of 4 and maximum of 10 members, while 3 and 7 members for lowland producers. Studies (Rogers, 2003, Nkematu, Obinabo and Uzoka, 2003 and Ojiako, 2011) [26,36] show that large household size is proxy to family labour especially during the peak of farming season when labour is scarce and expensive. Furthermore, majority of the taro farmers in the study area were literate, accounting for 82.4% and 64% for upland and lowland producers respectively. Education as reported by Ume, Adeoye -Agomohand Achebe, (2020) catalyzes the process of information flow and exposes the farmer to assorted probable alleyways of gathering information patterning to a technology. The more access to information pathways the farmer could garner, the more the farmer intensifies adoption of taro variety. Therefore, literatures as inferred by Ojo and Oguyemi, (2014). That innovation adoption and diffusion have long documented information as a vital variable, and its accessibility is usually found to be linked with adoption More so, 46.8% and 31.9% of producer of taro in upland and lowland respectively were members of organization, such as cooperative society, young farmers' club, etc.
| Variable | Description | Upland Mean Std | — | Low land Mean Std | — |
|---|---|---|---|---|---|
| Improved taro adoption intensity | Area under taro prod. divided by the total cocoyam production during the production season | 0.4564, | 0.0098 | 0.4210 | 0.0954 |
| Adoption decision on taro | |||||
| Age | Age of the household head in years | 42.50 | 0.8720 | 47.272 | 0.0320 |
| Education | Educational status of the household head where; 1= literate, 0=illiterate | 0.8240 | 0.2213 | 0.6400 | 0.1177 |
| Farm Size | Land holding size in hectare | 1.2310 | 0.123 | 1.480 | 0.5212 |
| Off farm Income | Access; 1, otherwise; 0 | 0.0093 | 0.9098 | 0.2761 | 0.1166 |
| Extension Service | Access; 1, otherwise; 0 | 0.5467 | 0.0922 | - 0.3009 | 0.2251 |
| Household Size | No.of people that resides and fed by the household head | 5.804 | 0.4421 | 7.200 | 0.0087 |
| Credit access | Access to credit where 1=yes, 0=no | 0.5611 | 0.0551 | 0.1203 | 0.1900 |
| Organization | Membership of organ; 1; otherwise, 0 | 0. 4680 | 0.0021 | 0.3190 | 0.1900 |
| Distance to market (Km) | How far the household resident from the nearest market in km | 0.7541 | 0.0909 | 0.2213 | 0.2134 |
| Distance to weather road | How far the household resident from all-weather roads in km | 0.2134 | 0.321o | 0.0928 | 0.1345 |
| Trial-ability | Degree to which a potential adopter can try something out on a small scale first before adopting it | 0.2903 | 0.1092 | 0.1209 | 0.0025 |
| Suitability of the Technology | Suitability of the Technology to local circumstance | 0.0155 | 0.0998 | 0.1321 | 0.3267 |
| Use of inorganic Fertilizer (NPK) | Fertilizer utilization (kg/ha) | 208.23kg/ha | 0.621 | 94.05kg/ha | 0.043 |
| Organic manure(Poultry, animal dung) | Utilization (kg/ha) | 189.22 | 0.008 | 154.6kg/ha | 0.215 |
| Row planting method | Ridging method; 1 Mounding; 0 | 0.634 | 0.331 | 0.564 | 0.441 |
Table text extracted from the original PDF; superscript letters are shown inline. The original table image is below.
View original table image
Members of cooperative through cross exchanging of ideas could help to enhance their adoption decision (Eke, et al, 2007) [8] . Furthermore, the average farm size of the taro farmers were about 1.23 and 1.48 hectares for the upland and lowland respectively. The upland producers had minimum and maximum farm size of 0.15 and 14 hectares, lowland had 0.08 and 10 for minimum and maximum respectively. Small farm size, for instance may perhaps aid as encouragement to adopt a technology especially in the case of an input-intensive innovation such as a laborintensive or land-saving technology, such as greenhouse technology, zero grazing etc as a substitute to better farm ou put (Onyeneke, 2017) [34] . As well, 54.7% of the farmers in the upland had access to extension services, whilst, the lowland producers had sparsely contact with extension services, indicated by the negative sign of the coefficient as shown in Table 1. Extension agent as opined by Hagos, Ndemo and Yosuf (2018) [18] acts as a link between the innovators (Researchers) of the technology and users of that technology.
Additionally, 56.15% of the taro producers in upland had access to credit either from formal or informal or both, just like 35.5% of the counterpart in lowland area. Access to credit as reported by Challa, (2013) [6] stimulates the adoption of risky technologies through easing of the liquidity restriction as well as through the furthering of household's-risk demeanor aptitude. In addition, on average, the intensity of taro adoption by upland taro producers was 0.4564, implying that out of the total area devoted to cocoyam production about 45.6% of the area was covered by taro varieties. Whereas for the lowland, the average intensity of adoption was 0.4210, connoting that 42.1% of the land used for cocoyam production in the area was devoted for taro production. The average amount of inorganic fertilizers applied for taro production used by upland and lowland farmers was 208.54kg/ha and 94.05kg/ha respectively. For organic manure, 189.22 and 154.6kg/ha were used for upland and lowland respectively. This indicates that fertilizers use by smallholder farmers in the study area was far below national recommendation rate for both inorganic fertilizer (450kg/ha) and organic manure (1000kg/ha). Organic fertilizer (such as poultry, pig and cow dung) aids in Improving soil structure and water holding capacity; impacts on crop yield. Though, potential environmental liability, if it (organic fertilizer) is misused (FAO, 2014) [13] . About 63.4% and 56.4% of the households plant taro with row planting in ridging or mounds for upland and lowland respectively. In areas at risk from flooding, soil should be ridged before planting. However, although fresh root yields in ridged and un-ridged plantings in short term experiments are not consistently different, it is generally accepted that ridging is beneficial in these types of environments (Ezedinma, 2004) [11] . The decision to adopt taro technology by upland and lowland Farmers as shown in The coefficient of age of the farmer had a negative and significant effect on the decision to adopt taro technology in the two production systems, which agrees with a priori expectation. This implies that at increasing age, the adoption of technology decreases. Ageing farmers are usually less willing to change the status quo, more risk averse and decreased long-term investment in the farm, leading to low productivity as well as low technology adoption. This finding is in consonance with the finding of Arego (2009). However, Onyenweaku, Okoye, Okorie, (2010) [33] in their study of adoption of fertilizer by farmers in Bende Local Government Area of Abia State, Nigeria found positive relationship between farmers' age and technology adoption.
They opined that the sign identity of the variable factor could be considered to stem from acquired knowledge and experience of the farmers from years of observations and experimenting with various technologies. Furthermore, Chukwu, (2015) [49] observed that older farmers are often an embodiment of experience, resources and authority, thus have higher propensity of trying a new technology. Additionally, similar to a priori expectation, farming experience had a positive and significant effect on the adoption of innovations as related to taro production in upland and lowland farmers in the study area. This implies that the tendency to adopt any innovation increases as experience in farming measured by the number of years put into farming activities increases. This finding gave credence to statement by Adepogu and Awodunyila, (2008) gave credence to above statement. They reported that number of years of farming experience as acquired by the farmer enhances his/her managerial know-how, adoption decisionmaking ability and more familiar with the technologies in use. In the same vein, Ojiako, (2011) [26] posited that knowledge gained over time from working in uncertain production environment may help in evaluating information thereby influencing their adoption decision and intensity(Udensi, et al; 2011) [39] In a differing opinion, Okoye, et al; (2009) [27] stated that the conservative attitude of experienced farmers in detesting new technologies no matter how genuine and profitable for old ways of doing things in which they are used to, could be the reason for the sign identity of the coefficient. Moreover, level of education had a positive and significant influence on the decision to adoption the technology by the crop producers in both upland and lowland of the study area. Various studies (Ume, 2014, Ojo and Ogunyemi, 2014; Hagos, et al, 2018) [30,18] on positive effects of educational level of the farmer on decision to adopt technology exist. The positive sign could be attributed to the fact that education acquisition tends to inspire individuals' attitudes and thoughts, hence making them more exposed, rational and capable to explore the gains of the new technology. The negative attitude by many people particularly educated individuals to farming as vocation for the aged and uneducated people may perhaps be the reasons for the indirect relationship Ume, Ezeano, Onunka, and Nameri, (2016) [50] reported in their study of socio-economic determinant factors to the adoption of cocoyam production technologies by small holder farmers in South East Nigeria. Furthermore, comparable to a priori knowledge, farm size had a positive effect on the decision to adopt taro production technologies among upland farmers, while negative correlation with low land farmers in the study area at 1% and 10% probability levels respectively. The positive of the coefficient identity implies that farmers that had large farm size are more technologies adopters compared to those with small farm holdings. Rogers, (2003) [36] and Okoye, Okoye, and Okoroafor, (2009) [27] noted that farmers with large farm size are likely to adopt a new technology as they can afford to devote part of their land to try the technology, unlike those with small farm size. Ume, et al, (2016) [42] observed that farm size affects adoption costs, risk perceptions human capital, credit constraints, labor requirements and tenure arrangements The direct relation between adoption of technology and farm size did not conform to Echebiri, (2004) [45] , who stated that farmers with small farm holding tend to have the higher odds of adopting improved production technologies because of their intensions of optimizing output per given area of land. As well, the coefficient of off-farm income had direct relationship with technology adoption in both production systems, implying that increase in farmers' level of participation in off-farm employment could result to increase in decision to adopt esculentum production technologies. This could be related to the fact that any increase in household levels of engagement in off farm income has the probability of having more access to credit to procure their prerequisite farm inputs that could facilitate the decision to technology adoption (Udensi, Tarawali and Favour, 2011) [39] . In contrast, on the sign identity of the coefficient, Eze and Okorji, (2004) [10] reported that where farmers' income accruing from offfarm employment supersedes that of the farm income, there is higher tendency that such farmer could totally or partially jettison the decision to adopt the technology. Additionally, the coefficient of extension services had a positive influence on the decision to adopt the technology only among farmers in upland areas. The extension services as revealed by aids in innovation transfer to farmers, effective use and benefit of new technology and in sourcing of improve farm inputs aimed at facilitating his/her decision for the technology adoption. Furthermore, organization coefficient had positive signed identity and significantly influence on the decision to adopt taro technology in the upland and lowland production systems at 1% and 105 alpha level respectively. Farmers that are members of organization are opportune to have to access to information on improved innovations and material inputs of the technology (fertilizer and chemicals) to affect their decision to a given technology adoption. Okoye, et al, (2007) [51] made similar findings. They opined that farmers that are of members of cooperative society for instance have ease of access to credit from formal lending institution for purchasing necessary farm inputs and capacity building by expects in the subject, hence influencing their decision to technology adoption. Also, the Fertilizer coefficient was statistically significant in the two production systems but positively signed to taro producers in upland, while negative to lowland ones. The negative sign of variable factor in the lowland area could be ascribed to its dearth and soaring price, since farmers residing in lowland have poor access to urban markets especially during rainy season, when most of the roads are very impassable. The finding of Ume, et al, (2020) agreed with indirect relationship between fertilizers to technology adoption. They posited that high costs of labour used in fertilizer application and among other factors were responsible for the behaviour of the variable. The important of fertilizer in boosting agricultural productivity as it has the capacity to shift crop production frontier upwards, especially in most sub-Saharan Africa where because of soil degradation, poor cultural farming practices and other factors, poor soil fertility prevails (FAO, 2019). This could be patterning to the fact that inorganic fertilizer has features of being highly soluble in water, the nutrient easily available to plants, high concentration and low price per unit of nutrient, ease of calculating accurate application rates and the uniformity and accuracy with which specific amounts of available nutrients can be applied (National Root Crop Research,(NRCRI), ( 2016)) [25] . The positive sign of the coefficient of fertilizer disagreed with the works of Saliu, Ibrahim and Eniojukan (2016) [37] .They cited high cost of fertilizer at farm level as a limiting factor to its use by most poor resourced farmers. More so, the coefficient of cost of technology had a positive and significant effect on the decision to adopt esculentum among the two production systems. This assertion was synonymous with a priori expectation, implying that high cost of technology has high inclination, particularly among resource farmers in making negative decision in relation to adoption of the technology. Onyeneke, (2017) [34] , for instance reported that since withdrawal of World Banksponsored structural adjustment programs in sub-Saharan Africa in 1990s, leading to the elimination of subsidies on prices of seed and fertilizers, hence exuberated this constraint As well, suitability of technology to farmers' circumstances was positive to the decision to adopt taro use in both production systems, although at different statically probability levels. Ume, Onwujiari, and Achebe, 2020) inferred that farmers who perceive the technology being consistent with their needs and compatible to their environment are probable to adopt meanwhile they regard that as a positive investment. Farmers' perception about the performance of the technologies significantly influences their decision to adopt them. Consequently, it is very vital that for any new technology to be introduced to farmers, they should participate in its evaluation to determine its suitability to their circumstances (Ojiako, 2011) [26] .
The Intensity of Adoption of Taro Production Technology
The dependent variable is taro adoption intensity which is measured as areas allocated for taro to total area allocated for cocoyam production. The existence of outliers, the problem of Multicollinerity, heteroscedasticity and endogeneity are common in cross sectional data, hence needed to be addressed. The presence of heteroscedasticity in the error terms does not constitute a serious problem in terms of attaining reliable estimates as it only causes a bias in the estimates of standard errors and used robust standard error. Variance inflation factors (VIF) was computed for all explanatory variables that were used in the Two bit model and the result shows VIF were less than 8 that indicating Multicollinerity was not a problem. The result of the analysis revealed that the overall fitness of the model had found to be statistically significant at less than 1% probability level. The Intensity of adoption of taro production technology is shown in Table 3 The coefficient of age was positive to farmers in upland and negative to farmers in low land areas, although both were significant at 5% probability levels respectively. The positive identity of the coefficient was in consensus with work of Arega, (2009) and Saliu, Ibrahim and Eniojukan, (2016) [37] . This implies that as farmers start advancing in age, the greater the chances of increasing their intensity of adoption of esculentus by 54.4%. While, the negative sign identity of the age factor could connote that the farmers' adoptability decreases as they increases in age. The positive sign identity of the age factor could be correlated to farmers' acquiring knowledge from previous farming experiences in order to enhance their adoptability behavior. As well, conservatism of the aged people to new innovation for fear of risks and uncertainties of failure among others could be deduced as reason for the indirect relationship between the dependent and independent variables (Challa, 2013) [6] . More so, the coefficient of household size was found to be positive and had statistically significant influence in the intensity of improved cesculentum adoption in both production systems at 5% probability levels respectively. This implies that an increase in the number of household member that is of labour age by one would increase the intensity of esculentum adoption by 27.1%. This implies that as the number of household members' increases, the probability of households to allocate more land for colocasium esculentum production. This notion holds water since larger family size is generally associated with greater labor force availability for the timely operation of farm activities, especially among peasant farmers (Ezedinma, 2004) [11] . Ojiako, (2011) [26] finding synchronized with the aforesaid relationship, however, Alene, et al; (2000) [3] ; and Akintola, Arega and Adeyemo, (2007) works were in contrary. The consumption pressure often correlated with large dependent household members could abate intensity of the technology adoption, as priority is given to the former challenge by the household head (Onyenweaku, Okoye, Okorie,.2010) [33] . In addition, the coefficient of membership of organization was found to be positively influenced the intensity of adoption of taro in both production systems and at 1% probability level. The implication is that being membership of organization such as cooperative society could increase the intensity of adoption of the technology by 44.3% and 65.2% for upland and lowland farmers respectively in contrast to non-members. This finding agreed with studies on intensity of adoption of cocoyam improved technologies in South East Nigeria by Ume, (2014) and on impact of cooperatives on agricultural technology intensity of adoption in Ethiopia by Ojiako, (2011) [26] , where adoption intensity was positively related to membership of cooperatives. Cooperative association for instance, is a components of social capital, which has the potential of increasing the intensity of adoption through among others enhancing member farmers' access to input services (fertilizers, seed, and chemicals), access to information on improved technologies, credit for the purchase of inputs and payment of hired labour (FAO,2012). In addition, social groups as opined by Rogers, (2003) [36] provide the much social needs of the member farmers, improve diffusion of technology and assist on collective approach solutions to problems, hence capable of increasing the intensity of Technology adoption. It is widely acknowledged among literatures as reported by Saliu, et al. (2016) that agricultural development agencies can achieve great success when farmers work in alliance with farmers' organizations like cooperative societies. However Ume, (2014) finding opposed the positive relation. He reported that the bottlenecks of small holder farmers being members of cooperatives and the much devotion of member farmers to organizational activities to the detriment of their vocation (farming) may possibly be the reasons for the sign identity of the coefficient. In addition, social groups may also have a negative impact on technology adoption especially where free-riding behavior exists as reported by Udensi, et al; (2011) [39] In addition, the coefficient of distance to weather road had positive influence on the intensity of adoption of the technology among taro farmers in upland production system but negatively signed among lowland producers. These relationships amongst the farmers in the two production systems were significant at 1% risk level respectively. The positive of the variable among the upland producers connotes that as distance to all weather roads from farmers' resident increases by one kilometer, the intensity of esculentum adoption would increase by 26.5%. While in the lowland with negative coefficient identity, implies that the decreases of the variable factor by one kilometer, would lessen the intensity of taro adoption by 43.3%. Studies (Arega, 2009; Alene, et al; 2000; Diiro, 2013) [3,7] revealed that distance to all-weather road signifies a proxy for market accessibility. The lowland farmers with negative coefficient designates that farmers far away from all-weather were less probable to adopt technology than those who were situated nearer to all-weather roads. The likely reason to be deduced to that could be farmers far away from the all-weather roads were not motivated to produce taro (Colocasium esculent) due to poor access to information, infrastructures and extension services, and less market-oriented and pursued subsistence oriented objectives. More so, the coefficient of access to credit by household of esculentum producers in the upland was positive, while negative in the lowland. The positive identity of access to credit was in concurrence with Akintola; et al; (2007) and Awotide, Abdoulaye, Alene and Manyong, (2014) [5] . This implies that as farmers' access to credit enhances, the greater the chances of increasing their intensity of adoption of esculentum by 25.64%. Whilst, for the negative sign of the variable among lowland producers could signify that as the farmers' access to credit lessen, the higher the probability of decreasing their level of the technology adoption by 19.89%. The negative correlation between access to credit and intensity of adoption of the technology in the lowland area as reported by Ume, et al, (2020) [43] could be attested to dearth of citing of formal lending agencies in the lowland areas, hence hindering their ease of loan accessibility and as well most farmers in that vicinity shun informal sector of loan procurement due to their shylock interest rates, thereby limiting their access to credit. FAO, (2014) [13] reported that availability of credit had a positively influence on the intensity of adoption of technology by relaxing the necessary capital restrictions that farmers encounter during their initial investments or helped to finance the variable costs that could facilitate in technology adoption. Additionally, the coefficients of off-farm income was positive and negative to upland and lowland farmers respectively. The negative effect could be attributed to few non-agricultural investments in the lowland areas compared to those farmers in upland areas that have access to among others to urban areas where lots of off-farm employments subsist. The negative sign identity of the variable factor signifies that availability of off-farm income lessens the chances of adopting and intensifying esculentum use by producers at 59%. The positive sign of the variable factor among upland farmers indicates high odds of level of adoption of the technology by 52.2%. Dario (2013) [52] finding concurred with positive identity of the variable factor. He posited that off-farm income act as an ancillary for borrowed capital in rural economies where credit markets are either absent or dysfunctional. In contrary, Ibrahim, Haque and Hague, (2014) [19] opined that the quest for off-farm income by farmers could weaken their adoption of modern technology by curtailing the proportion of family and hired labour allocated to farming enterprises. Off-farm employment accordingly to Awotide, et al.; (2014) [5] provides a risk management tool to lessen the income variability associated with the farm household for purchasing productivity enhancing inputs (improved seed and fertilizers) and as well influence the allocation of family labour, hence facilitating the intensity of adoption of the technology. In addition, off-farm employment engagement by households, could imply having a form of diversification which is necessary for technology adoption Table 3 revealed that farm size of the household head had a negative and positive effect on the intensity of taro use among upland and lowland farmers and both found to be statistically significant at 5% alpha levels respectively. This implies that one acre increase in the farm holding of the household in upland area would decrease the intensity of the technology adoption by 63.3%. The negative sign identity of the coefficient could be correlated to competition between farming and infrastructure development, hence leading to dearth in the resource available to poor resource farmers. In related study by Fender and Umali (1993) [16] , Eze and Okorji, (2004) [10] and Grabowski, Kerr, Haggblade, Kabwe (2016) [17] . Farm size had direct impact on technology adoption. The direct correlation of the farm size variable to adoption of technology among lowland farmers could denotes that increase in the farmers' farm holding by one hectare would tantamount to increase in intensity of the esculentum adoption by 36.8%. This is not unusual since size of the farm is an inducement for diversification which affords famers the prospect to attempt on new technologies. In addition, lumpy technologies such as mechanized equipment or animal traction require economies of size to ensure profitability (Adeshina and Zinnah, 2003). Moreover, the coefficient of farming experience positively influenced the intensity of esculentum use in both production systems and statistically significant at 5% and 10% probability levels respectively. This means as farm experience of the household increase by one year, the intensity of esculentum adoption increases by 23.9% and 13.8% for upland and lowland farmers respectively. This is as anticipated, since farmers with long years of farming experience are often embodied with better skills and access to new information about improved technologies and as well in evaluating information thereby influencing their adoption decision and intensity.
| Variable | Upland Coefficient t value P>1 | — | — | Lowland Coefficient t value P>1 | — | — |
|---|---|---|---|---|---|---|
| Constant | 0.45633 | |||||
| Age (Years) | 0.54379** | -0.00765 | 0.013 | -0.43900** | 0.04327 | 0.032 |
| Farm. Experience (Years) | 0.23871** | 0.00432 | 0.012 | 0.13760** | 0.00772 | 0.017 |
| Educational Level (Years) | ||||||
| Farm Size (Ha) | -0.63321* | 0.07220 | 0.024 | 0.36777** | 0.10099 | 0.0028 |
| Off-farm income (Naira) | 0.52221*** | 0.02347 | 0.032 | -0.59002 | 0.00996 | 0.012 |
| Extension Services(Dummy) | 0.37761* | 0.14320 | 0.024 | 0.24356 | -0.22117 | 0.032 |
| Household Size | 0.42850* | 0.04328 | 0.023 | 0.42109* | 0.04320 | 0.021 |
| Access to credit(dummy) | 0.25643*** | 0.03091 | 0.000 | -0.19890 | 0.42191 | 0.012 |
| Organization.(dummy | 0.44257*** | 0.65210 | 0.014 | 0.61123*** | 0.00764 | 0.017 |
| Distance to urban market (Km) | 0.00876 | 0.12300 | 0.007 | 0.05643 | 0.14876 | 0.009 |
| Distance to Weather road (Km) | 0.26512*** | 0.11564 | 0.000 | -0.43267* | 0.34512 | 0.023 |
| TriaL-ability (dummy) | 0.32543 | 0.00932 | 0.004 | 0.10032 | 0.00554 | 0.012 |
| Suitability (dummy) | 0.01134 | 0.21456 | 0.001 | 0.65732 | 0.65498 | 0.004 |
| Use of inorganic Fertilizer (Kg) | 1.00542 | 0.08043 | 0.120 | 0.03218 | 1.08321 | 0.016 |
| Organic Manure (kg) | 0.09807 | 0.16543 | 0.003 | 0.00213 | 0.12098 | 0.016 |
| Row planting method (Ridging or Mounding) | 0.43290 | 1.08532 | 0.004 | 0.31600 | 0.00217 | 0.006 |
| X 2 | 0.8530 | 0.7653 | ||||
| Likelihood | 87.1 | 79.2 | ||||
| Total Sample Size | 120 | 120 |
Table text extracted from the original PDF; superscript letters are shown inline. The original table image is below.
View original table image
Conclusion and Recommendation
Based on the findings of the study, the following conclusions were deduced; the determinant factors to adoption of cocoyam production technologies were farm income, farm size and farming experience. In addition, the factors affecting the intensity of adoption of improved cocoyam use were household size, membership of organization, credit and annual income. Based on the findings, the following recommendations were made; Farmers' financial problems may be solved through access to loans from commercial banks, microfinance banks and other lending agencies by government agencies concerned at low interest rate. Also, the need to encourage experienced and new comers farmers to remain in business through provision of farm inputs at subsidized costs is imperative. Furthermore, farmers should be encouraged to form or join cooperative societies in order to have access to improved productive inputs from government at reduced costs and appropriate time.
Figures and tables from the paper
| Variable | Upland Coefficient t value | — | Lowland Coefficient t value | — |
|---|---|---|---|---|
| Constant | 0.45633*** | 0.13560 | 0.54909*** | 0.42530 |
| Age (Years) | -0.43258** | -0.09711 | -0.22903** | 0.14352 |
| Farm. Experience (Years) | 0.0154782 | 1.0963* | 0.23987** | 0.3456 |
| Educational Level (Years) | 0.15328*** | 0.22138 | 0.66144*** | 0.5321 |
| Farm Size (Ha) | 0.53126*** | 0.40345 | -0.32743* | 0.3653 |
| Off-farm income (Naira) | 0.50285*** | 0.100087 | 0.22567** | 0.33100 |
| Extension Services(Dummy) | 0.20067* | 0.09092 | -0.22881 | 0.09316 |
| Household Size | 0.87623** | 0.31176 | 0.03109* | 1.21907 |
| Access to credit(dummy) | 0.65321 | 0.12456 | 0.09900 | 0.16512 |
| Organization.(dummy) | 0.12380*** | 0.49022 | 0.00882* | 0.18824 |
| Distance to urban market (Km) | 0.65211 | 0.00214 | 0.33551 | 0.00981 |
| Distance to Weather road (Km) | 0.03165 | 0.04326 | 0.27690 | 0.16578 |
| Cost of technology (N) | 0,51781*** | 0.09002 | 0.43076** | 0.33112 |
| Trial-ability | 0.00234 | 0.06654 | 0.21309 | 0.44221 |
| Suitability (dummy) | 0.00563 | 0.12077 | 0.07210 | 0.22881 |
| Use of inorganic Fertilizer(Kg) | 0.66221** | 1.00887 | -0.16625* | 0.34167 |
| Organic Manure (Kg) | 0.52211 | 0.11754 | 0.01166. | 0.17651 |
Table text extracted from the original PDF; superscript letters are shown inline. The original table image is below.
View original table image
References
27 in the original paper- Akintola AA, Arega DA, Adeyemo. Determinants of adoption and intensity of use of balanced nutrient management systems technologies in the northern Guinea savannah of Nigeria 2007 Second International Conference, August 20-22, 2007, Accra, Ghana with number; c2007.
- Alene AD, Poonyth D, Hassan RM. Determinants of Adoption and Intensity of Use of Improved Maize Varieties in the Central Highlands of Ethiopia: A Tobit Analysis. Agrekon. 2000;39(4):2000;633-643.
- Awotide BA, Abdoulaye T, Alene A, Manyong VM Assessing the extent and determinant of adoption of improved cassava varieties in south-western Nigeria. J Dev Agric Econ. 2014;6(9):376-385.
- Eze CC, Okorji E Cocoyam production by women farmers under improved and local technologies in Imo State, Nigeria. Africa Journal of Science. 2004;5(2): 114-117.
- ExDixon J, Nalley L, Kosina P, La Rovere R, Hellin J Aquino P. Adoption and Economic Impact of Improved Wheat Varieties in the Developing World. Journal of Agricultural Sciences. 2015;144:289-502.
- FAO: FAOSTAT, statistics division of the food and agriculture organization http://faostat.fao.org/site/567/desktopdefaultaspx? Accessed July 03, 2014, Data base results.
- Fender G, Umali DL The adoption of Agric innovation. A review technological forecasting and social change. 1993;43(4):215-239.
- Grabowski PP, Kerr JM, Haggblade S, Kabwe S. Determine nants of adoption and disadoption of minimum tillage by cotton farmers in eastern Zambia. Agriculture, Ecosystems &Environment. 2016;231;5467.
- Hagos H, Ndemo E, Yosuf J. Factors affecting adoption of upland rice in Tselemti district, northern Ethiopia. Agriculture & Food Security. 2018;7(1)59:180-183.
- Ibrahim KM, Haque E, Hoque MZ Adoption of recommended potato (Solanum tuberosum) production technologies by the potato growers of some selected areas of Bangladesh. Bangladesh J. Agril. Res. 2014;39:79-92.
- Information and Communication Support for Agricultural Growth in Nigeria (ICSAGN). Cocoyam Production in Nigeria. [email protected]. 2009.
- NPC (National Population Commission), (2006): Population census of Federal Republic of Nigeria: Analytical report at the national level. National Population Commission, Abuja; c2006.
- NRCRI. (2015); Annual report of National Root Crops Research Institute, Umudike, Umuahia; c2005.
- Ojiako IA Socio-economic stratification and its implication for adoption and use intensity of improved soybean technology in northern Nigeria. Agricultural Journal. 2011;6(4):145-154.
- Okoye BC, Okoye AC, Okoroafor A. Adoption analysis of improved cocoyam production, processing and storage technology across gender in Enugu North agricultural zone of Enugu State. Proceedings of the 45 th Annual Conference of the Agricultural Society of Nigeria, "Abuja. 2009. p. 619-623.
- Ojo SO, Ogunyemi AI. Analysis of factors influencing the adoption of improved cassava production technology in Ekiti State, Nigeria. International Journal of Agricultural Sciences and Natural Resources. 2014;1(3):40-44.
- Onunka BN, Ume SI, Okoroafor IB, Edeh ON. Determinant Factors to Decision to Adopt Pro-Vitamin a Cassava Varieties by Farmers in Abia State of Nigeria. International Journal of Research and Scientific Innovation (IJRSI) October. 2020;7(10): ISSN 2321-2705 www.rsisinternational.org Page 148
- Onyenweaku CE, Okoye BC, Okorie KC. Determinants of fertilizer adoption by rice farmers in Bende Local Government Area of Abia State, Nigeria. Nigeria Agricultural Journal. 2010;41(2):1-6.
- Onyeneke RU. Determinants of adoption of improved technologies in rice production in Imo State, Nigeria. African Journal of Agricultural Research. 2017;12(11):888-896.
- Tobin J. Estimation of relationship for limited dependent variables. Econometrics. 1958;26:25-27.
- Udensi UE, Tarawali G, Favour T. Adoption of selected improved cassava varieties among smallholder farmers in South-Eastern Nigeria. Journal of Food, Agriculture and Environment, 2011;9(1):329-335.
- Ume SI, Ezeano CI, Onunka BN, Nwaneri TC. Indo - Asian Journal of Multidisciplinary Research (IAJMR) 2016;2;(5);760-769. Available online at www.jpsscientificpublications.com
- Maddala GS. Methods of estimation for models of markets with bounded price variation. International Economic Review. 1983 Jun 1:361-78.
- Ebiringa DC, Echebiri SI. Effects of substituting honey for sucrose in bread making. Nigerian Food Journal. 2004;22(1):189-94.
- Green A. Education, globalization and the nation state. InEducation, globalization and the nation state 1997 (pp. 130-186). Palgrave Macmillan, London.
- McDonald JF, Moffitt RA. The uses of Tobit analysis. The review of economics and statistics. 1980 May 1:318-21.
- Roncek DW. Learning more from tobit coefficients: Extending a comparative analysis of political protest. American Sociological Review. 1992 Aug 1:503-7.