
Research article · 2023 · Full text
International Journal of Advanced Biochemistry ResearchResponse of growth and yield as influenced of chickpea (Cicer arietinum L.) cropping system, irrigation and phosphorous
Volume 7(1S) · Pages 14–18 · DOI: 10.33545/26174693.2023.v7.i1sa.166 ↗
Research areasAgronomic Practices and Intercropping SystemsGenetic and Environmental Crop StudiesAgricultural Science and Fertilization
Abstract
Author-writtenA field investigation was conducted at Agronomy research farm A. S. (P.G) College, Lakhaoti, Bulandshahr during rabi seasons of 2006 and 2007. The treatments consisted of combination of four cropping systems viz. chickpea sole (M1), linseed sole (M2), chickpea+ linseed 2:1 ratio (M3) and pigeonpea + linseed 4:2 ratio (M4) in main plots; two irrigations viz. two irrigations at vegetative stages (30-40 days) and flowering stage (70-75 days) (S1) and one irrigation at flowering stage (70-75 days) (S2) in sub plots and three levels of phosphorous viz. control (L1), 30 kg P2O5/ha (L2) and 60 kg P2O5/ha (L3) in sub-sub plots in split plots design replicated thrice during the rabi season. The chickpea variety BG-362 and linseed variety neelam were used in the cropping systems during rabi season. The soil of the experimental site was low in organic carbon (0.47 and 0.48 kg/ha) and total nitrogen (154.0 and 155.1 kg/ha). It was low in available phosphorus (9.2 and 9.24 kg/ha) and medium in available potassium (203.0 and 203.6 kg/ha) and sandy loam in texture having alkaline reaction (pH 7.5). The weather during the both years of the experiment was by and large normal and devoid of any extreme conditions. The net return was found to be maximum under chickpea: linseed in 4:2 row ratio with two irrigations and 60 kg P2O5/ha. (Rs. 21,632 and Rs. 22,128) followed by sole chickpea with two irrigation and 60 kg P2O5/ha. Due to relatively higher gross return. The maximum B:C ratio of 1.87 and 1.91 was obtained from chickpea: linseed in 4:2 with one irrigation at flowering and 60 kg P2O5/ha, because of reduced cost of on irrigation and higher gross return of the system.
Summary
Source-checkedPlain-language reading of the full paper, prepared with AI and checked against the text. Each point links to the authors' own words.
Why it matters
- Chickpea is a critical rabi pulse crop, accounting for 33% of total pulse production in India. View evidence ↗
- Low chickpea productivity is primarily attributed to the failure to adopt improved agronomic practices, such as optimal fertilizer application and protective irrigation. View evidence ↗
- Phosphorus is a vital nutrient for chickpea, directly influencing both the quality and yield of the crop through various physiological processes. View evidence ↗
The question
- The study aimed to evaluate how different cropping systems with linseed, irrigation schedules, and phosphorus levels affect the growth and yield of chickpea. View evidence ↗
What they did
- The study utilized the BG-362 variety of chickpea and the Neelam variety of linseed. View evidence ↗
- Data were analyzed using analysis of variance (ANOVA) and the 'F' test to determine statistical significance. View evidence ↗
What they found
- Intercropping systems (2:1 and 4:2 ratios) reduced the seed and stover yield of chickpea compared to sole cropping due to a decrease in plant population. View evidence ↗
- The highest net returns (Rs. 21,632 and Rs. 22,128) were achieved using a chickpea:linseed 4:2 row ratio combined with two irrigations and 60 kg P2O5/ha. View evidence ↗
- The best benefit-cost (B:C) ratio (1.87 and 1.91) was found in the chickpea:linseed 4:2 system with one irrigation at flowering and 60 kg P2O5/ha. View evidence ↗
What it means
- The authors conclude that phosphorus application up to 60 kg P2O5/ha significantly improves key yield attributes, including seed weight and the number of pods and seeds per plant. View evidence ↗
- The authors state that providing irrigation at both the vegetative and flowering stages significantly increases grain yield per plant compared to irrigation only at the flowering stage. View evidence ↗
Visual summary
1 visualsIllustrations explain the paper; they do not show study data.
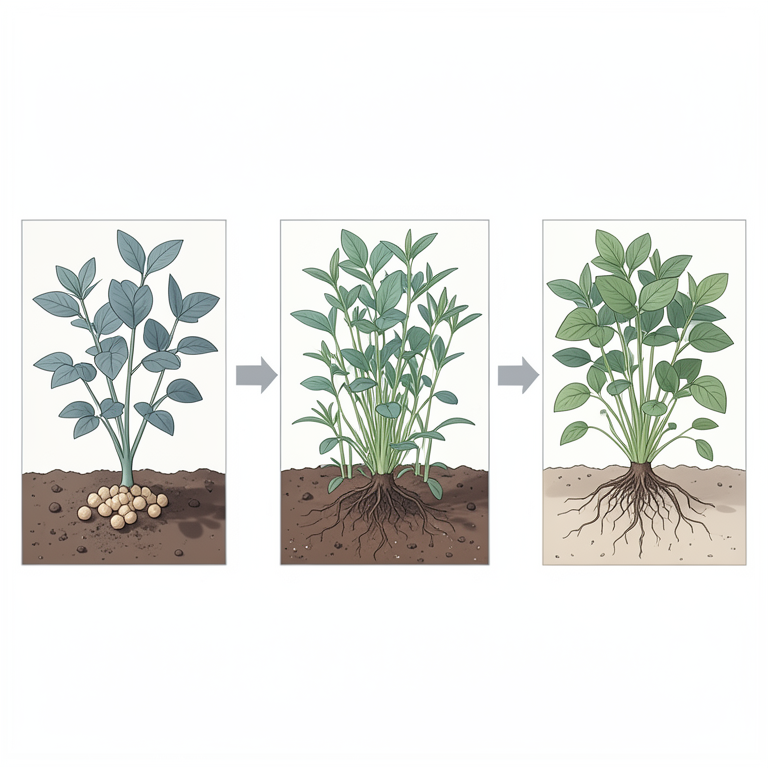
Experimental Treatment Matrix
AI-generated conceptual illustration (chickpea plants and linseed plants). It explains the idea and does not show study data.
View source evidence ↗Figures & tables
From the original paper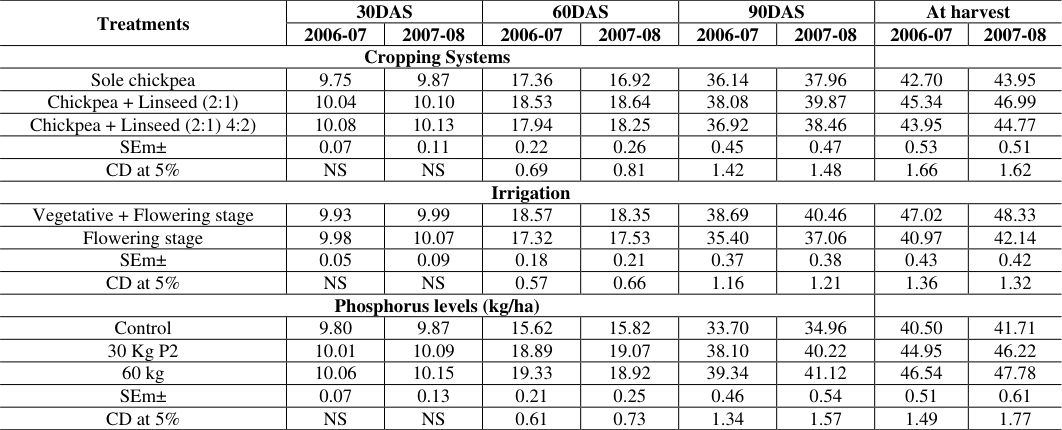 Table 1
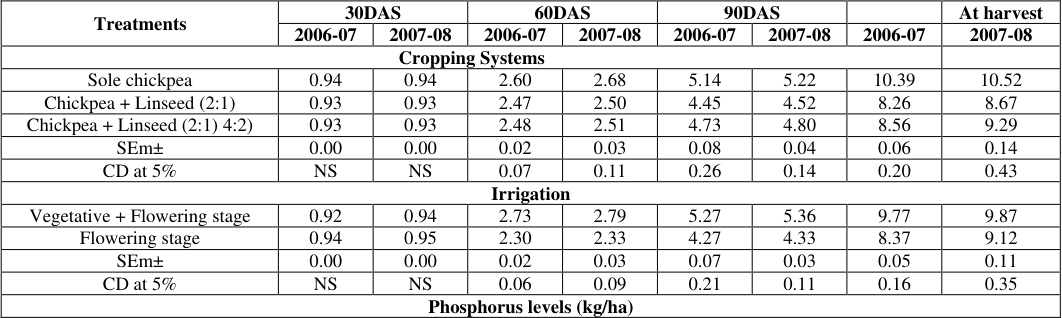 Table 2
 Table 3
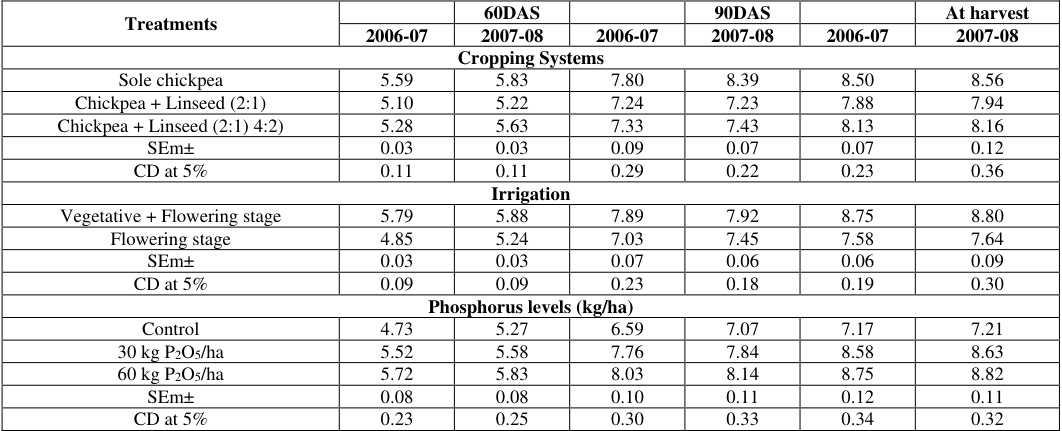 Table 3
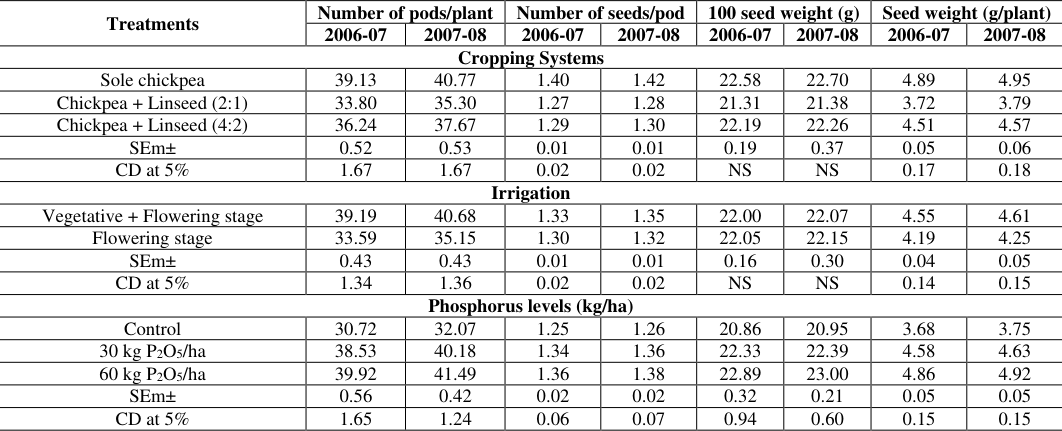 Table 4
Introduction
Chickpea (Cicer arietinum L.) is the most important crop amongst the rabi pulses. Its contribution to the total pulses production in the country is 33 percent. The area under chickpea in India is 6.1 million hectare with the production of 5.27 million tonnes at an average productivity of 717 kg/ha (G0I, 2008). Area under chickpea (Cicer arietinum L.) in U.P. is 0.87 million hectare, production is 0.78 million tonne and average yield is 896 kg/ha. Among various pulses grown in India, chickpea occupies major place. It is mainly cultivated in the states of Rajasthan, UP., M.P., Haryana, Maharashtra and Punjab. Moreover, presently area under chickpea has been decreasing on account of stiff competition from high productive crops like cereals, secondly, chickpea is predominantly grown under rainfed areas where due to low rainfall, area again has decreased. In spite of the importance of pulses in our daily diet, their production has not been increased proportionately to the cereal production. As a result their availability has declined from 64 g/capita/day during 1950-1951 to less than 40 g/capita/day. The main reasons for low productivity are non adoption of improved agronomic practices comprising timely sowing, optimum, plant population, application, of fertilizers, protective irrigation, weed management and adequate plant protection measures. lntercropping is an agronomic refinement of the old practice of crop mixture, where in the crop components, usually two are sown in separate rows, their population ratios are know and they can be harvested singly and produce recorded separately. The crop components often have. different growth period and growth habits, statistical analysis and interpretation of the total and individual products is, thus, possible and valid, for drawing conclusion of the propriety or otherwise of the system in a given region. Among various measures adopted for improving the productivity of oil seed crops, one technique may be to grow these crops with legumes. It has been observed that intercropping of oil seed with cereals, pulses and fibers is one of the best techniques to increase production. Phosphorus is the most vital nutrient, which contributes directly to both yield and quality of chickpea. It plays an important role to various physiological processes. Moreover, it is constituent of ADP, ATP, nucleic acids and nucleo proteins and several co-enzymes, which are of great importance in energy transformation and metabolic activities of the plant. Phosphorus deficiency is usually the key factor for poor yield of pulses on most of the soils. In absence of inadequate supply of phosphorus sometimes, other nutrient elements also become ineffective for plant use. A good supply of phosphorus to the plants helps in better root development and hastens maturity. Optimum levels of phosphorus increases growth, nodulation and nitrogen fixation in legumes. However, there is a considerable variation in its requirement, which need careful study before making any recommendation for getting economical yield.
Materials and Methods
A field investigation was conducted at Agronomy research farm A. S. (P.G) College, Lakhaoti, Bulandshahr during rabi seasons of 2006 and 2007 to study 'Growth and yield performance of chickpea as influenced by chickpea (Cicer arietinum L.) + linseed (Linum usitatissimum.) cropping system, irrigation and phosphorous. The treatments consisted of combination of four cropping systems viz. chickpea sole (M1), linseed sole (M2), chickpea+ linseed 2:1 ratio (M3) and chickpea + linseed 4:2 ratio (M4) in main plots; two irrigations viz. two irrigations at vegetative stages (30-40 days and flowering stage (70-75 days) (S1) and one irrigation at flowering stage (70-75 days) (S2) in sub plots and three levels of phosphorous viz. control (L1), 30 kg P 2 O 5 /ha (L2) and 60 kg P 2 O 5 /ha (L3) in sub-sub plots in split plots design replicated thrice during the rabi season. The chickpea variety BG-362 and linseed variety neelam were used in the cropping systems during rabi season. The soil of the experimental site was low in organic carbon (0.47 and 0.48 kg/ha) and total nitrogen (154.0 and 155.1 kg/ha). It was low in available phosphorus (9.2 and 9.24 kg/ha) and medium in available potassium (203.0 and 203.6 kg/ha) and sandy loam in texture having alkaline reaction (pH 7.5). The weather during the both years of the experiment was by and large normal and devoid of any extreme conditions. The experiment was conducted as per the standard procedures and all the pre and post harvest observations were recorded and analyzed as per the prescribed statistical procedures. The experimental data pertaining to each character were subjected to statistical analysis by using the technique of analysis of variance (ANOVA) and their significance was tested by "F" test (Cochran and Cox, 1957) [11] . Standard error of means (SEm+) and least significant difference (LSD) at 0.05 probabilities were worked out for each character studied to evaluate differences between treatment means.
Result and Discussion
Cropping systems failed to affect the plant height and dry mater accumulation per plant in early stage at 30 DAS. However, these attributes linseed. These results corroborate the findings of Mandal et al. (1991) [1] and Singh et al.
(1992) [2] . The 100 seed weight remained unaffected by planting pattern. The seed and stover yield of chickpea were adversely affected in 2:1 and 4:2 cropping systems (Table .4). The yield reduction is due to reduction of plant population. Poor growth (dry matter) and development of yield attributing and reduced plant densities in different planting patterns of intercropping finally resulted in poor grain and straw yield. The reduction was, however, more pronounced n 2:1 row ratio because of more shading effect as was also reflected in lower harvest index of chickpea. These results are n agreement with those of Rana and Panhauri (2006) [3] , Singh et al. (2006) [3] and Prasad et al. (2006) [5] .
Cropping systems did not aggect N, P and K content in seed and stover and protein content. However, marked reduction in uptake of the nutrient was noticed in different cropping systems compared to sole chickpea. This might be attributed to reduced yield of chickpea in planting patterns of intercropping system. The protein yield was also declined in deferent intercropping system, which may be due to reduced seed yield of chickpea compared to its sole stand.
Irrigation
Growth attributes of chickpea (Plant height, dry matter accumulation and number of branches per plant were significantly affected by irrigation treatments at all the growth stages in both the seasons ( [12] . The Significant variation in the growth attributes may be assigned to cell elongation and turgidity owing to variations in soil moisture regimes crop with no irrigation at vegetative stage had dwarf plants with reduced branching and dry matter accumulation compared to irrigation at vegetative stage. This could be explained by the fact that lack of moisture at vegetative stage affected physiological processes adversely which reflected in growth attributing characters and ultimately in the grain yield. On the other hand, supply of irrigation water induced proper shoot growth and helped in the development of yield attributes and yield. These findings are in corroboration with those of Sharma et al.
(2005) [6] , Singh et al. (2006) [4] and Golldani and Moghaddam (2006) [8] . Crop irrigated at vegetative and flowering stages had significant effect on yield attributes i.e. number of pods per plant, number of seeds per pod and seed weight. Irrigation at vegetative and flowering produced more pods per plant over irrigation at flowering stage. This may be due to favourable effects of irrigation at vegetative stage for plant growth (plant height, dry matter accumulation, number of branches) which finally resulted in development of more pods per plant. Besides, irrigation might have enhanced the absorption of available nutrients consequently favouring the development of more pods over no irrigation. These results are in conformity with those of Hassan and Sarkar (1999) [9] et al. (2004) and Lakra et al.
(2006) [10] . Number of seeds per pod was affected significantly by levels of irrigation to crop. In fact that this character is largely governed by genetic factors and is least affected by management factors, but seed size increased significantly by the irrigation. Grain yield per plant increased significantly due to irrigation at vegetative and flowering over irrigation at flowering. The improvement in seed yield per plant may be attributed to increase in pods per plant and number of seeds per pod by irrigation. Similar findings are reported by Chandra (2002) [13] and Mathur et al. (2005) [14] . The grains and straw yield of chickpea increased significantly with two irrigation (vegetative+ flowering) over irrigation at flowering. The increase in grain yield my largely be attributed to more branches per plant and dry mater accumulation with consequently helped the production of more number of pods per plant. Increased grain yields with two irrigations have been reported by Singh et al. (1992) [2] and Lakra et al. (2006) [10] . Similarly, stover yield was significantly higher with two irrigation over on irrigation, due to higher moisture status maintained by frequent irrigations whch resulted in luxuriant vegetative growth finally leading to more stover yield. The moisture status in the root zone under irrigation at flowering stage failed to accelerate the physiological activities in the plant and consequently resulted in lesser biomass production. These findings are n conformity with those of Rizk (1979) [15] , Dixit et al. (1993) [16] , and Singh et al. (2006) [4] . The crop receiving irrigation at vegetative and flowering stage recorded higher harvest indeed in both the seasons. The harvest index of the conversion efficiency of non-grain into grain position by turning up nutrient uptake and its utilization.
The uptake of nutrients was significantly increased by the frequent use of irrigation wather during both the years. Irrigation at vegetative and flowering stage resulted in higher uptake of nutrient and therefore, there was no restriction on the movement of water and nutrients. In case of moisture stress at vegetative stage (irrigation at flowering stage) due to non-availability of water resulted in lesser plant growth thus there was lesser uptake of nutrient. These results are in conformity with the findings of Salani et al.
Phosphorus application
Phosphorus application caused perceptible increase in plant growth, plant height increase at 60 DAS onwards till harvest in both the years. The number of branches and dry mater per plant were also significantly improved with the application of phosphorus. The improvement in these growth parametes by phosphorus application might be attributed to increased availability of phosphorus and other nutrient to the plants which is important for the growth and development of plants. It is well known that phosphorus affect the metabolism of growing plants. It also enhances the photosynthesis and cell division and cell expansion. Further cell division and expansion are the prime characteristics of dynamics of plant growth. Increase in dry matter and plant height with higher dose of phosphorus has been reported by and Jain et al. (1989) [17] , Sune et al. (2006) [18] and Parihar and Tripathi (1989) [19] . Phosphorus application significantly improved the yield attributes i.e. number of pods per plant, number of seeds per pod and seed weight per plant. These attributes were favorably affected upto 60kg P2O5/ ha and similar was the responses in seed weight per plant (Table 4.4). The possible reasons for increase in number of pods per plant and number of seeds per pod could be favourable phosphorus effects on growth and development of plants as described earlier.
| Treatments | Number of pods/plant | — | Number of seeds/pod | — | 100 seed weight (g) | — | Seed weight (g/plant) | — |
|---|---|---|---|---|---|---|---|---|
| 2006-07 | 2007-08 | 2006-07 | 2007-08 | 2006-07 | 2007-08 | 2006-07 | 2007-08 | |
| Cropping Systems | ||||||||
| Sole chickpea | 39.13 | 40.77 | 1.40 | 1.42 | 22.58 | 22.70 | 4.89 | 4.95 |
| Chickpea + Linseed (2:1) | 33.80 | 35.30 | 1.27 | 1.28 | 21.31 | 21.38 | 3.72 | 3.79 |
| Chickpea + Linseed (4:2) | 36.24 | 37.67 | 1.29 | 1.30 | 22.19 | 22.26 | 4.51 | 4.57 |
| SEm± | 0.52 | 0.53 | 0.01 | 0.01 | 0.19 | 0.37 | 0.05 | 0.06 |
| CD at 5% | 1.67 | 1.67 | 0.02 | 0.02 | NS | NS | 0.17 | 0.18 |
| Irrigation | ||||||||
| Vegetative + Flowering stage | 39.19 | 40.68 | 1.33 | 1.35 | 22.00 | 22.07 | 4.55 | 4.61 |
| Flowering stage | 33.59 | 35.15 | 1.30 | 1.32 | 22.05 | 22.15 | 4.19 | 4.25 |
| SEm± | 0.43 | 0.43 | 0.01 | 0.01 | 0.16 | 0.30 | 0.04 | 0.05 |
| CD at 5% | 1.34 | 1.36 | 0.02 | 0.02 | NS | NS | 0.14 | 0.15 |
| Phosphorus levels (kg/ha) | ||||||||
| Control | 30.72 | 32.07 | 1.25 | 1.26 | 20.86 | 20.95 | 3.68 | 3.75 |
| 30 kg P2O5/ha | 38.53 | 40.18 | 1.34 | 1.36 | 22.33 | 22.39 | 4.58 | 4.63 |
| 60 kg P2O5/ha | 39.92 | 41.49 | 1.36 | 1.38 | 22.89 | 23.00 | 4.86 | 4.92 |
| SEm± | 0.56 | 0.42 | 0.02 | 0.02 | 0.32 | 0.21 | 0.05 | 0.05 |
| CD at 5% | 1.65 | 1.24 | 0.06 | 0.07 | 0.94 | 0.60 | 0.15 | 0.15 |
Table text extracted from the original PDF; superscript letters are shown inline. The original table image is below.
View original table image
These findings corroborate the results of Sarawgi and Khajani (2004). The improvement in yield attributes (number of pods per plant, seed weight per plant and number of seeds per pods) finally led to increase in the seed yield. Similar findings were also reported by Pali at al. (1995), Meena et al. (2003) and Pyare and Dwivedi (2005) [21] . Phosphorus application could not improve nutrient content in seed and straw and protein content in seed. But, the N, P and K uptake were significantly increased with phosphorus application upto 60 kg P2O5/ha. The increase in nutrient uptake was obviously due to increase in seed and straw yield by phosphorus application. Similar results were also reported by Jain et al. (1989) [17] , Srivastava et al. (1994) [20] and Pyare and Dwivedi (2005) [21] .
Conclusion
The highest number of seeds per pod was recorded in sole crop but number of pod per plant was increased levels of fertilizer application upto 60kg/P 2 O 5 /ha.
Figures and tables from the paper
| Treatments | 30DAS | — | 60DAS | — | 90DAS | — | At harvest | — |
|---|---|---|---|---|---|---|---|---|
| 2006-07 | 2007-08 | 2006-07 | 2007-08 | 2006-07 | 2007-08 | 2006-07 | 2007-08 | |
| Cropping Systems | ||||||||
| Sole chickpea | 9.75 | 9.87 | 17.36 | 16.92 | 36.14 | 37.96 | 42.70 | 43.95 |
| Chickpea + Linseed (2:1) | 10.04 | 10.10 | 18.53 | 18.64 | 38.08 | 39.87 | 45.34 | 46.99 |
| Chickpea + Linseed (2:1) 4:2) | 10.08 | 10.13 | 17.94 | 18.25 | 36.92 | 38.46 | 43.95 | 44.77 |
| SEm± | 0.07 | 0.11 | 0.22 | 0.26 | 0.45 | 0.47 | 0.53 | 0.51 |
| CD at 5% | NS | NS | 0.69 | 0.81 | 1.42 | 1.48 | 1.66 | 1.62 |
| Irrigation | ||||||||
| Vegetative + Flowering stage | 9.93 | 9.99 | 18.57 | 18.35 | 38.69 | 40.46 | 47.02 | 48.33 |
| Flowering stage | 9.98 | 10.07 | 17.32 | 17.53 | 35.40 | 37.06 | 40.97 | 42.14 |
| SEm± | 0.05 | 0.09 | 0.18 | 0.21 | 0.37 | 0.38 | 0.43 | 0.42 |
| CD at 5% | NS | NS | 0.57 | 0.66 | 1.16 | 1.21 | 1.36 | 1.32 |
| Phosphorus levels (kg/ha) | ||||||||
| Control | 9.80 | 9.87 | 15.62 | 15.82 | 33.70 | 34.96 | 40.50 | 41.71 |
| 30 Kg P2 | 10.01 | 10.09 | 18.89 | 19.07 | 38.10 | 40.22 | 44.95 | 46.22 |
| 60 kg | 10.06 | 10.15 | 19.33 | 18.92 | 39.34 | 41.12 | 46.54 | 47.78 |
| SEm± | 0.07 | 0.13 | 0.21 | 0.25 | 0.46 | 0.54 | 0.51 | 0.61 |
| CD at 5% | NS | NS | 0.61 | 0.73 | 1.34 | 1.57 | 1.49 | 1.77 |
Table text extracted from the original PDF; superscript letters are shown inline. The original table image is below.
View original table image
| Treatments | 30DAS | — | 60DAS | — | 90DAS | — | — | At harvest |
|---|---|---|---|---|---|---|---|---|
| 2006-07 | 2007-08 | 2006-07 | 2007-08 | 2006-07 | 2007-08 | 2006-07 | 2007-08 | |
| Cropping Systems | ||||||||
| Sole chickpea | 0.94 | 0.94 | 2.60 | 2.68 | 5.14 | 5.22 | 10.39 | 10.52 |
| Chickpea + Linseed (2:1) | 0.93 | 0.93 | 2.47 | 2.50 | 4.45 | 4.52 | 8.26 | 8.67 |
| Chickpea + Linseed (2:1) 4:2) | 0.93 | 0.93 | 2.48 | 2.51 | 4.73 | 4.80 | 8.56 | 9.29 |
| SEm± | 0.00 | 0.00 | 0.02 | 0.03 | 0.08 | 0.04 | 0.06 | 0.14 |
| CD at 5% | NS | NS | 0.07 | 0.11 | 0.26 | 0.14 | 0.20 | 0.43 |
| Irrigation | ||||||||
| Vegetative + Flowering stage | 0.92 | 0.94 | 2.73 | 2.79 | 5.27 | 5.36 | 9.77 | 9.87 |
| Flowering stage | 0.94 | 0.95 | 2.30 | 2.33 | 4.27 | 4.33 | 8.37 | 9.12 |
| SEm± | 0.00 | 0.00 | 0.02 | 0.03 | 0.07 | 0.03 | 0.05 | 0.11 |
| CD at 5% | NS | NS | 0.06 | 0.09 | 0.21 | 0.11 | 0.16 | 0.35 |
| Phosphorus levels (kg/ha) |
Table text extracted from the original PDF; superscript letters are shown inline. The original table image is below.
View original table image
| Control | 0.91 | 0.93 | 2.27 | 2.31 | 3.92 | 3.99 | 7.92 | 8.69 |
|---|---|---|---|---|---|---|---|---|
| 30 kg P2O5/ha | 0.94 | 0.95 | 2.59 | 2.65 | 5.05 | 5.13 | 9.46 | 9.74 |
| 60 kg P2O5/ha | 0.95 | 0.96 | 2.69 | 2.73 | 5.35 | 5.42 | 9.83 | 10.05 |
| SEm± | 0.001 | 0.001 | 0.03 | 0.03 | 0.06 | 0.07 | 0.09 | 0.12 |
| CD at 5% | NS | NS | 0.10 | 0.10 | 0.17 | 0.21 | 0.28 | 0.36 |
Table text extracted from the original PDF; superscript letters are shown inline. The original table image is below.
View original table image
| Treatments | — | 60DAS | — | 90DAS | — | At harvest |
|---|---|---|---|---|---|---|
| 2006-07 | 2007-08 | 2006-07 | 2007-08 | 2006-07 | 2007-08 | |
| Cropping Systems | ||||||
| Sole chickpea | 5.59 | 5.83 | 7.80 | 8.39 | 8.50 | 8.56 |
| Chickpea + Linseed (2:1) | 5.10 | 5.22 | 7.24 | 7.23 | 7.88 | 7.94 |
| Chickpea + Linseed (2:1) 4:2) | 5.28 | 5.63 | 7.33 | 7.43 | 8.13 | 8.16 |
| SEm± | 0.03 | 0.03 | 0.09 | 0.07 | 0.07 | 0.12 |
| CD at 5% | 0.11 | 0.11 | 0.29 | 0.22 | 0.23 | 0.36 |
| Irrigation | ||||||
| Vegetative + Flowering stage | 5.79 | 5.88 | 7.89 | 7.92 | 8.75 | 8.80 |
| Flowering stage | 4.85 | 5.24 | 7.03 | 7.45 | 7.58 | 7.64 |
| SEm± | 0.03 | 0.03 | 0.07 | 0.06 | 0.06 | 0.09 |
| CD at 5% | 0.09 | 0.09 | 0.23 | 0.18 | 0.19 | 0.30 |
| Phosphorus levels (kg/ha) | ||||||
| Control | 4.73 | 5.27 | 6.59 | 7.07 | 7.17 | 7.21 |
| 30 kg P2O5/ha | 5.52 | 5.58 | 7.76 | 7.84 | 8.58 | 8.63 |
| 60 kg P2O5/ha | 5.72 | 5.83 | 8.03 | 8.14 | 8.75 | 8.82 |
| SEm± | 0.08 | 0.08 | 0.10 | 0.11 | 0.12 | 0.11 |
| CD at 5% | 0.23 | 0.25 | 0.30 | 0.33 | 0.34 | 0.32 |
Table text extracted from the original PDF; superscript letters are shown inline. The original table image is below.
View original table image
References
19 in the original paper- Mandal BK, Rajak S, Mandal BB, Bhunia SR, Patra BC, Dandapat A. Yield of mustard, chickpea and lentil grown as sole and intercrops with mulch. Indian Agriculturist. 1991;35(4):247-253.
- Singh DK, Yadav DS. Production potential and economics of chickpea (Cicer arietinum)-based International Journal of Advanced Biochemistry Research https://www.biochemjournal.com intercropping systems under rainfed condition. Indian J. Agron. 1992;37(3):424-429.
- Rana DS, Pachapuri DK. Intercropping of rabi season crops with rapeseed-mustard for resource use efficiency, stability, profitability and crop diversification. Brassica. 2006;8(1/4):103-110.
- Singh S, Malik RK, Yadav A, Punia SS. Influence of irrigation, sulphur and seed inoculation on yield and soil moisture studies of late-sown chickpea (Cicer arietinum L.). Haryana Agril. Univ. J Res. 2006;36(1):23-29.
- Prasad K, Singh RK, Pyare R. Studies on intercropping of mustard varieties with chickpea. Indian J Pulses Res. 2006;19(1):73-75.
- Sharma G, Sutaliya R, Singh J, Sharma KP. Production potential and economic return of mustard (Brassica juncea (L.) Czern & Coss) and linseed (Linum usitatissimum L.) intercropping systems under irrigated condition. Crop Res. Hisar. 2005;30(3):483-485.
- Singh S, Malik RK, Yadav A, Punia SS. Influence of irrigation, sulphur and seed inoculation on yield and soil moisture studies of late-sown chickpea (Cicer arietinum L.). Haryana Agril. Univ. J Res. 2006;36(1):23-29.
- Golldani A, Moghaddam PR. Effect of different irrigation levels on phenology, physiology characteristics, and yield components of three chickpea (Cicer arietinum L.) cultivars in Mashhad. Agril. Sci. Tech. 2006;20(3):21-32.
- Hassan AA, Sarkar AA. Water use and yield relations of chickpea as influenced by different irrigation levels. Thailand J Agril. Sci. 1999;32(3):349-354.
- Lakra L, Ram SD, Singh RS, Yadav MS. Nutrient management in linseed based intercropping systems under limited irrigation. J Res., Birsa Agril. Univ. 2006;18(1):125-127.
- Cochran WG. Analysis of covariance: its nature and uses. Biometrics. 1957 Sep 1;13(3):261-81.
- Kuhn DM, George T, Chandra J, Mukherjee PK, Ghannoum MA. Antifungal susceptibility of Candida biofilms: unique efficacy of amphotericin B lipid formulations and echinocandins. Antimicrobial agents and chemotherapy. 2002 Jun;46(6):1773-80.
- Evans JR, Mathur A. The value of online surveys. Internet research. 2005 Apr 1;15(2):195-219.
- Rizk AS, McCulloch DJ. Plasma nitriding of Inconel 625. Surface Technology. 1979 Nov 1;9(5):303-15.
- Maine MA, Sune N, Hadad H, Sánchez G, Bonetto C. Nutrient and metal removal in a constructed wetland for wastewater treatment from a metallurgic industry. ecological engineering. 2006 Jul 31;26(4):341-7.
- Parihar SS, Tripathi RS. Dry matter, nodulation and nutrient uptake in chickpea (Cicer arietinum) as influenced by irrigation and phosphorus. Experimental agriculture. 1989 Jul;25(3):349-55.
- Srivastava A, Eustace A. ATOM: A system for building customized program analysis tools. InProceedings of the ACM SIGPLAN 1994 conference on Programming language design and implementation; c1994 Jun 1. p. 196-205.
- Pyare R, Dwivedi DP. Yield, economics and quality of chickpea (Cicer arietinum L.) as affected by row spacing and phosphorus under limited irrigation. Crop Res. Hisar. 2005;29(1):95-100.
- Righini G, Salani M. Symmetry helps: Bounded bidirectional dynamic programming for the elementary shortest path problem with resource constraints. Discrete Optimization. 2006 Sep 1;3(3):255-73.