
Research article · 2023 · Full text
International Journal of Statistics and Applied MathematicsDesign of geometric moving average control chart to monitor poisson mean for an unstabilized production process
Volume 8(3) · Pages 26–35 · DOI: 10.22271/maths.2023.v8.i3a.975 ↗
Research areasAdvanced Statistical Process MonitoringAdvanced Statistical Methods and Models
Abstract
Author-writtenControl chart is one of the important tools of Statistical Process Control to monitor the quality of goods or to improve the production process by identifying the assignable causes of variations. In this article we present a newly developed control chart to Monitor Poisson mean through Geometric Moving Average through EWMA Statistic. In a novice production process, the variations are inevitable and fluctuate between control or in-control process. Hence to suite the need of the un-stabilized process and to monitor the target TPEWMA is developed. The newly designed TPEWMA control charts and its parameters are determined based on the Truncated Poisson Distribution. The comparison on EWMA control chart with newly designed TPEWMA control charts shows better detection in small shifts. The Average Run Length of control chart is the measure of efficiency of the control chart and is larger for an in-control quality process. But at the same time ARL’s are smaller for small shifts. Hence one can give pressure on the producer to maintain the process through tightening the variable factor in a TPEWMA control chart.
Summary
Source-checkedPlain-language reading of the full paper, prepared with AI and checked against the text. Each point links to the authors' own words.
Why it matters
- Control charts are essential tools in Statistical Process Control used to improve production by identifying causes of variation and monitoring product quality. View evidence ↗
- In new or novice production processes, variations are inevitable and often fluctuate between being in-control and out-of-control. View evidence ↗
- The authors state that there is a gap in existing literature regarding control charts specifically designed to monitor the mean of an unstabilized process. View evidence ↗
The question
- The aim of this research is to develop new control charts suitable for monitoring production processes in an unstabilized environment. View evidence ↗
What they did
- The researchers developed three types of control charts based on the Truncated Poisson Distribution: 0 TPEWMA, 0-1 TPEWMA, and 0-2 TPEWMA. View evidence ↗
- A MATLAB program was utilized to determine the parameters for the newly developed control charts. View evidence ↗
- The control limits were calculated using a target value of μ0 = 10 and various values for the parameters k and λ. View evidence ↗
- The efficiency of the developed control charts was measured using the Average Run Length (ARL). View evidence ↗
What they found
- TPEWMA control charts demonstrated a better ability to detect small process shifts compared to the standard EWMA control chart. View evidence ↗
- The study found that decreasing the values of λ and k leads to the triggering of out-of-control alarms. View evidence ↗
- When λ and k are large, the ARL for the 0, 0-1, and 0-2 TPEWMA charts is smaller than that of the PEWMA chart. View evidence ↗
- For small values of λ and k, the ARL of the three newly developed TPEWMA charts is equivalent to that of the PEWMA chart. View evidence ↗
- The ARL curve's shape is influenced by the parameters: it becomes steeper as λ and k increase and flattens into a straight line as they decrease. View evidence ↗
What it means
- The authors conclude that TPEWMA charts are suitable for industrial implementation to detect small process shifts. View evidence ↗
Visual summary
3 visualsIllustrations explain the paper; charts are replotted from the paper's own table values.
TPEWMA Chart Variants
AI-generated conceptual illustration (industrial production line with a conveyor belt and mechanical parts). It explains the idea and does not show study data.
View source evidence ↗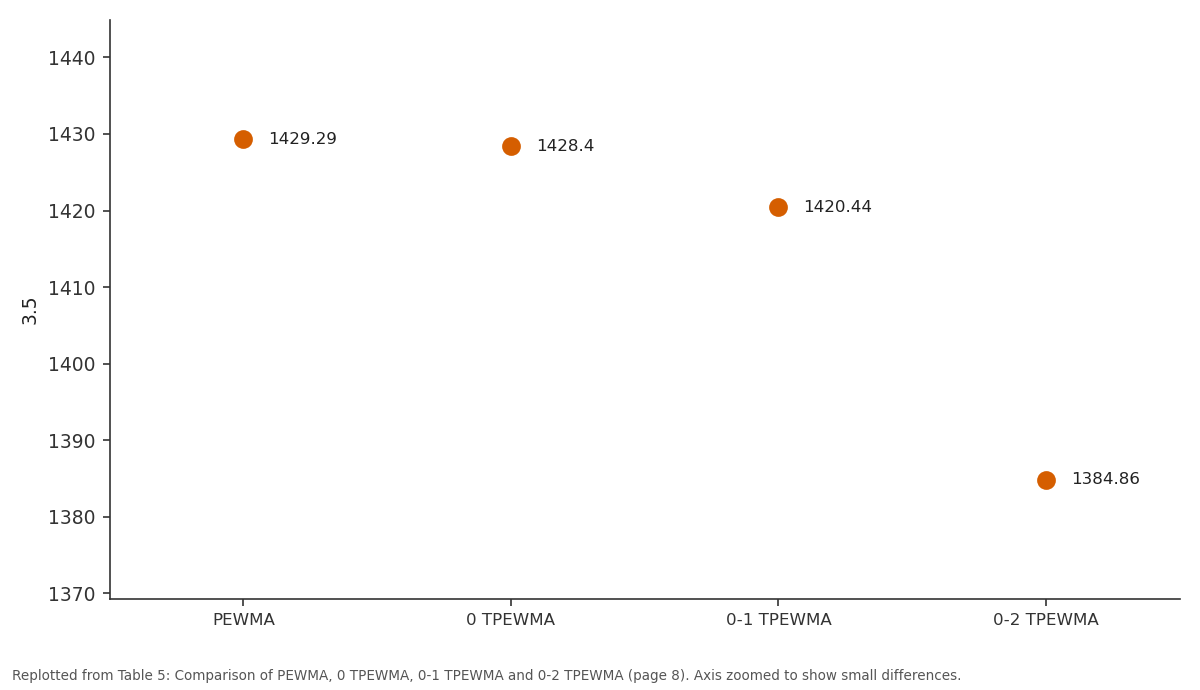
3.5: PEWMA vs 0 TPEWMA vs 0-1 TPEWMA vs 0-2 TPEWMA
Replotted from Table 5 (page 8) of the original paper. Every bar is the paper's own table value.
View source evidence ↗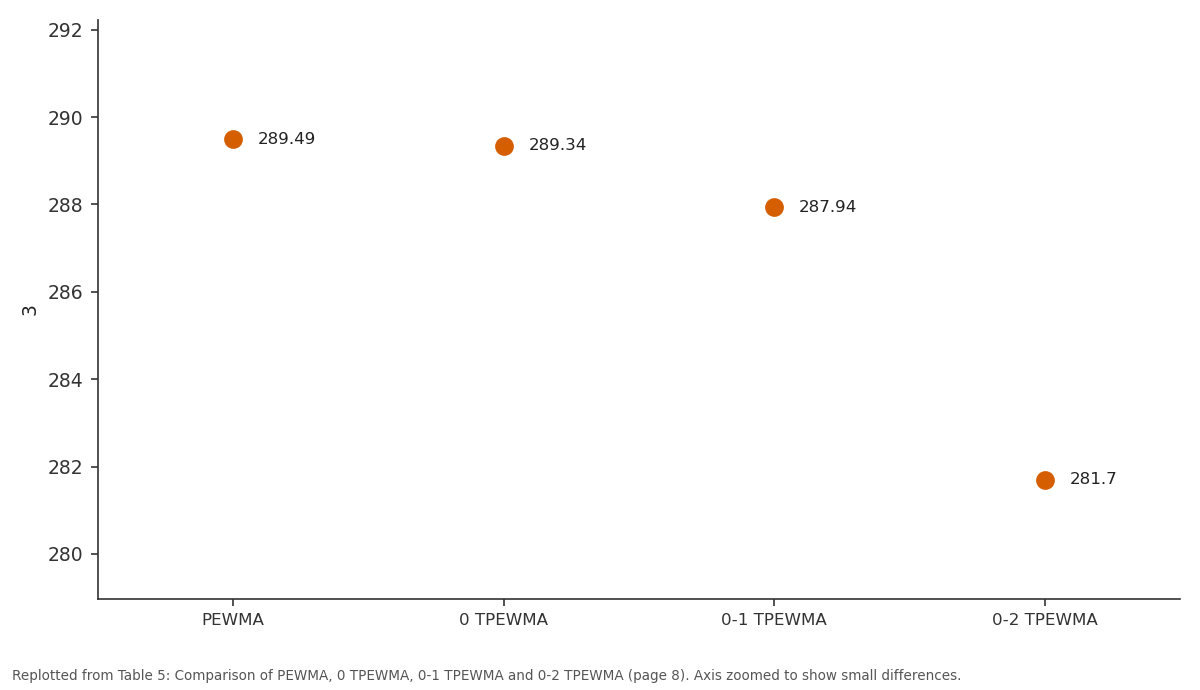
3: PEWMA vs 0 TPEWMA vs 0-1 TPEWMA vs 0-2 TPEWMA
Replotted from Table 5 (page 8) of the original paper. Every bar is the paper's own table value.
View source evidence ↗Figures & tables
From the original paper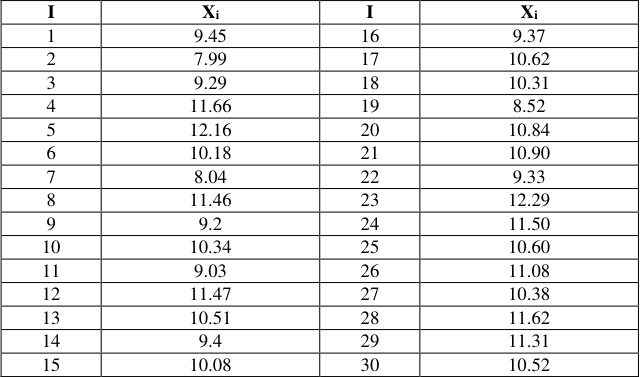 Table 1A
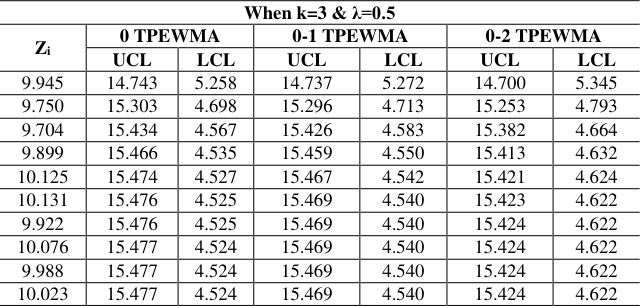 Table 2
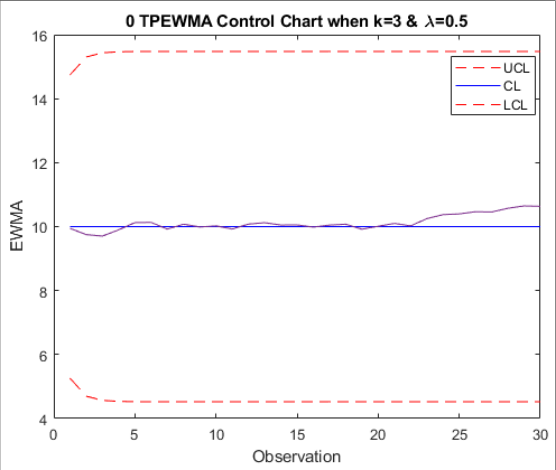 Figure 1
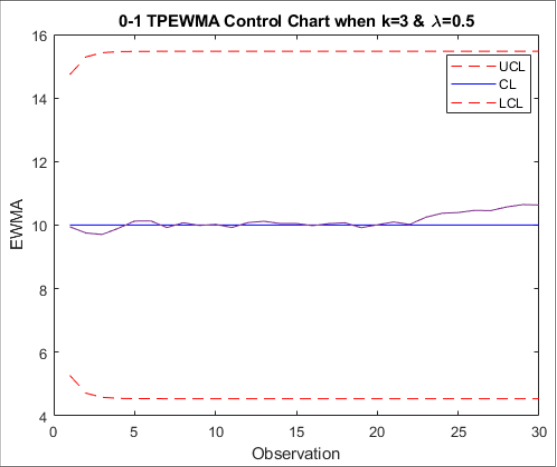 Figure 2
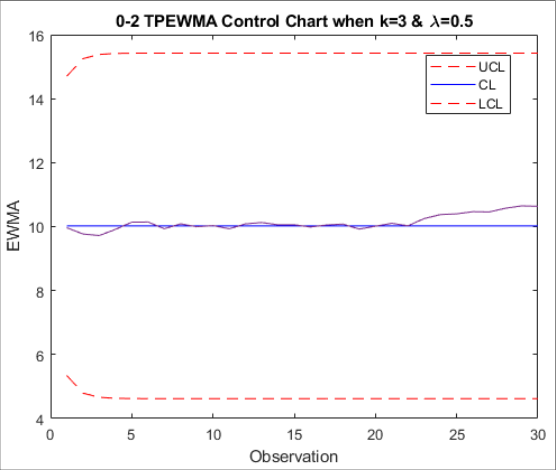 Figure 3
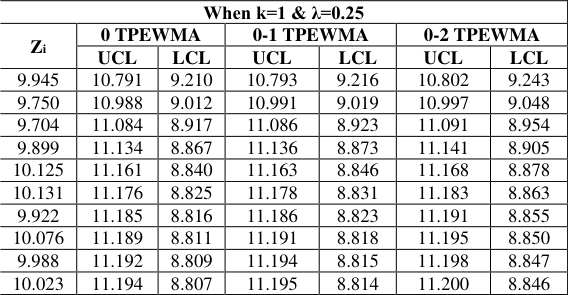 Table 3
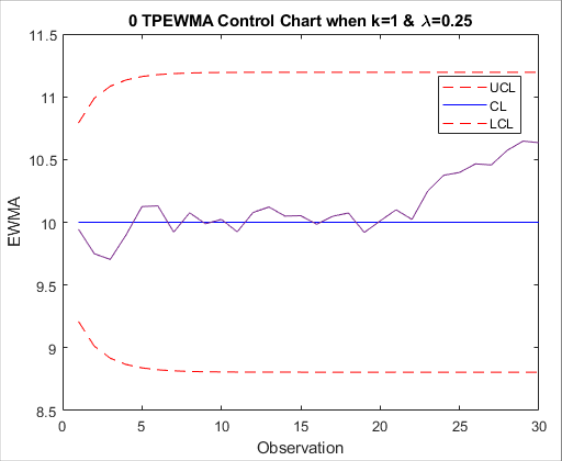 Figure 4
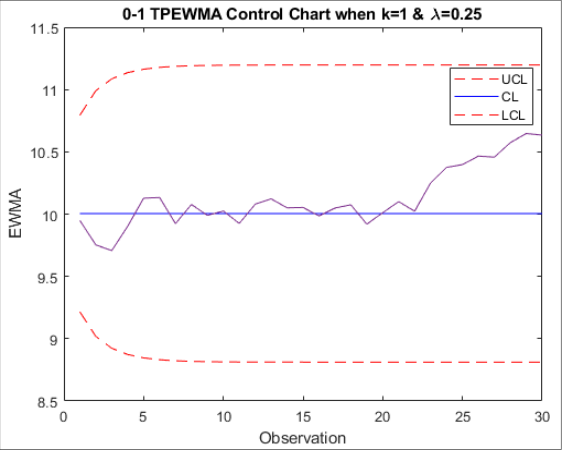 Figure 5
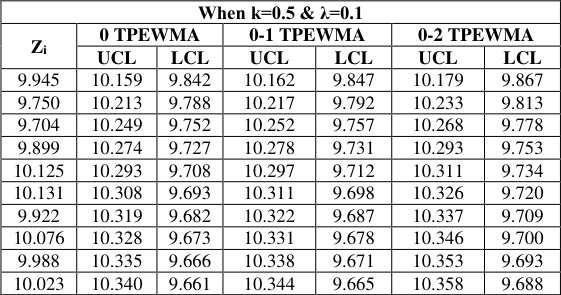 Table 4
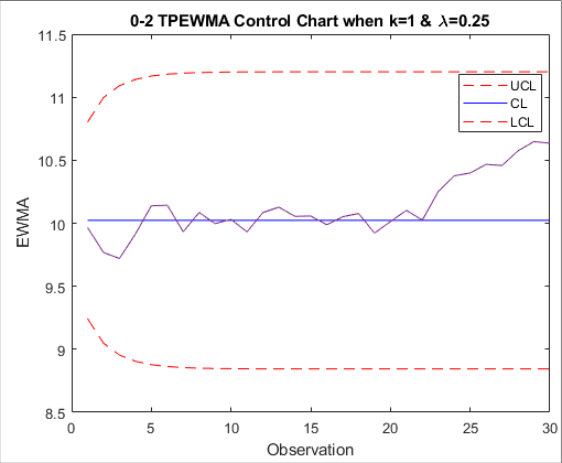 Figure 6
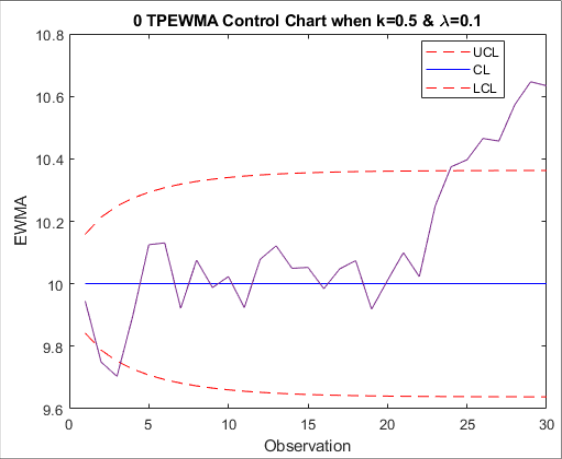 Figure 7
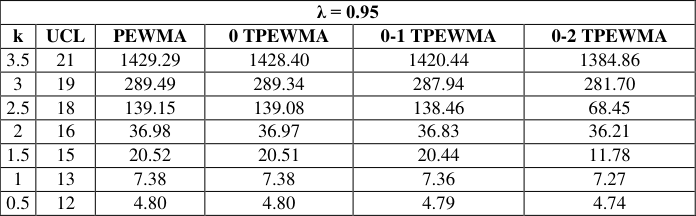 Table 5
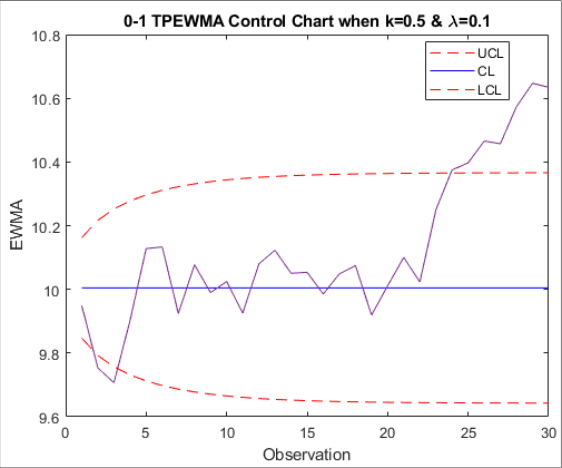 Figure 8
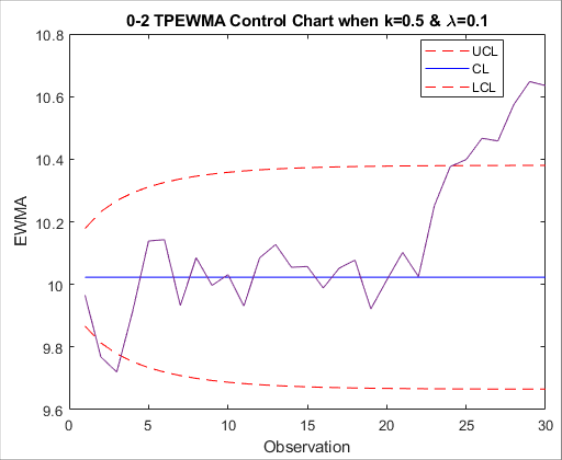 Figure 9
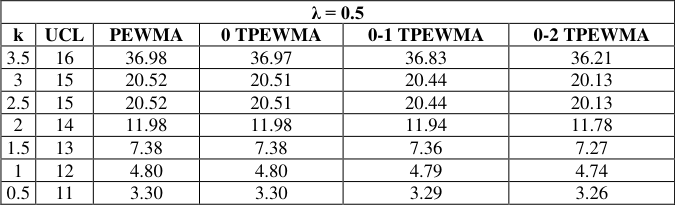 Table 6
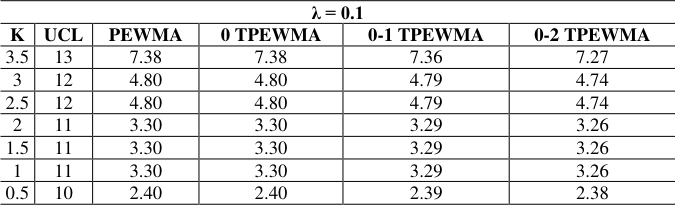 Table 7
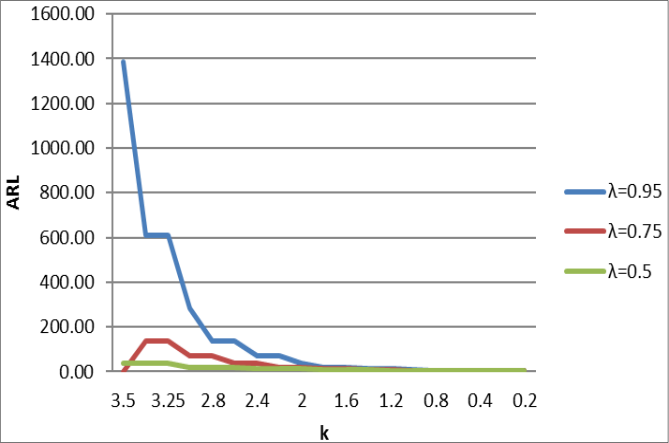 Figure 4
Introduction
Statistical Process Control (SPC) comprises of Statistical techniques to monitor and control a production process. SPC tools and procedures can help to monitor process behaviour, discover issues in the systems, and find the prevalence of assignable causes of variations if any. Process Control Charts was initially developed by Dr. Walter A. Shewhart in 1920. It is a type of chart which is used to study how the process changes over time. Control Charts are widely used to monitor the quality characteristics and to detect the process stability. The measurable quality characteristic such as volume, dimension, weight, etc. can monitored through control chart for variables. The number of failures in production run, number of malfunction of disk in a computer, etc., can be monitored through the control charts for attributes. Shewhart control charts are useful for long run and large shifts in the production process. The Cumulative sum (CUSUM) control chart and Exponentially Weighted Moving Average (EWMA) control charts are used to detect small process shifts. The CUSUM control chart was initially proposed by Page (1954). The EWMA control chart was developed by Roberts (1959) [1] . The EWMA control chart was developed for monitoring process mean in detecting small shifts. Basically, the EWMA control chart follows the normal distribution with mean 𝜇𝜇 and variance 𝜎𝜎 2 . Borror et al. (1998) [9] proposed an EWMA for a Poisson Mean (PEWMA). However there is no control charts in the literature to monitor the mean for an un-stabilized process. Hence in this paper, new control charts are developed for an un-stabilized environment. In this section, 0 Truncated Poisson EWMA (0 TPEWMA), 0-1 Truncated Poisson EWMA (0-1 TPEWMA) and 0-2 Truncated Poisson EWMA (0-2 TPEWMA) control limits are derived and control charts are developed. Average run length (ARL) is derived for the newly developed charts and is compared with existing charts.
The content of this paper is as follows: Section 2 contains the relevant literature review of control charts. Section 3 consists of methodology of the research and a matlab program is written to determine the parameters. Sections 4 contain the findings and are given in the tables and graphs. The control limits are derived and control charts of TPEWMA are given. Section 5 contains the comparisons with other types of control charts and the final Section comprises of the results and conclusion.
Review of literature
S.W. Roberts (1959) [1] introduced the control chart based on geometric moving averages to monitor the process mean of a normal distribution and is more sensitive for detecting small shifts. Cox (1961) [2] predicted a mean square error exponentially weighted moving average control chart. Hunter (1986) [3] developed an exponentially weighted moving average control chart for continuous process control. Crowder (1987) [4] determined Average Run Length (ARL) for EWMA scheme with tables and graphs. Gan (1990) [5] analysed EWMA control chart based on the observations from the Poisson distributions. The three modified EWMA control chart are Ceil (CEWMA), Round (REWMA), Floor (FEWMA) Control charts. The CEWMA control chart is designed to access the smaller increments in Poisson data more effective when a process means shifts can move towards the larger value. Likewise, the FEWMA control chart is designed to access the smaller decrements is more effective when the shifts move towards the smaller value. The REWMA is an approximation of unmodified EWMA. Lucas and Saccucci (1990) [6] have studied the properties and performance of EWMA schemes and conclude that EWMA is more efficient for detecting process mean. They also developed a False Initial Response (FIR) for EWMA control chart. MacGregor and Harris (1993) [7] have suggested that exponentially weighted moving variance (EWMV) and the mean squared deviation (EWMS) in the alternative case for monitoring process variance. Rhoads, Montgomery & Mastrangelo (1996) [8] proposed a new Fast Initial Response (FIR) scheme for EWMA which is compared with Lucas and Saccucci (1990) [6] FIR. Borror, Rigdon and Champ (1998) [9] developed a Control chart based on Poisson data and derived an ARL using Markov Chain approach. They also conclude than the LCL for Poisson EWMA control chart (PEWMA) is usually positive, hence the downward changes in the process mean can be detected. Steiner (1999) [10] developed time varying control limits for a EWMA control chart. Khoo, Michael, and Sim (2005) [11] developed a Robust EWMA control chart for easier detection of the outliers. Shu (2008) [12] designed an Adaptive EWMA control chart for monitoring process variance. Naveed et al (2018) [13] designed a control chart which is based on EWMA but the statistic of EWMA is extended. This control chart can detect the quick shifts in the process mean. Amitava Mitra, Kang Bok Lee, Subhabrata Chakraborti (2019) [14] , proposed an Adaptive EWMA control chart for monitoring process mean for both smaller and larger shifts. Arslan et al (2022) [15] developed an Improved Adaptive EWMA (IAEWMA) control chart for efficient monitoring of process mean shift. The performance comparison tools are used to show that IAEWMA is more outperforms than some other control charts.
Methodology
The mean of the production process is monitored through Poisson data and the truncated Poisson variate is augmented with EWMA Statistic. The new control limits are derived by finding the mean and variance of TPEWMA.
Zero Truncated Poisson EWMA Control Chart
Let X1, X 2, X 3 ……….be the sequence of independent and identical random variables following the zero truncated Poisson distribution. To monitor the process mean let us consider the statistic of geometric moving average control chart which was proposed by Roberts (1959) [1] ,
Where the λ be a constant which ranges from 0 < λ≤ 1. Then 𝑍𝑍 0 = 𝜇𝜇 0 when the starting value is the process target (i.e., i=1). Equation ( 1) is also called as EWMA Statistic.
Then the mean and variance of the zero truncated Poisson EWMA is,
For large values of t the variance is approximately reduces to,
Hence, the control limits for zero truncated Poisson EWMA control chart are,
Zero -One Truncated Poisson EWMA Control Chart:
Let X 1 , X 2, X 3 ……….be the sequence of independent and identical random variables following the zero -one truncated Poisson distribution. Then, consider the statistic from (1),
where the λ be the constant which ranges from 0 < λ ≤ 1. Then 𝑍𝑍 0 = 𝜇𝜇 0 when the starting value is the process target (i.e., i=1).
Then the mean and variance of the zero-one truncated Poisson EWMA control chart is,
For large values of t the variance is approximately reduces to,
Hence, the control limits for truncated Poisson EWMA control chart are,
Zero -Two Truncated Poisson EWMA Control Chart
Let X 1 , X 2, X 3 ……….be the sequence of independent and identical random variables following the zero -two truncated Poisson distribution. Then, consider the statistic from (1),
Where the λ be the constant which ranges from 0 < λ ≤ 1. Then 𝑍𝑍 0 = 𝜇𝜇 0 when the starting value is the process target (i.e., i=1) and k be the sigma limit which is usual in control limits.
Then the mean and variance of the zero -two truncated Poisson EWMA control chart is,
For large values of t the variance is approximately reduces to,
Hence, the control limits for truncated Poisson EWMA control chart are,
Comparison with control charts
The control limits and control charts for 0TPEWMA, 0-1TPEWMA, 0-2TPEWMA are shown in the following tables and figures. Let us consider the example data from the below given Table 1.a For the various value of k and 𝜆𝜆 and the target value μ 0 = 10 the control limits and control charts for 0 TPEWMA, 0-1 TPEWMA, and 0-2 TPEWMA are calculated and shown in tables 1.1 to 3.1
| I | Xi | I | Xi |
|---|---|---|---|
| 1 | 9.45 | 16 | 9.37 |
| 2 | 7.99 | 17 | 10.62 |
| 3 | 9.29 | 18 | 10.31 |
| 4 | 11.66 | 19 | 8.52 |
| 5 | 12.16 | 20 | 10.84 |
| 6 | 10.18 | 21 | 10.90 |
| 7 | 8.04 | 22 | 9.33 |
| 8 | 11.46 | 23 | 12.29 |
| 9 | 9.2 | 24 | 11.50 |
| 10 | 10.34 | 25 | 10.60 |
| 11 | 9.03 | 26 | 11.08 |
| 12 | 11.47 | 27 | 10.38 |
| 13 | 10.51 | 28 | 11.62 |
| 14 | 9.4 | 29 | 11.31 |
| 15 | 10.08 | 30 | 10.52 |
Table text extracted from the original PDF; superscript letters are shown inline. The original table image is below.
View original table image
Calculation of ARL
A study is conducted to examine the performance of the 0 TPEWMA, 0-1 TPEWMA and 0-2 TPEWMA control charts using the ARL. Comparison of ARL of three control charts with PEWMA is shown in the following table with various values of k and λ and the target value 𝜇𝜇 0 = 10.
Figures and tables from the paper
| When k=3 & λ=0.5 | — | — | — | — | — | — |
|---|---|---|---|---|---|---|
| Zi | 0 TPEWMA | 0-1 TPEWMA | 0-2 TPEWMA | |||
| UCL | LCL | UCL | LCL | UCL | LCL | |
| 9.945 | 14.743 | 5.258 | 14.737 | 5.272 | 14.700 | 5.345 |
| 9.750 | 15.303 | 4.698 | 15.296 | 4.713 | 15.253 | 4.793 |
| 9.704 | 15.434 | 4.567 | 15.426 | 4.583 | 15.382 | 4.664 |
| 9.899 | 15.466 | 4.535 | 15.459 | 4.550 | 15.413 | 4.632 |
| 10.125 | 15.474 | 4.527 | 15.467 | 4.542 | 15.421 | 4.624 |
| 10.131 | 15.476 | 4.525 | 15.469 | 4.540 | 15.423 | 4.622 |
| 9.922 | 15.476 | 4.525 | 15.469 | 4.540 | 15.424 | 4.622 |
| 10.076 | 15.477 | 4.524 | 15.469 | 4.540 | 15.424 | 4.622 |
| 9.988 | 15.477 | 4.524 | 15.469 | 4.540 | 15.424 | 4.622 |
| 10.023 | 15.477 | 4.524 | 15.469 | 4.540 | 15.424 | 4.622 |
Table text extracted from the original PDF; superscript letters are shown inline. The original table image is below.
View original table image
| When k=1 & λ=0.25 | — | — | — | — | — | — |
|---|---|---|---|---|---|---|
| Zi | 0 TPEWMA | 0-1 TPEWMA | 0-2 TPEWMA | |||
| UCL | LCL | UCL | LCL | UCL | LCL | |
| 9.945 | 10.791 | 9.210 | 10.793 | 9.216 | 10.802 | 9.243 |
| 9.750 | 10.988 | 9.012 | 10.991 | 9.019 | 10.997 | 9.048 |
| 9.704 | 11.084 | 8.917 | 11.086 | 8.923 | 11.091 | 8.954 |
| 9.899 | 11.134 | 8.867 | 11.136 | 8.873 | 11.141 | 8.905 |
| 10.125 | 11.161 | 8.840 | 11.163 | 8.846 | 11.168 | 8.878 |
| 10.131 | 11.176 | 8.825 | 11.178 | 8.831 | 11.183 | 8.863 |
| 9.922 | 11.185 | 8.816 | 11.186 | 8.823 | 11.191 | 8.855 |
| 10.076 | 11.189 | 8.811 | 11.191 | 8.818 | 11.195 | 8.850 |
| 9.988 | 11.192 | 8.809 | 11.194 | 8.815 | 11.198 | 8.847 |
| 10.023 | 11.194 | 8.807 | 11.195 | 8.814 | 11.200 | 8.846 |
Table text extracted from the original PDF; superscript letters are shown inline. The original table image is below.
View original table image
| When k=0.5 & λ=0.1 | — | — | — | — | — | — |
|---|---|---|---|---|---|---|
| Zi | 0 TPEWMA | 0-1 TPEWMA | 0-2 TPEWMA | |||
| UCL | LCL | UCL | LCL | UCL | LCL | |
| 9.945 | 10.159 | 9.842 | 10.162 | 9.847 | 10.179 | 9.867 |
| 9.750 | 10.213 | 9.788 | 10.217 | 9.792 | 10.233 | 9.813 |
| 9.704 | 10.249 | 9.752 | 10.252 | 9.757 | 10.268 | 9.778 |
| 9.899 | 10.274 | 9.727 | 10.278 | 9.731 | 10.293 | 9.753 |
| 10.125 | 10.293 | 9.708 | 10.297 | 9.712 | 10.311 | 9.734 |
| 10.131 | 10.308 | 9.693 | 10.311 | 9.698 | 10.326 | 9.720 |
| 9.922 | 10.319 | 9.682 | 10.322 | 9.687 | 10.337 | 9.709 |
| 10.076 | 10.328 | 9.673 | 10.331 | 9.678 | 10.346 | 9.700 |
| 9.988 | 10.335 | 9.666 | 10.338 | 9.671 | 10.353 | 9.693 |
| 10.023 | 10.340 | 9.661 | 10.344 | 9.665 | 10.358 | 9.688 |
Table text extracted from the original PDF; superscript letters are shown inline. The original table image is below.
View original table image
| λ = 0.95 | — | — | — | — | — |
|---|---|---|---|---|---|
| k | UCL | PEWMA | 0 TPEWMA | 0-1 TPEWMA | 0-2 TPEWMA |
| 3.5 | 21 | 1429.29 | 1428.40 | 1420.44 | 1384.86 |
| 3 | 19 | 289.49 | 289.34 | 287.94 | 281.70 |
| 2.5 | 18 | 139.15 | 139.08 | 138.46 | 68.45 |
| 2 | 16 | 36.98 | 36.97 | 36.83 | 36.21 |
| 1.5 | 15 | 20.52 | 20.51 | 20.44 | 11.78 |
| 1 | 13 | 7.38 | 7.38 | 7.36 | 7.27 |
| 0.5 | 12 | 4.80 | 4.80 | 4.79 | 4.74 |
Table text extracted from the original PDF; superscript letters are shown inline. The original table image is below.
View original table image
| λ = 0.5 | — | — | — | — | — |
|---|---|---|---|---|---|
| k | UCL | PEWMA | 0 TPEWMA | 0-1 TPEWMA | 0-2 TPEWMA |
| 3.5 | 16 | 36.98 | 36.97 | 36.83 | 36.21 |
| 3 | 15 | 20.52 | 20.51 | 20.44 | 20.13 |
| 2.5 | 15 | 20.52 | 20.51 | 20.44 | 20.13 |
| 2 | 14 | 11.98 | 11.98 | 11.94 | 11.78 |
| 1.5 | 13 | 7.38 | 7.38 | 7.36 | 7.27 |
| 1 | 12 | 4.80 | 4.80 | 4.79 | 4.74 |
| 0.5 | 11 | 3.30 | 3.30 | 3.29 | 3.26 |
Table text extracted from the original PDF; superscript letters are shown inline. The original table image is below.
View original table image
| λ = 0.1 | — | — | — | — | — |
|---|---|---|---|---|---|
| K | UCL | PEWMA | 0 TPEWMA | 0-1 TPEWMA | 0-2 TPEWMA |
| 3.5 | 13 | 7.38 | 7.38 | 7.36 | 7.27 |
| 3 | 12 | 4.80 | 4.80 | 4.79 | 4.74 |
| 2.5 | 12 | 4.80 | 4.80 | 4.79 | 4.74 |
| 2 | 11 | 3.30 | 3.30 | 3.29 | 3.26 |
| 1.5 | 11 | 3.30 | 3.30 | 3.29 | 3.26 |
| 1 | 11 | 3.30 | 3.30 | 3.29 | 3.26 |
| 0.5 | 10 | 2.40 | 2.40 | 2.39 | 2.38 |
Table text extracted from the original PDF; superscript letters are shown inline. The original table image is below.
View original table image
References
15 in the original paper- Roberts SW. Control Chart Tests Based on Geometric Moving Averages, Technometrics. 1959;42(1):97-102.
- Cox DR. Prediction by Exponentially Weighted Moving Averages and Related Methods, Journal of the Royal Statistical Society. 1961;23(2):414-422.
- Hunter SJ. The Exponentially Weighted Moving Average, Journal of Quality Technology. 1986;18(4):203-210.
- Crowder SV. A simple method for studying run-length distributions of exponentially weighted moving average charts, Technometrics. 1987;29(4):401-407.
- Gan FF. Monitoring Poisson Observations Using Modified Exponentially Weighted Moving Average Control Charts Communications in Statistics -Simulation and Computation. 1990;19(1):103-124.
- Lucas JM, Saccucci MS. Exponentially weighted moving average control schemes: Properties and enhancements, Technometrics. 1990;32(1):1-12.
- MacGregor JF, Harris TJ. The exponentially weighted moving variance. Journal of Quality Technology. 1993;25(2):106-118.
- Rhoads TR, Montgomery DC, Mastrangelo CM. A fast initial response scheme for the exponentially weighted moving average control chart, Quality Engineering. 1996;9(2):317-327.
- Borror CM, Rigdon SE, Champ CW. Poisson EWMA Control Charts, Journal of Quality Technology. 1998;30(4):352-361.
- Steiner SH. EWMA Control Charts with Time-Varying Control Limits and Fast Initial Response, Journal of Quality Technology. 1999;31(1):75-86.
- Khoo Michael BC, Sim SY. A Robust Exponentially Weighted Moving Average Control Chart for the Process Mean. Journal of Modern Applied Statistical Methods. 2005;5(2):464-474.
- Shu L. An adaptive exponentially weighted moving average control chart for monitoring process variances. Journal of Statistical Computation and Simulation. 2008;78(4):367-384.
- Naveed M, Azam M, Khan N, Aslam M. Design of a Control Chart Using Extended EWMA Statistic, Technologies. 2018;6(4):1-15.
- Mitra A, Lee KB, Chakraborti S. An Adaptive Exponentially Weighted Moving Average-type Control Chart to Monitor the Process Mean, European Journal of Operational Research. 2019;279(3):902-911.
- Arslan M, Anwar SM, Lone SA, Rasheed Z, Khan M, Abbasi SA. Improved Adaptive EWMA control chart for process location with applications in groundwater physicochemical parameters and glass manufacturing industry, PLoS ONE. 2022;17(8):e0272584.