
Research article · 2021 · Full text
International Journal of Agriculture and Food ScienceAnalysis of technical efficiency of rice production in Anambra State, Nigeria
Volume 3(1) · Pages 46–50 · DOI: 10.33545/2664844x.2021.v3.i1a.82 ↗
Research areasAgricultural Economics and PracticesEfficiency Analysis Using DEA
Abstract
Author-writtenTechnical efficiency of rice farmers in Anambra State, Nigeria using stochastic frontier production function was studied. Multistage random sampling techniques were used to select 120 rice farmers. Structured questionnaire complimented with oral interview were used to collect data from the respondents for the study. The result showed that the estimated level of technical efficiency was ranged between 24 % - 94 %. Also, the determinants factors to technical efficiency of the rice farmers were age of the farmers, level of education and extension services. The major constraints to rice production in the study area were pest and disease (92 %), poor access to credit (83 %), high cost of labour (67 %). Policy options aimed at enhancing farmers’ access to improved rice varieties, paddy, pesticides, and credit facilities and educational programs were proffered.
Summary
Source-checkedPlain-language reading of the full paper, prepared with AI and checked against the text. Each point links to the authors' own words.
Why it matters
- Rice is a prominent cereal crop in Nigeria, serving as both a critical cash crop and a key component of food security. View evidence ↗
- Despite production efforts, Nigeria faced a rice deficit of approximately 2.1 million metric tons in 2021, with production at 5.8 million tons against a consumption of 7.9 million tons. View evidence ↗
- Nigerian rice productivity is low, with actual yields ranging from 1.5-3.0 t/ha compared to a potential yield of 3.0-6.0 t/ha. View evidence ↗
The question
- The study aims to analyze the technical efficiency of rice farmers in Anambra State to better understand how they use their resources. View evidence ↗
What they did
- Data was collected using structured questionnaires focusing on socio-economic traits, production constraints, and the prices of inputs and outputs. View evidence ↗
- The study employed a Cobb-Douglas stochastic frontier production function to assess technical inefficiency. View evidence ↗
What they found
- The mean technical efficiency of rice farmers was 0.56, indicating that approximately 44% of potential output is lost due to inefficient resource use. View evidence ↗
- Technical efficiency among the sampled farmers ranged from a minimum of 0.24 to a maximum of 0.95. View evidence ↗
- Farmer age was found to be negatively related to output (coefficient -0.01611), suggesting that technical inefficiency increases as farmers age. View evidence ↗
- Education had a positive and significant effect on technical efficiency, with a coefficient of 0.34884. View evidence ↗
- Access to extension services was positively and significantly correlated with technical efficiency (coefficient 0.0627). View evidence ↗
- Farming experience was positively and significantly related to technical efficiency, with a coefficient of 0.0855. View evidence ↗
- The return to scale was 1.0711, indicating that farmers are in stage III of the production phase and are over-utilizing their resources. View evidence ↗
- The primary constraints to production were the high cost of improved inputs (92%) and poor access to credit (83%). View evidence ↗
What it means
- The authors recommend that government and NGOs implement policies to improve farmers' access to education, extension services, credit, improved rice varieties, and labor-saving tools. View evidence ↗
Visual summary
3 visualsIllustrations explain the paper; charts are replotted from the paper's own table values.
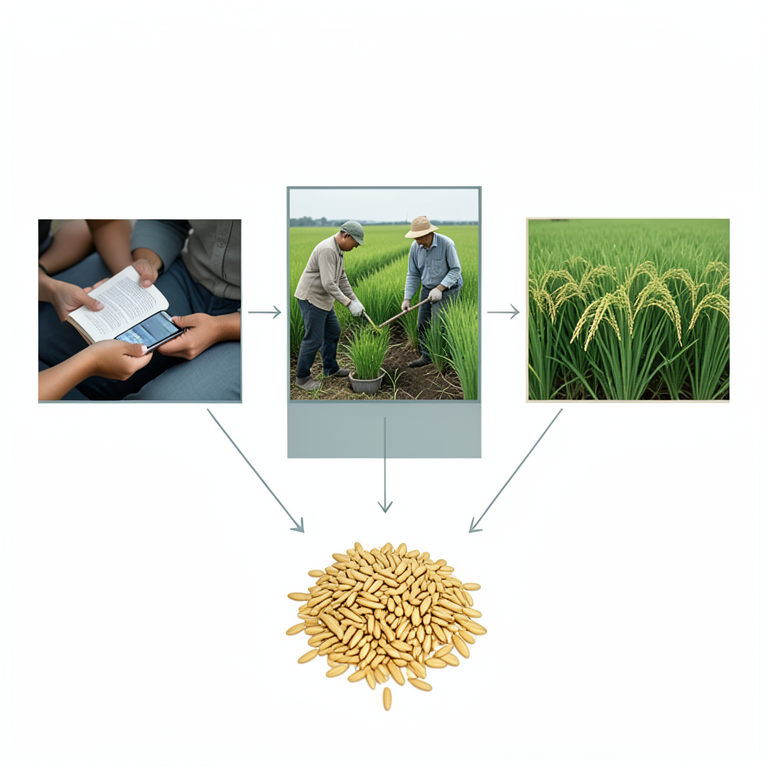
Drivers of Technical Efficiency
AI-generated conceptual illustration (Rice plants in a paddy field). It explains the idea and does not show study data.
View source evidence ↗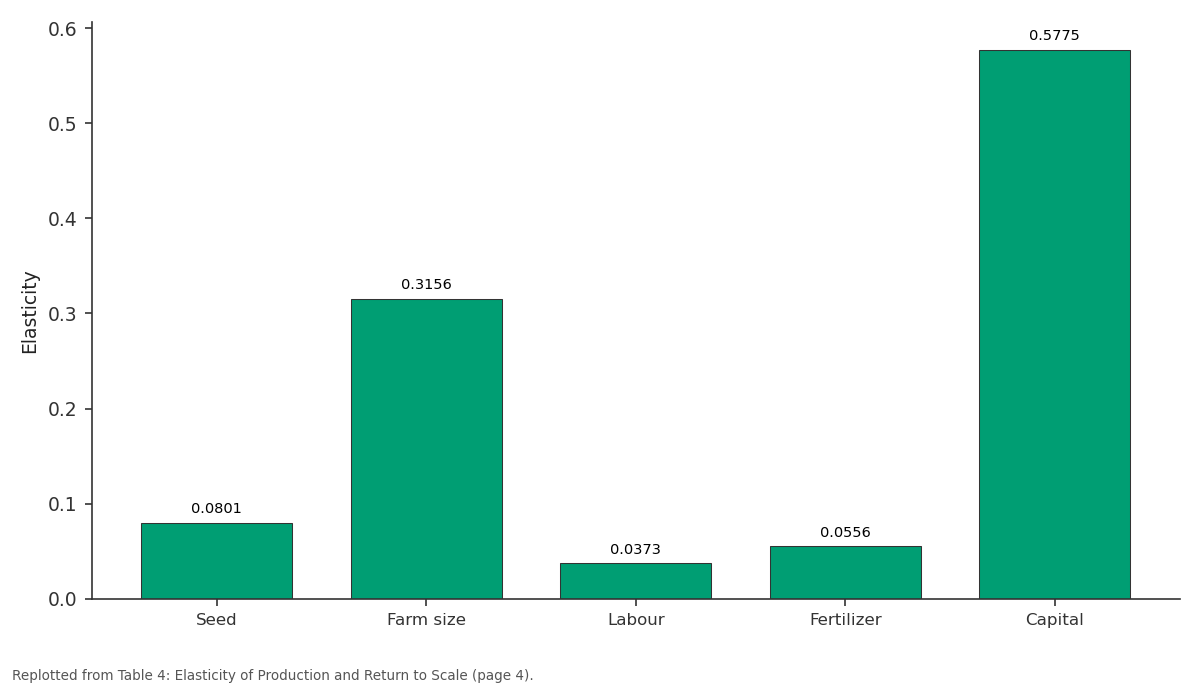
Elasticity: Seed vs Farm size vs Labour vs Fertilizer vs Capital
Replotted from Table 4 (page 4) of the original paper. Every bar is the paper's own table value.
View source evidence ↗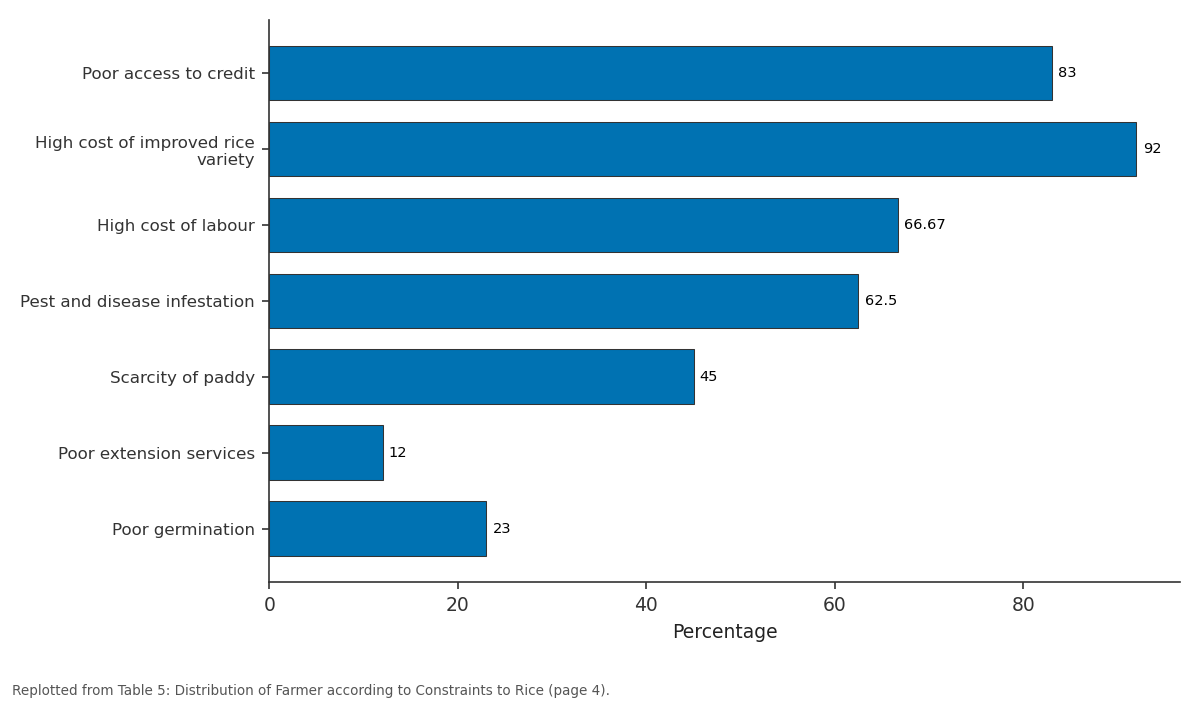
Percentage: Poor access to credit vs High cost of improved... vs High cost of labour vs Pest and disease... vs Scarcity of paddy
Replotted from Table 5 (page 4) of the original paper. Every bar is the paper's own table value.
View source evidence ↗Figures & tables
From the original paper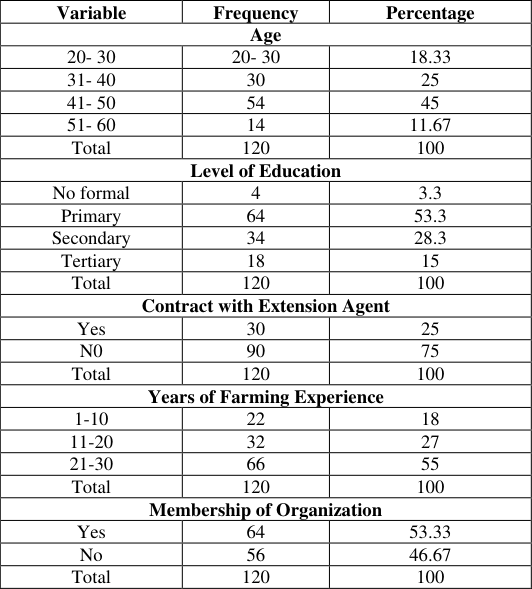 Table 1
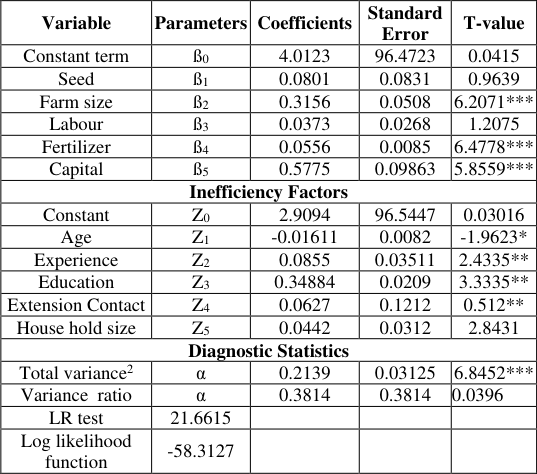 Table 2
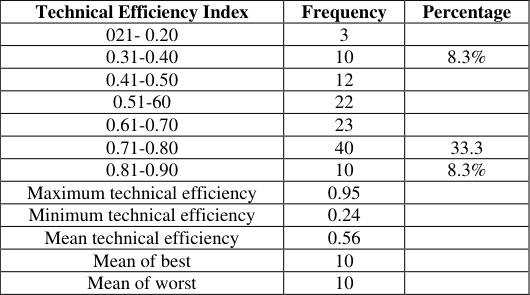 Table 3
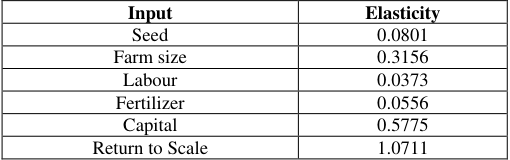 Table 4
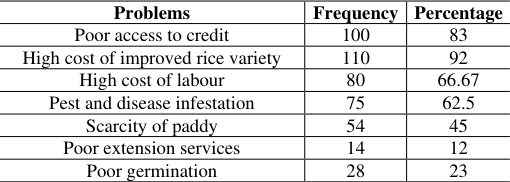 Table 5
Introduction
The roles of agriculture as engine room for economic prosperity of most countries in Sub-Saharan Africa, Nigeria inclusive are well documented (Ume and Nwaobiala, 2012 [24] , CBN, 2018 [4] , FAO, 2021) [9] . Agriculture according to Udemezue, (2019) and CBN, (2018) [4] is source of food, employment, raw materials for industries, poverty alleviation and human resource development. In Nigeria, among cereal crops produced in the crop production subsector of agriculture that had gained wide preeminence is rice (Shantha, et al. 2013 [18] ; CBN, 2018 [4] ; RIFAN, 2018 [17] ). Rice is an important food security and cash crop with smallholder farmers being the dominant farming population in most developing countries of the world (Udemezue, 2014) [20] . Globally, the three top rice-producing countries are China (148,032million metric tons) followed by India (116,016 million metric tons) and Indonesia (35,612 million metric tons), (FAO, 2021) [9] . Nigeria is the highest producer of rice in Africa with total annually output of 5.8 million tons in the year 2021 (FAO, 2022) [6] . Globally, rice is consumed by half of the human population. It has fastest growing consumption rate among all staple crops for several years now. For instance, in the 2021/2022 crop year, about 509.87 million metric tons of rice was consumed worldwide, up from 437.18 million metric tons in the 2008/2009 crop year (FAO, 2022) [6] . China is the highest consumer of rice in the world with about 154.9 million metric tons consumed in 2021/2022. This is followed by India (103.5 metric tons) in same period (FAO, 2022) [6] . In Nigeria, the average rice consumption is 34 kg (Udemezue, 2019) [21] . The nation's growing population, rising income of the population especially among the urban dwellers and easy to serve in the table could be responsible for increasingly consumption of the grain in most developing countries in recent times (CBN, 2018) [4] . The other uses of rice as noted by Hossain and Rahman, (2012) [11] are for industrial uses (beverages, roofing materials, flour and starch), livestock feed, medium for growing tropical mushroom and compost.
Despite successive Nigeria government programmers and policies inform of introduction of high yielding varieties supported by fertilizers, pesticides, irrigation and mechanized cultivation in order to attain self-sufficiency in rice production in Nigeria, yet, literatures revealed that the domestic rice production is not sufficient to satisfy the consumption of the ever nation's growing population. For instance, in the year 2021 according to Rice Farmers Association of Nigeria (RIFAN), (2018) [17] , Nigeria rice production was estimated at 5.8 million tons with annual consumption currently around 7.9million tons, leading to a deficit of about 2.1 million metric tons, which is either imported or smuggled into the country illegally. The low productivity of the nation's rice production and productivity in form of low rice yield range of 1.5-3.0 t/ha visà-vis a potential of 3.0-6.0 t/ha, could be as result of suboptimal water management, poor weed management, low adoption of modern varieties, low mechanization, pest and disease infestation, and land tenure (Ajibefun; et al; 2002 [2] ; Osajie, 2016 [22] ; CBN, 2018) [4] . The others reasons as asserted by Udemezue, (2019) [21] and Emma-Aja et al. (2021) [5] are reliance on rain-fed agriculture, smallholder land holding, low fertilizer application, and a weak agricultural extension system. The productivity of the farmers can be enhanced through fostering their efficiency in resource use, especially as relates to technical efficiency. Therefore, it becomes imperative to measure farmers' efficiency, since such intension could aid in gathering pertinent information for making a sound management decision in resource allocation to boost their productivity (Hossain and Islam, 2015) [10] . This study attempts to analyze the technical efficiency of rice farmers in the State in order to add to existing body of knowledge on farmers' resource use efficiency Specifically, the objectives of this study are to: (i) describe the respondents' socio-economic characteristics, (ii) estimate the technical inefficiency in rice production by the respondents and (iii) identify the constraints to rice production in the study area.
Materials and Methods
Materials and Methods
Study Area
Study Area
Method of Data Collection
Structured questionnaire was used to collect information on farmers' socio-economic characteristics, constraints to rice production, inputs and outputs prices.
Sampling Size and Sampling Technique
Multi-stage sampling techniques were used to select zones, Local Governments Areas (LGAs), towns and respondents. In the 1 st stage, three out of four agricultural zones of the state were purposively selected because of their intensity of rice production in those areas. The selected zones were Anambra, Aguata, and Awka. The second stage involved the random selection of two Local Governments Areas (LGAs) out of five from each zone. This brought to a total of six LGAs. In the third stage, two towns were randomly selected from each Local Governments Areas (LGA). This brought to a total of twelve towns. Finally, ten farmers were randomly selected from each of the towns from the lists of farmers compiled by the extension agents of the Anambra State Agricultural Development Programmed (ADP). This brought to a total of one hundred and twenty farmers for detailed study.
Method of Data Analysis
The objective 1 and 4 were captured using descriptive statistics such as percentages and means and frequency distribution table. The objective 2 was assessed using Cobb-Douglas stochastic frontier production function.
Model Specification Cobb-Douglas Stochastic Frontier Production Function.
The choice of the function is due to its advantages over the other functional forms. As well, it is widely used in frontier production study in most developing agriculture, (Okoye and Onyenweaku, 2007) [15] . The Cobb-Douglas frontier production is specified as follows:
Where, the subscript I indicates the ith farmers in the sample, in= natural logarithm, Y i = output of rice (kg), X 2 = Farm size (hectares), X 3 = Labour (man hours), X 4 = Fertilizer (kg), X 5 = Capital input (N), V i = random errors, U i = technical inefficiency effects predicted by the model. Determinants of technical inefficiency, (U i ) could be achieved using the following model which is formulated and estimated jointly with stochastic frontier model in a maximum likelihood estimated procedure using the computer software frontier version 4.1 (Ajibefun, et al., 2002) [2] .
Where, U i = technical inefficiency effect, Z 1 = the age of the itch farmers, Z 2 = years of farming experience (Years), Z 3 1 show that 43.33 % of the respondents were less than 41 years old, while 56.67 % were above 40 years. The implication is that most respondents are aged and may not be able to withstand the rigors and stains in rice farming. The finding of Ume and Nwaobiala, (2012) [24] concurred to above assertion. Morever, 96.7 % of the respondents had formal education, while 3.3 % did not have. FAO, (2020) [8] reported that education helps to unlock the natural talents and inherent enterprising qualities of the farmer As well, education and training are important factors that could enhance farmer's ability to evaluate, understand and accept new innovation (Ume, et al. 2012) [24] . The result also showed that 75% of the respondents had no contract with extension workers, while 25% had contract. This implies that most farmers studied had poor extension outreach, with resultant effects of being denied the necessary access to improved varieties and technical assistance associated with extension services in order to improve their production (Emma-Ajah, et al. 2021) [5] . The table further revealed that 55% of the farmers studied had number of years of farming experience of 21-30 years, while 27 % and 18 % of the respondents had farming experience of 11-20 and 1-10 years respectively. The aftermath of wealth of farming experience as noted by Okoye and Onyenweaku, (2007) [15] is to enhance the farmer's capacity of maximizing the output and profit at minimum cost. This result collaborated with the finding of Ume, et al; (2016) [22] , who reported that farming experience enhances farmers' efficient use of scarce resources. Also, 53.33 % of the sampled farmers were members of organization, while 46.67 were not. This result is in conformity with Ogbonna (2018) [13] finding. He reported that members of cooperative through having access to information on improved innovations and capacity building and training by cooperative, leads to their improved farm productivity through enhanced technical efficiency Table 2 revealed that the estimated total variance (0) was statistically significant at 1 % level, indicating goodness of fit and the correctness of the specified distribution assumption of the composite error term. The estimated gamma (y) is a measure of the variance parameter and it ranges from 0 to 1.
| Variable | Parameters | Coefficients | Standard Error | T-value |
|---|---|---|---|---|
| Constant term | ß0 | 4.0123 | 96.4723 | 0.0415 |
| Seed | ß1 | 0.0801 | 0.0831 | 0.9639 |
| Farm size | ß2 | 0.3156 | 0.0508 | 6.2071*** |
| Labour | ß3 | 0.0373 | 0.0268 | 1.2075 |
| Fertilizer | ß4 | 0.0556 | 0.0085 | 6.4778*** |
| Capital | ß5 | 0.5775 | 0.09863 | 5.8559*** |
| Inefficiency Factors | ||||
| Constant | Z0 | 2.9094 | 96.5447 | 0.03016 |
| Age | Z1 | -0.01611 | 0.0082 | -1.9623* |
| Experience | Z2 | 0.0855 | 0.03511 | 2.4335** |
| Education | Z3 | 0.34884 | 0.0209 | 3.3335** |
| Extension Contact | Z4 | 0.0627 | 0.1212 | 0.512** |
| House hold size | Z5 | 0.0442 | 0.0312 | 2.8431 |
| Diagnostic Statistics | ||||
| Total variance2 | α | 0.2139 | 0.03125 | 6.8452*** |
| Variance ratio | α | 0.3814 | 0.3814 | 0.0396 |
| LR test | 21.6615 | |||
| Log likelihood function | -58.3127 |
Table text extracted from the original PDF; superscript letters are shown inline. The original table image is below.
View original table image
Results and Discussion
From the Table, the variance ratio is estimated to be 0.3814 and is statistically significant at 1% level of probability. This can be interpreted that over 38.14 % of random variation in rice production among the sampled farmer, is explained by inefficiency factors of the farmers which could be from their socio-economic and institutional characteristics and management practices. The result showed that the coefficients of farm size, fertilizer and capital inputs were positive and significant at 1 % level of probability. This implies that any increase in farm size, fertilizer and capital by 1 % would result to a 0.3156 %, 0.556 % and 0.5775 % increase in rice output in the study area.
The estimated determinant of technical efficiency in rice production is also presented in the same table. The result shows that the age (-0.01611) of the farmer is negatively related to the farmers' output and significant at 10% alpha level. This implies that as farmer is advancing in age, his/her technical inefficiency increases. This finding is in consonance with Okoye and Onyenweaku, (2007) [15] and Ume, et al; (2016) [22] , who opined that age variable picks up the effects of physical strength as well as farming experience of the farmer. Furthermore, aged household heads according to Hossain, and Rahman, (2012) [11] could be conservative to try out new and efficient technologies/ techniques. More so, the estimated coefficient of education (0.34884) was positively signed and significant at 5 % risk level. Hasnain, Hossain, and Islam, (2015) [10] finding concurred with aforesaid assertion. They observed that farm level technical efficiency can be increased by additional investment in education including schooling, training and orientation.
Additionally, education attainment boosts farmer's ability to develop, explain and appraise valuable information and in enhancing labour quality, hence improving his or her technical efficiency. The above finding disagreed with the result of Ayodele, et al. (2016) [3] , who noted that high level of education diminishes the aspiration for farming and therefore the highly educated farmers probability devote much of their time on salaried employments instead. Also, in line to a priori expectation, the coefficient of extension service (0.0627) was significant and positively correlated with technical efficiency in rice production. This result is consistent with those of Ume, et al. (2016) [22] in Nigeria; Hasnain; et al.
(2015) [10] in Bangladesh, and Shantha, Ali and Bandara, (2013) [18] in Sri Lanka. However, this result differs from that of Hossain and Rahman, (2012) [11] whose result showed a negative relationship between extension services and technical efficiency in rice production in India. Extension services aids in enhancing farmer's resource use efficiency, adoption of improved technology and providing technical assistance on the new technologies to the farmers (Shantha, et al. 2013) [18] . Additional so, farming experience (0.0855) was positive and significantly related to technical efficiency. The more experienced a farmer is, the more proficient his decision making processes and the more he or she will be inclined to taking risks as relates to use of modern innovations. This result concurred with several studies (Okoye and Onyenweaku, 2007 [15] ; Shantho, et al; 2013, Ume, et al. 2018) [23] , however, differs with numerous literatures (Ajibefun and Aderinola, 2004 [1] , Osage, 2016; Emma-Aja, et al. 2021) [5] . Table 3 showed that the mean technical efficiency level among rice farmers was 0.56 %. This implies that on the average about 44 % of potential output is lost due to inefficiency in resource utilization. In the short-run, there is scope for increasing rice production by 44 % by adopting the technology and technique in resource utilization by efficient rice farmers. The wide technical efficiency indices differential among farmers is an indication of the need for efficiency improvement in order to become the most efficient farmer. An average rice farmer requires, 49.52 % cost saving to attain the status of the most efficient rice farmer among the sampled best 10 category, while the least performing farmer would need 52.41 % to become the most efficient rice farmer among the worst sampled farmer Table 4 showed the production elasticity's and return to scale. The regression coefficients in the Cobb Douglas stochastic production frontier function are the elasticity and their sums indicate the return to scale (Ajibefun, et al; 2002) [2] . The sum production elasticity (return to scale) have a co efficiency of 1.0711, implying that the rice farmers are in stage III of production phase. This is necessitated by high and positive coefficient of capital. The farmers in the study area over utilized their resources, since their elasticity were less than 1. This means that rice framers in Anambra State had not optimally utilized and allocated most of their inputs. The constraints to rice production is presented and discussed in table 5. Table 5 shows that most (92 %) of the respondents encountered the problem of high cost of improved inputs. High cost of improved inputs has negative implication to agricultural development as substantial number of farmers resorted to the use of local varieties which has genetically broken down, resulting in poor yield (Onyenweaku, et al; 2010; Ume, et al, 2018) [23] . This was followed by poor access to credit, which accounted for 83% of the total sampled population in the study area. The poor farmers' access to credit is a negative sign to agricultural development. Credit is a vital catalyst in farming, as it helps to procure production inputs and in payment of hired labour (Ume and Nwaobiala, 2012) [24] . The least of the respondents (12 %) complained about poor access to extension services. The poor motivation of the change agents by government affects their effectiveness and efficiency in performing their duties (Ogbonna and Osondu, 2018) [13] .
| Problems | Frequency | Percentage |
|---|---|---|
| Poor access to credit | 100 | 83 |
| High cost of improved rice variety | 110 | 92 |
| High cost of labour | 80 | 66.67 |
| Pest and disease infestation | 75 | 62.5 |
| Scarcity of paddy | 54 | 45 |
| Poor extension services | 14 | 12 |
| Poor germination | 28 | 23 |
Table text extracted from the original PDF; superscript letters are shown inline. The original table image is below.
View original table image
| Input | Elasticity |
|---|---|
| Seed | 0.0801 |
| Farm size | 0.3156 |
| Labour | 0.0373 |
| Fertilizer | 0.0556 |
| Capital | 0.5775 |
| Return to Scale | 1.0711 |
Table text extracted from the original PDF; superscript letters are shown inline. The original table image is below.
View original table image
| Technical Efficiency Index | Frequency | Percentage |
|---|---|---|
| 021- 0.20 | 3 | |
| 0.31-0.40 | 10 | 8.3% |
| 0.41-0.50 | 12 | |
| 0.51-60 | 22 | |
| 0.61-0.70 | 23 | |
| 0.71-0.80 | 40 | 33.3 |
| 0.81-0.90 | 10 | 8.3% |
| Maximum technical efficiency | 0.95 | |
| Minimum technical efficiency | 0.24 | |
| Mean technical efficiency | 0.56 | |
| Mean of best | 10 | |
| Mean of worst | 10 |
Table text extracted from the original PDF; superscript letters are shown inline. The original table image is below.
View original table image
Conclusion and Recommendations
The results of this study show that the technical inefficiency of the rice farmers in study area were affected by their age, educational level and extension services. More so, the production rice in the study were affected by poor access to credit, high labour cost, poor access to improve rice varieties among others. The policy options by concerned government agencies and non-Governmental Organization (NGO) aimed at enhancing farmers' access to educational programmers, extension services, credit facilities, improved rice varieties and labour saving devices were proffered.
Figures and tables from the paper
| Variable | Frequency | Percentage |
|---|---|---|
| Age | ||
| 20- 30 | 20- 30 | 18.33 |
| 31- 40 | 30 | 25 |
| 41- 50 | 54 | 45 |
| 51- 60 | 14 | 11.67 |
| Total | 120 | 100 |
| Level of Education | ||
| No formal | 4 | 3.3 |
| Primary | 64 | 53.3 |
| Secondary | 34 | 28.3 |
| Tertiary | 18 | 15 |
| Total | 120 | 100 |
| Contract with Extension Agent | ||
| Yes | 30 | 25 |
| N0 | 90 | 75 |
| Total | 120 | 100 |
| Years of Farming Experience | ||
| 1-10 | 22 | 18 |
| 11-20 | 32 | 27 |
| 21-30 | 66 | 55 |
| Total | 120 | 100 |
| Membership of Organization | ||
| Yes | 64 | 53.33 |
| No | 56 | 46.67 |
| Total | 120 | 100 |
Table text extracted from the original PDF; superscript letters are shown inline. The original table image is below.
View original table image
References
18 in the original paper- Ajibefun A, Aderinola A. Determinates of technical efficiency and policy implication in traditional agricultural production, empirical study of Nigeria Food Crops Farmers" Final Report presentation of bi-annual research workshop at African Economic Research Consortium, Mairobui Kenya; 2004.
- Ajibefun IA, Battese GE, Daramola AG. Determinants of technical efficiency in smallholder food crop farming: application of stochastic frontier production function. Q. J. Int. Agric. 2002;41(3):225-240.
- CBN. Central Bank of Nigeria annual report and statement of account for the year end 31 st Dec, 2017; c2018.
- Emma-Ajah JA, Ume SI, Ucha SO, Chukwu M. Economic Efficiency of Small holder Swamp Rice Farmers across Gender in Anambra State, Nigeria. An application of Stochastic Production Frontier Function. International Journal of Research and Innovation in Applied Science (IJRIAS). 2021 November;4(8):28 | ISSN 2454-6194. | www.rsisinternational.org.
- FAO. The state of food scarcity in the world, 4 th edition. Fless, Karen, Weir, Roberts M, Stoney, Samuel G. (1998) the Carolina Rice Kitchen. The African Connection University of Souyth Caroline press; c2020.
- Hasnain N, Hossain E, Islam K. Technical efficiency of BORO rice production in Meherpur district of Bangladesh: A Stochastic Frontier Approach. American Journal of Agriculture and Forestry. 2015;3(2):31-37.
- Hossain ME, Rahman Z. Technical efficiency analysis of rice farmers in Naogaon district: An application of the stochastic frontier approach. Journal of Economics and Development Studies. 2012;1(1):1-2.
- Ogbonna SI, Osondu CK. Analysis of supply structure and trends of formal funding of agriculture in Nigeria (19922012). Scientific Papers Series, "Management Economic Engineering in Agriculture and Rural development. 2018;18(1):277-285, 2018. Print ISSN: 2284-7995, EISSN: 2285-3952.
- Ogonna SI. Effect of Adoption of improved cassava production Technologies on poverty Status of farmers in Abia State, Nigeria. "International Journal of Agriculture and Rural development (IJARD)". ISBN: 1595-9716. 2018;21(2):3783-3793,
- Okoye BC, Onyenweaku CE. Economic Efficiency of Small Holder Cocoyam Farmers in Anambra State Nigeria. A Trans. Log Stochastic Frontier Cost Function Approach. Mend well Journals. 2007;4:535-546.
- Osagie C. Rice importation ban: Disregard US report, FG urged; c2016. Available from: http://www.thisdaylive.com/articles/2015-rice-importationban-disregard-us-report-fg-urged/168731/ [Accessed 17/05/14].
- Rice Farmers' Association of Nigeria (RIFAN). (2018) Rice production in Nigeria increases to 5.8 m tones. RIFAN Annual Report; c2019.
- Shantha AA, Ali ABGH, Bandara RAG. Technical efficiency of paddy farming under major irrigation conditions in the dry-zone of Sri Lanka: A parametric approach. Australian Journal of Basic and Applied Sciences. 2013;7(6):104-112..
- Tijani AA. Analysis of the technical efficiency of rice farms in Ijesha Land of Osun State, Nigeria. Agrekon. 2006;45(2):16-25.
- Udemezue JC. Analysis of rice production and consumption trends in Nigeria. Journal of Plant Sciences and Crop Protection. 2019;1(3):23-38.
- Ume SI, Ezeano CI, Eluwa AN, Ebe F. Analysis of Technical Inefficiency in Rice Production among Farmers in Ezza South LGA of Ebonyi State of Nigeria (Application of Stochastic Frontier Production). Archives of Current Research International. 2016;4(3):261-269.
- Ume SI, Ezeano CI, Edeh ON, Udefi IO. Resource Use Efficiency of Upland Rice Farmersin Ivo Local Government Area of Ebonyi State Asian Research Journal of Arts & Social Sciences. Articleno. ARJASS. 27426. ISSN: 2456-4761. 2018;7(2):1-10.
- Ume SI, Nwaobiala CU. Economic Efficiency of upland rice farmers across gender in Anambra Agricultural Zone of Anambra State. Nigeria Agricultural Journal. 2012;41(2):37-45.