
Research article · 2019 · Full text
International Journal of Agriculture and Food ScienceEffect of biodiversity conservation on livelihood of rural dwellers in Onaara Local Government Area of Oyo state
Volume 1(2) · Pages 11–15 · DOI: 10.33545/2664844x.2019.v1.i2a.14 ↗
Research areasConservation, Biodiversity, and Resource ManagementEnvironmental Conservation and ManagementAquatic Ecosystems and Biodiversity
Abstract
Author-writtenBiodiversity has proven to be an important source of traditional medicines for people in developing countries, particularly those in remote and normally more poverty-stricken areas of the developing world where access to formal health care is limited. Therefore, Effect of biodiversity conservation on livelihood of rural dwellers in OnaAra Local Government Area of Oyo state was investigated. A multi-stage sampling procedure was used through well structure questionnaire and interviews to gather collect information from 150 rural dweller. Data were analyzed using frequency counts, percentage and means and Chi-square at 0.05% level of significance. The result of analysis revealed that most (54.1%) of the respondents are males and they are in their active age, married with majority (51.4%) had secondary education, with about 1-10years of experience of biodiversity conservation was recorded as the highest percentage. Furthermore, the result revealed on the statement of livelihoods that 56.8%of physical assets is the income generated from the use of hire labor on the farm, 86.5% natural assets on biodiversity conservation and also in human assets, mostly 75.7% of biodiversity conservation assist the dwellers to take care of their families. Chi-square analysis revealed that, among socio-economic characteristics of the respondents, Conclusively, the result reveals that respondents had high benefits from biodiversity conservation with increase income of 62.2%, and 60% of the respondents have moderate benefits that are derive from biodiversity conservation which has led to employment opportunities for most people. It is therefore recommended that Government should put in place policies and laws that will govern farmers, residents that will promote preservation of biodiversity, also Government should construct good roads that will enhance recreational benefit rendered by conservation this will lead to employment opportunities and other benefit.
Summary
Source-checkedPlain-language reading of the full paper, prepared with AI and checked against the text. Each point links to the authors' own words.
Why it matters
- Biodiversity is a critical source of traditional medicine for people in developing countries, especially in remote, impoverished areas with limited formal healthcare. View evidence ↗
- Conserving biodiversity provides economic benefits and supports essential services like soil protection and water quality. View evidence ↗
The question
- The study aimed to investigate how biodiversity conservation affects the livelihoods of rural residents in the Ona Ara Local Government Area of Oyo state. View evidence ↗
What they did
- The researchers used a multi-stage sampling procedure to select participants from the Ona Ara local government area, which was chosen for its high level of farming activity. View evidence ↗
- The final sample size consisted of 148 respondents, including both crop and livestock farmers. View evidence ↗
- Data were collected via structured questionnaires and analyzed using frequency distributions, percentages, means, Chi-square tests, and Pearson Product Moment Correlation (PPMC). View evidence ↗
What they found
- The majority of respondents were male (54.1%), had a secondary education (51.4%), and possessed 1-10 years of experience in biodiversity conservation (51.4%). View evidence ↗
- A high level of benefit from the conservation of plants and animals was reported by 64.2% of the respondents. View evidence ↗
- Increased income was identified as a high benefit of biodiversity conservation by 62.2% of the participants. View evidence ↗
- Employment opportunities were viewed as a moderate benefit by 60.8% of the respondents. View evidence ↗
- Regarding physical assets, 56.8% of respondents mostly used income generated from biodiversity conservation to hire labor for their farms. View evidence ↗
- A large majority (86.5%) of respondents agreed that biodiversity conservation makes the environment look natural. View evidence ↗
- Biodiversity conservation assisted 75.7% of dwellers in taking care of their families. View evidence ↗
- Chi-square analysis showed significant relationships between the level of livelihood and all tested socio-economic characteristics, including sex, age, education, marital status, household size, occupation, experience, and income. View evidence ↗
- PPMC analysis indicated no significant relationship between the benefits derived from biodiversity conservation and the overall livelihood of the respondents (r = -0.160, p = 0.052). View evidence ↗
What it means
- The authors recommend that the government implement policies and laws to promote biodiversity preservation and construct better roads to enhance recreational benefits and employment. View evidence ↗
Visual summary
2 visualsIllustrations explain the paper; charts are replotted from the paper's own table values.
Livelihood Benefits Flow
AI-generated conceptual illustration (Rural Nigerian landscape with diverse flora and fauna). It explains the idea and does not show study data.
View source evidence ↗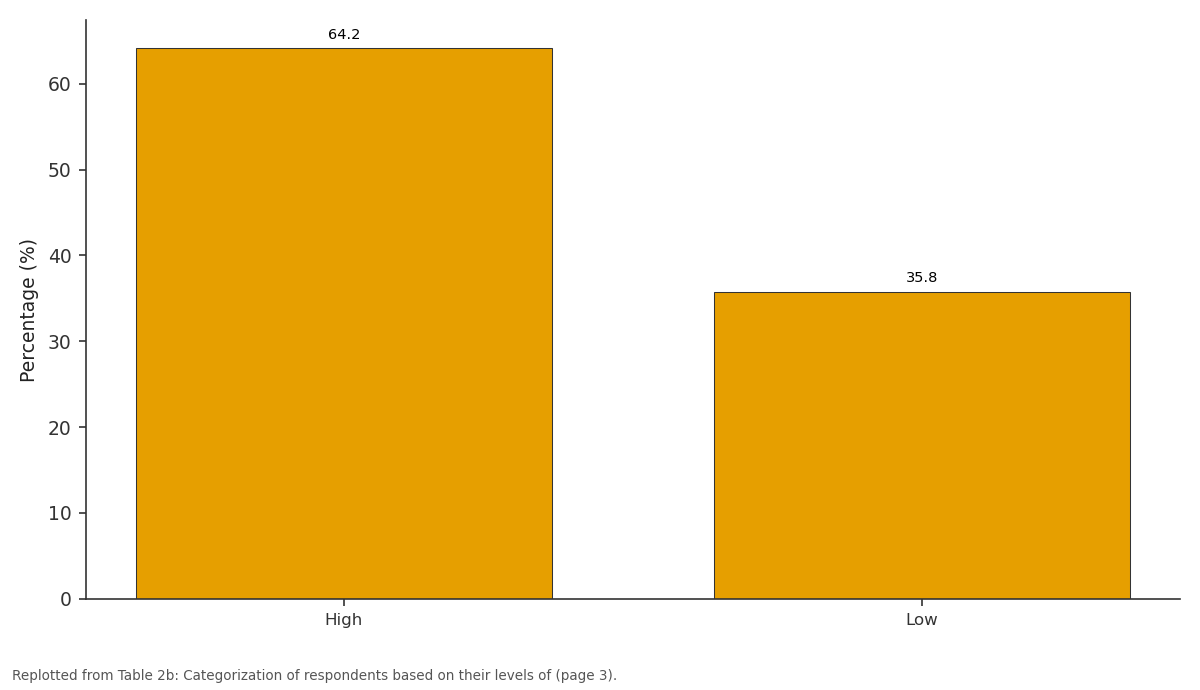
Percentage (%): High vs Low
Replotted from Table 2B (page 3) of the original paper. Every bar is the paper's own table value.
View source evidence ↗Figures & tables
From the original paper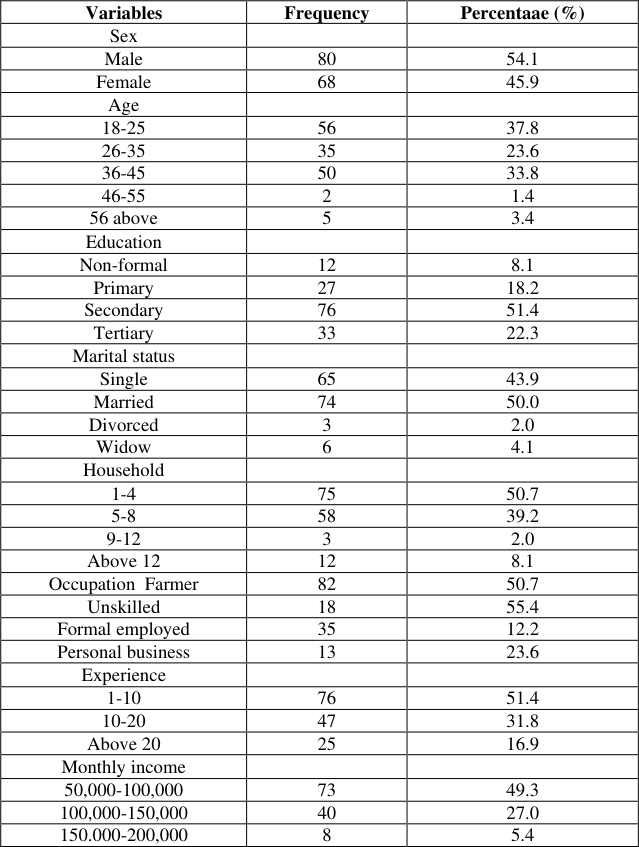 Table 1
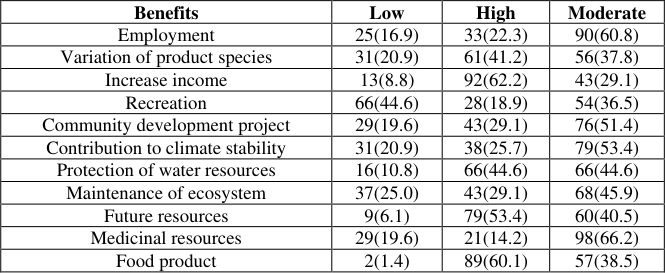 Table 2A
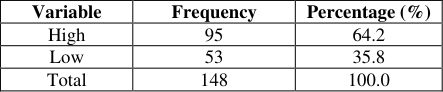 Table 2B
 Table 3A
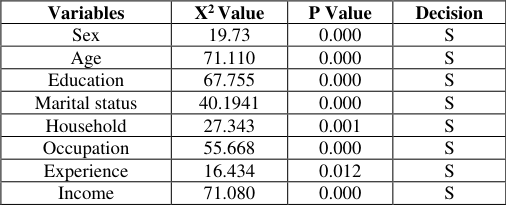 Table 4
 Table 3B
 Table 5
Introduction
Biodiversity is the diversity number and variety of plant and animal life within a region of biodiversity is the biological diversity agriculture includes the variety of the whole species present on earth. Biodiversity conservation can be a valuable option for poor people not only in terms of income opportunities, but also for diet diversification, community involvement and health by ( [12,15,16] and for the sustainable management of agricultural systems (Frison et al 2011; Mijatovic et al 2012) [7] . Biodiversity conservation has come to be seen as a variant of sustainable community development particularly in the rural area of developing countries (Buta et. al, 2014; Gurmey et al, 2014; Meiby et al, 2014) [2] . Thus, biodiversity conservation can be a variable alternative to rural developing countries with the coming; the new government adopted various strategies aimed towards developing in rural area. Livelihood is a set of activities involving, securing fodder, medicine and the capacity to acquire above necessities working either individually by using endowments of the self, household on a sustainable basis with dignity (Bain et al., 2014) [1] . Farmers around the worlds are facing competing pressure to grow more food while preserving the world's biodiversity to succeed, agricultural and biodiversity efforts must walk hand to hand and sharing knowledge of agricultural role in preserving biodiversity stewardship programmed for farmers and government mechanisms for incentives biodiversity by Ray Jordan, self-help Africa (Wilshusen et al., 2002). The challenges of conserving ecosystem while ensuring future food security means that the roles of farmers is more crucial than ever like biodiversity, agricultural benefit from fertile soil, fresh water and natural predator. The important of biodiversity conservation is that it provides economic benefit to people which in water quality soil, protection, equalization of climatic environmental, monitoring, scientific research. It is against this backdrop that this research investigated the extent of effect of biodiversity conservation on livelihood of rural dwellers in OnaAra Local Government Area of Oyo state
Specific objectives
The specific objectives of this study include to: identify socio-economic characteristics of respondents in the study area. access the benefit derived from biodiversity conservation. identify the biodiversity conservation on their livelihood in the study area.
Hypothesis of the study
The hypothesis stated in the null form is tested:
International Journal of Agriculture and Food Science
Ho1 -There is no significant relationship between selected socioeconomic characteristics of the respondents and their level of livelihood in the study area. Ho2 -There is no significant relationship between benefits derived and their level of livelihood in the study area.
Materials and Methods
Materials and Methods
Sampling Procedure and Sample size
A Multi-stage sampling procedure was used to select respondents for the study. Ona-ara local government area was purposively selected for this study due to the abundant farming activities in the Area. From the 11 wards, 25% were randomly selected, from which each cell/communities (Ilaji-,Olubode, Amodu-Apapa, Olode-Buremo.) 50% of the respondents were purposively selected due to the population of both livestock and crop farmers which give a total of one hundred and forty-eight (148) respondents used as sample size for the study.
Analysis of data
Information extracted from well structured questionnaires was analyzed with both descriptive analysis and inferential statistical tools using, frequency distribution, percentage (%), mean, and hypothesis were analyzed using chi-square, Pearson Product Moment Correlation (PPMC). The result of analysis in table 1 showed the socio-economic characteristic of the respondents that males has a higher percentage of 54.1%, while the females were 45.9%. This is in line with Feresu, 2010 [6] and Makindi, 2010 [10] From the table 2a, result of analysis revealed the benefits derived by biodiversity conservation, it was observed that increase in income was rated 62.2% as one of a high benefit for biodiversity conservation. This agrees with (Mellor 2002) that biodiversity conservation tends to improve the quality of life of many of the world's poor. 60.8% of the respondents' derived moderate from biodiversity conservation; employment opportunities. This confirmed by (Elizabeth, 2003) that employment engagement in conservation activities offers many opportunities to building, such as organizational skills, learning to cope with new situations and to contribute to important conservation. 44.6% of the respondents indicate that benefit derived from recreation is low, this agrees with (Lan, 2006) that this represent an estimate of the benefit people enjoy from visiting this sites, predominately for recreation value of biodiversity conservation. Furthermore the medicinal resources was also rated 66.2% as one of the moderate benefits from biodiversity conservation. This also confirm by (EPA, 2013) that biodiversity has greatly contributed to modern medicine and advancement in human health research and treatment. Also 60.1% of the respondents' benefits from food production from biodiversity conservation, this agrees with (Groom, 2006) that biodiversity supports food security and sustained livelihoods through over all genetic diversity. Above mean value = High, below mean value= low (mean=25.1) From the categorization table 2b, the levels of benefit derived from biodiversity conservation of plants and animal is low at 35.8% and high at 64.2%. This implies that the benefit derived from biodiversity conservation by the respondent in the study area is high. This agree (Dublin, 2008) said that categorization of benefit rank in a high-level biodiversity also ensure that we are supply with a very important contribution that which made by biodiversity to human welfare. The result in table 3a shows that 56.8% of the physical assets; income generated is used to hire labour on the farm, 38.5% rarely used for building structure and 44.6% of the physical assets are not used house rent or rent on the farm. This was in agreement with Weber, (2003) that it is possible to express many physical assets as quantities; there is no established unit for measure the condition quality of biodiversity and ecosystems.
| Variables | Frequency | Percentaae (%) |
|---|---|---|
| Sex | ||
| Male | 80 | 54.1 |
| Female | 68 | 45.9 |
| Age | ||
| 18-25 | 56 | 37.8 |
| 26-35 | 35 | 23.6 |
| 36-45 | 50 | 33.8 |
| 46-55 | 2 | 1.4 |
| 56 above | 5 | 3.4 |
| Education | ||
| Non-formal | 12 | 8.1 |
| Primary | 27 | 18.2 |
| Secondary | 76 | 51.4 |
| Tertiary | 33 | 22.3 |
| Marital status | ||
| Single | 65 | 43.9 |
| Married | 74 | 50.0 |
| Divorced | 3 | 2.0 |
| Widow | 6 | 4.1 |
| Household | ||
| 1-4 | 75 | 50.7 |
| 5-8 | 58 | 39.2 |
| 9-12 | 3 | 2.0 |
| Above 12 | 12 | 8.1 |
| Occupation Farmer | 82 | 50.7 |
| Unskilled | 18 | 55.4 |
| Formal employed | 35 | 12.2 |
| Personal business | 13 | 23.6 |
| Experience | ||
| 1-10 | 76 | 51.4 |
| 10-20 | 47 | 31.8 |
| Above 20 | 25 | 16.9 |
| Monthly income | ||
| 50,000-100,000 | 73 | 49.3 |
| 100,000-150,000 | 40 | 27.0 |
| 150.000-200,000 | 8 | 5.4 |
Table text extracted from the original PDF; superscript letters are shown inline. The original table image is below.
View original table image
Results and Discussion
Results and Discussion
Natural assets
The result in table 3a also shows that 86.5% agree biodiversity conservation make the environment look natural, 45.35%, rarely depends on processed food, while 33.8% disagree with biodiversity conservation to prevent extension of both plant and animal species. This is in line with Teeb (2011) [18] that in essence biodiversity is a measure of the health of nature assets.
Human assets
The result furthers indicated that 75.7% of biodiversity conservation assist the dweller to take care of the family i.e. it is not time consuming and more income generate, while 9.5% is lowest of income generated. This is in tandem with Gretchen (2018) that consideration assumed that biodiversity supplies society with a stream of vital benefits or services without which human life would cease to exist The result in table 5 shows that there is no significant relationship between benefit (r = -0.16%, p > 0.052) and livelihood from the respondents, this implies that benefit derive from biodiversity conservation correspond to the livelihood of rural dwellers, which shows that as biodiversity conservation does not correlate with the benefits on livelihood of the respondents. This agrees by (Chigonda, 2014) that other conservation approaches such as private protected area can achieve similar if not better and livelihood impacts on surrounding communities.
Conclusion and Recommendations
The study revealed that most of the respondents are males and they are in their active age, married with majority secondary education, had about 1-10 years of experience of biodiversity conservation was recorded as the highest percentage of years by the respondents. Furthermore, the result revealed on the statement of livelihoods that 56.8%of physical assets is the income generated from the use of hire labor on the farm, 86.5% natural assets on biodiversity conservation and also in human assets, mostly 75.7% of biodiversity conservation assist the dwellers to take care of their families. Conclusively, the result reveals that respondents had high benefits from biodiversity conservation with increase income of 62.2%, and 60% of the respondents have moderate benefits that are derive from biodiversity conservation which has led to employment opportunities for most people. It is therefore recommended that Government should put in place policies and laws that will govern farmers, residents that will promote preservation of biodiversity, also Government should construct good roads that will recreational benefit rendered by conservation this will lead to employment opportunities and other benefit.
Figures and tables from the paper
| Benefits | Low | High | Moderate |
|---|---|---|---|
| Employment | 25(16.9) | 33(22.3) | 90(60.8) |
| Variation of product species | 31(20.9) | 61(41.2) | 56(37.8) |
| Increase income | 13(8.8) | 92(62.2) | 43(29.1) |
| Recreation | 66(44.6) | 28(18.9) | 54(36.5) |
| Community development project | 29(19.6) | 43(29.1) | 76(51.4) |
| Contribution to climate stability | 31(20.9) | 38(25.7) | 79(53.4) |
| Protection of water resources | 16(10.8) | 66(44.6) | 66(44.6) |
| Maintenance of ecosystem | 37(25.0) | 43(29.1) | 68(45.9) |
| Future resources | 9(6.1) | 79(53.4) | 60(40.5) |
| Medicinal resources | 29(19.6) | 21(14.2) | 98(66.2) |
| Food product | 2(1.4) | 89(60.1) | 57(38.5) |
Table text extracted from the original PDF; superscript letters are shown inline. The original table image is below.
View original table image
| Variable | Frequency | Percentage (%) |
|---|---|---|
| High | 95 | 64.2 |
| Low | 53 | 35.8 |
| Total | 148 | 100.0 |
Table text extracted from the original PDF; superscript letters are shown inline. The original table image is below.
View original table image
| Physsical Assets | Mostly | Rarely | Not at All |
|---|---|---|---|
| Income generate from biodiversity | 52 (35.1) | 61 (41.2) | 35(23.6) |
| Conservation is used for farm tools. | |||
| Income generated is used for building structure on the farm. | 30 (20.3) | 57 (38.5) | 61(41.2) |
| Income generated used to hire labour on the farm | 84 (56.8) | 24 (16.2) | 40(27.0) |
Table text extracted from the original PDF; superscript letters are shown inline. The original table image is below.
View original table image
| Variables | X2 Value | P Value | Decision |
|---|---|---|---|
| Sex | 19.73 | 0.000 | S |
| Age | 71.110 | 0.000 | S |
| Education | 67.755 | 0.000 | S |
| Marital status | 40.1941 | 0.000 | S |
| Household | 27.343 | 0.001 | S |
| Occupation | 55.668 | 0.000 | S |
| Experience | 16.434 | 0.012 | S |
| Income | 71.080 | 0.000 | S |
Table text extracted from the original PDF; superscript letters are shown inline. The original table image is below.
View original table image
| Variables | Frequency | Percentage% |
|---|---|---|
| High | 62 | 41.9 |
| Low | 86 | 58.1 |
| Total | 148 | 100.0 |
Table text extracted from the original PDF; superscript letters are shown inline. The original table image is below.
View original table image
References
19 in the original paper- Bain RES, Wright, JA, Christenson E, Bartram JK. Rural urban inequalities in post targets and indicators for drinkingwater. Science of the Total Environment. 2015; 490:509513.
- Buta N, Holland SM, Kaplanidou K. Local communities and protected areas: the mediating role of place attachment for pro-environmental civic engagement. Journal of Outdoor Recreation and Tourism. 2014; 5(6):1-10.
- Dublin Ireland. Government publication poster trade section, unit 20 lekki side retail park, Claremorris, co. mayo (tel.. 0.16476834/37 or 1090.213432), 2008.
- Elizabeth B. employee involvement in conservation, link the employee volunteering time bank worldwide, 2003. registered charity No: 1073831, wwwexperiencecorps. co.uk/xq/asp/qx/volunteer.
- EPA. Cooperation on health and biodiversity 2010. Biodiversity and human health policy brief assets, 2013.
- Feresu S. Zimbabwe economics and the causes of the crisis, 2010. Http//opendocs.ids.ac.uk-handle.
- Frison E, Cherfas J, Hodgkin T. 'Agricultural Biodiversity Is Essential for a Sustainable Improvement in Food and Nutrition Security', Sustainability. 2011; 3(1):238-253.
- Gurney GG, Cinner J, Ban NC, Pressey RL, Pollnac R, Campbell SJ. et al. Poverty and protected areas: an evaluation of a marine integrated conservation and development project in Indonesia. Global Environmental Change. 2014; 26:98-107.
- Lan RSPI. IEEP values of biodiversity, 2006. http/www.IEEP.org.uk/publication/pdfs/2006/ value of biodiversity June 06 pdf.
- Makindi SM. biodiversity conservation case study of Kimana Kenya. Africa journal tourism and lecture, 2010; (3):24.
- Meilby H, Smith-Hall C, Byg A, Larsen HO, Nielsen ØJ, Puri L. et al. are forest incomes sustainable? Firewood and timber extraction and productivity in community managed forests in Nepal. World Development, 2014. http://dx.doi.org/10.1016/j.worlddev.2014.03.011 (accessed on 08 November 2014).
- Meinzen-Dick RS, Devaux A, Antezana I. 'Underground assets: potato biodiversity to improve the livelihoods of the poor', International Journal of Agricultural Sustainability. 2009; 7:235-248.
- Mellor JW. poverty reduction and biodiversity conservation, the complex role for intensifying agriculture. Wwf macroeconomics program-p5, 2002, pp.35.httpwww.panda.org/mpd..
- Mijatović D, Van Oudenhoven F, Eyzaguirre P, Hodgkin T. 'the role of agricultural biodiversity in strengthening resilience to climate change: towards an analytical framework', International Journal of Agricultural Sustainability, 2012, 1-13. DOI: 10.1080/147359 03.2012. 691221.
- Smale M, Katungi E, Edmeades S. 'Gender, social capital and information exchange in rural Uganda', Journal of International Development. 2008; 20:35-52.
- Sthapit B, Rana R, Zaguirre EY, Jarvis PD. The value of plant genetics diversity to resources of farmers in Nepal and Vietnam, International journal of agricultural sustainability. 2009; 6:148-166.
- Susan C. Social issues and personal life considering the environment Journal of social issue. 2012; 73(3):607-681.
- Teeb. The economies of ecosystems and biodiversity in business enterprise, edited by Joshua bishop, Routledge, Abingdon, 2011.http//www.mfe.govt.nz/publication/water/ waltaki-option existence/value/ianos-/option/existence/ value/Janos pdf.
- Weber JL. Implementation of land and ecosystem account at the European environmental and economic accounting, handbook of National accounting, 2003, pp. 258.