
Research article · 2022 · Full text
International Journal of Geography Geology and EnvironmentWater quality in upper and middle stretches of river Ganga, India in relation to varying anthropogenic pressures
Volume 4(2) · Pages 169–181 · DOI: 10.22271/27067483.2022.v4.i2b.138 ↗
Research areasWater Quality and Pollution AssessmentHydrology and Watershed Management StudiesWater resources management and optimization
Abstract
Author-writtenRiver Ganga, one of the most important rivers of India, has been facing various types and magnitudes of anthropogenic stress along its course of run through the thickly populated river basin. The present investigation has been conducted for three seasons, for the year 2017-2018 for the upper and middle Ganga basins. The analysis has been performed to examine the variations in the concentrations of diverse water and sediment quality parameters from Devprayag to Haridwar, Bithoor to Kanpur, and Varanasi areas, respectively. The sampling locations have been chosen based on the distinct anthropogenic strains a site encounters. Temperature. pH, Total Dissolved Solids (TDS), Dissolved Oxygen (DO), Biochemical Oxygen Demand (BOD), Total coliform (TC), Faecal coliform (FC), Hardness, Total Alkalinity (TA), Nitrate, Phosphate and Total Kjeldahl Nitrogen (TKN) were examined for water using the standard methods of APHA, whereas the parameters evaluated for sediment examination contained Nitrate, Phosphate, TKN and Total Organic Carbon (TOC). The parameter values of DO, BOD, TDS, and TC corresponded with the highest permissible limits specified for the surface water by Central Pollution Control Board (CPCB). Most Upper Ganga basin sites were found in the Water Quality Class A regarding nearly all the parameters, except UG-01 and UG-02, where Class C was found concerning coliforms. UG-05 and UG-06 came under water quality class C and E, respectively, considering DO. In the middle Ganga stretch one, in terms of TDS, all spots were categorized into Class A and, for coliforms, were in Class C, whereas in terms of DO, it delivered an inconsistent trend. Likewise, in the middle Ganga basin two, in terms of TDS, all sites were classified into Class A, whereas DO show a fickle trend. The BOD and TC values transcended all the permissible limits, so they were not indexed into any class. A correlation matrix was established between the various variables. Strong positive correlations were seen between FC-Phosphate, Hardness-TDS, TA-TDS, TA-Temperature, TC-pH, and Phosphate-pH. In contrast, considerable negative correlations were noticed between DO-Temperature, DO-pH, and BOD-DO. The water quality was unacceptable for consuming and cleansing at nearly all locations as the maximum acceptable limitations were surpassed, showcasing the consequences of elevated human actions at all the sites.
Summary
Source-checkedPlain-language reading of the full paper, prepared with AI and checked against the text. Each point links to the authors' own words.
Why it matters
- The River Ganga is one of the top 10 most polluted rivers globally, facing severe stress from urban growth, industrial waste, and cultural practices. View evidence ↗
- Sewage pollution in the river has led to decreased dissolved oxygen and increased coliform bacteria, reducing the river's natural ability to dilute pollutants. View evidence ↗
The question
- The study aims to analyze and compare water quality between the upper stretch (Devprayag to Haridwar) and the middle stretch (Bithoor-Kanpur and Varanasi) of the River Ganga. View evidence ↗
What they did
- Sampling was conducted across the upper and middle basins during the 2017-2018 period. View evidence ↗
What they found
- Biochemical Oxygen Demand (BOD) was highest in the middle basins, ranging from 3.57-7.80 mg/L, compared to 0.97-5.47 mg/L in the upper Ganga. View evidence ↗
- Total coliform levels were most severe in the middle stretches, reaching up to 42,000 MPN/100ml in middle Ganga one. View evidence ↗
- Total Dissolved Solids (TDS) increased as the river flowed downstream, with the highest values (203.33-301.67 mg/L) found in middle Ganga basin two. View evidence ↗
- Water hardness also increased downstream, ranging from 80-110 mg/L in the upper basin to 120-157.67 mg/L in middle Ganga basin two. View evidence ↗
- Nitrate levels were highest in the upper Ganga (up to 2.22 mg/L) and lowest in middle Ganga one (0.33-0.87 mg/L). View evidence ↗
- Significant positive correlations were found between faecal coliform and phosphate, and between hardness and TDS, while dissolved oxygen (DO) was negatively correlated with temperature, pH, and BOD. View evidence ↗
- Despite varying levels, all sampling sites were categorized as Water Quality Class A specifically for Total Dissolved Solids (TDS). View evidence ↗
- Most sites were categorized as Class C for BOD, with only three sites in the upper basin (UG-01, UG-02, UG-03) meeting Class A standards. View evidence ↗
What it means
- The authors conclude that water quality at nearly all locations is unacceptable for drinking or cleaning due to the impact of human activities. View evidence ↗
- The authors recommend the stringent execution of environmental criteria and measures to address pollution and restore the river's ecosystem health. View evidence ↗
Visual summary
1 visualsIllustrations explain the paper; they do not show study data.
Downstream Pollution Gradient
AI-generated conceptual illustration (The Ganga River flowing from Himalayan mountains through urban landscapes). It explains the idea and does not show study data.
View source evidence ↗Figures & tables
From the original paper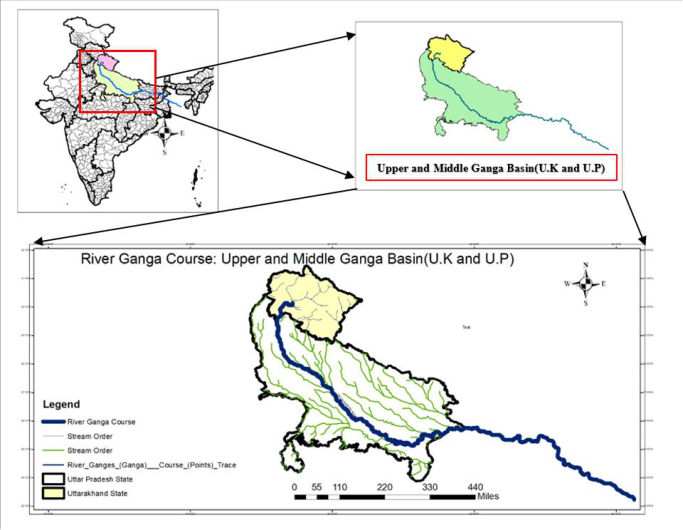 Figure 1
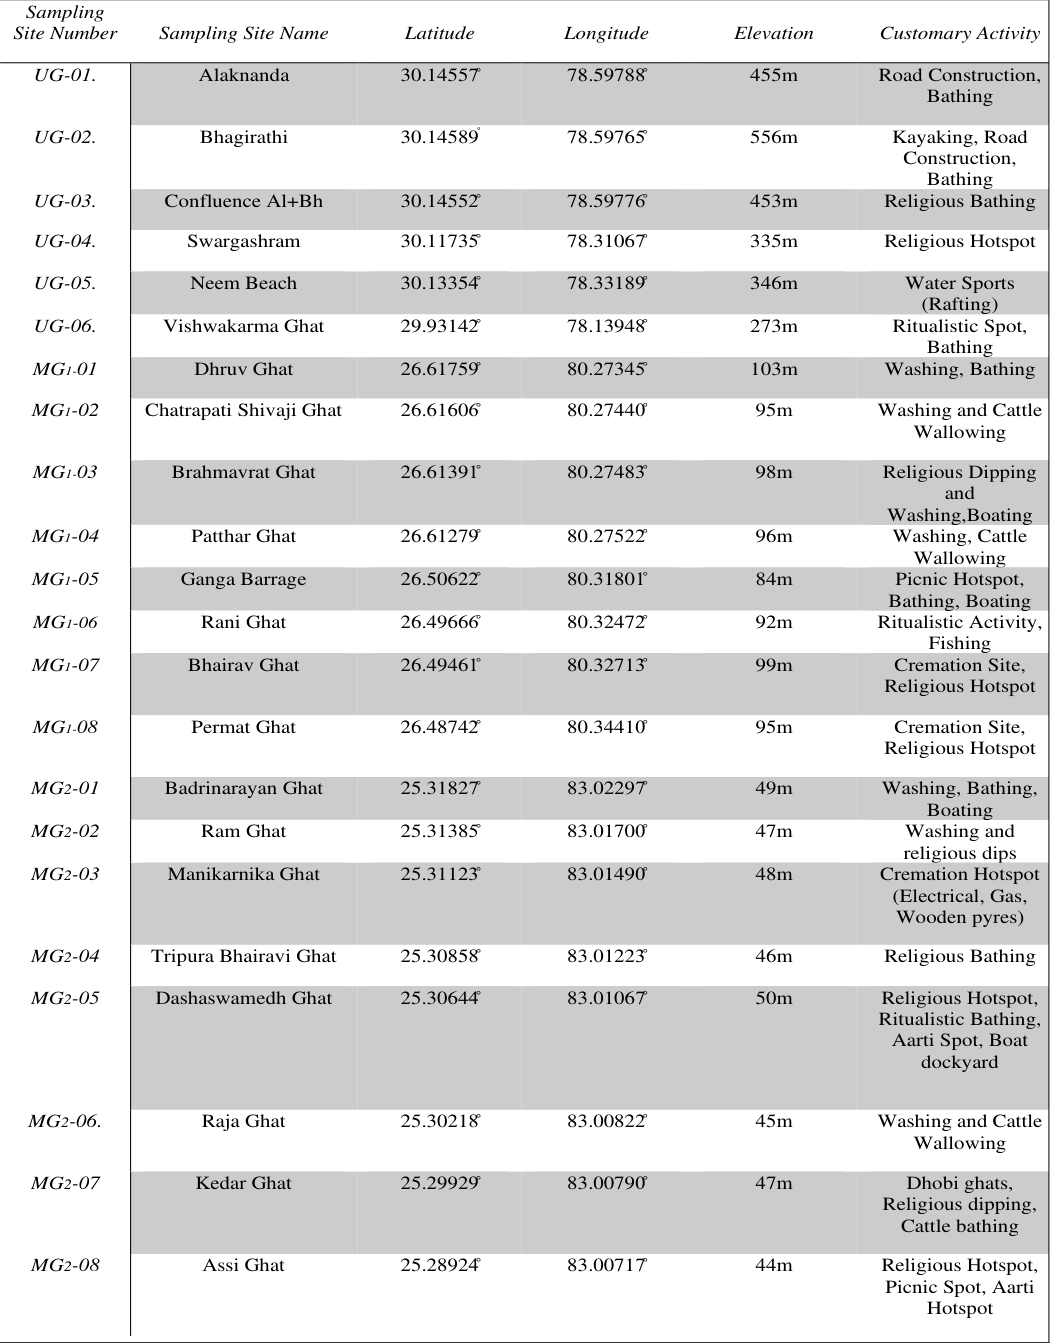 Table 1
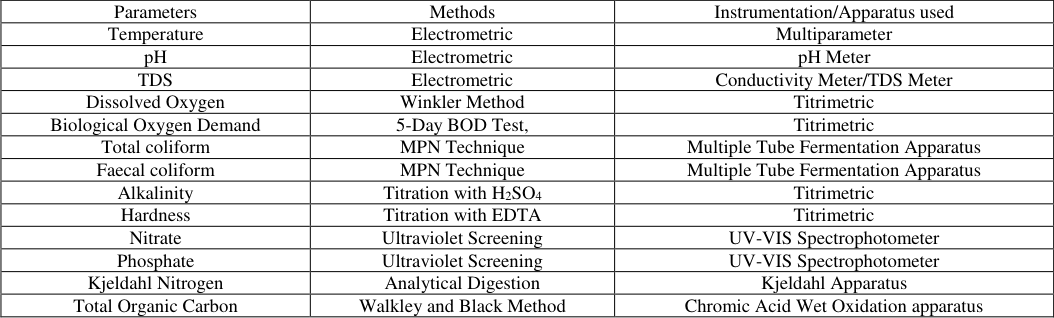 Table 2
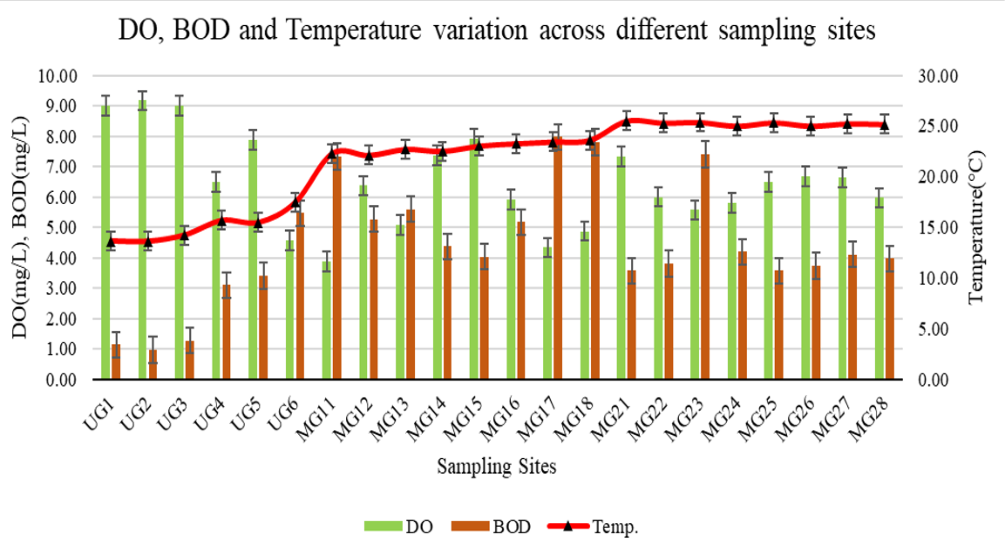 Figure 2
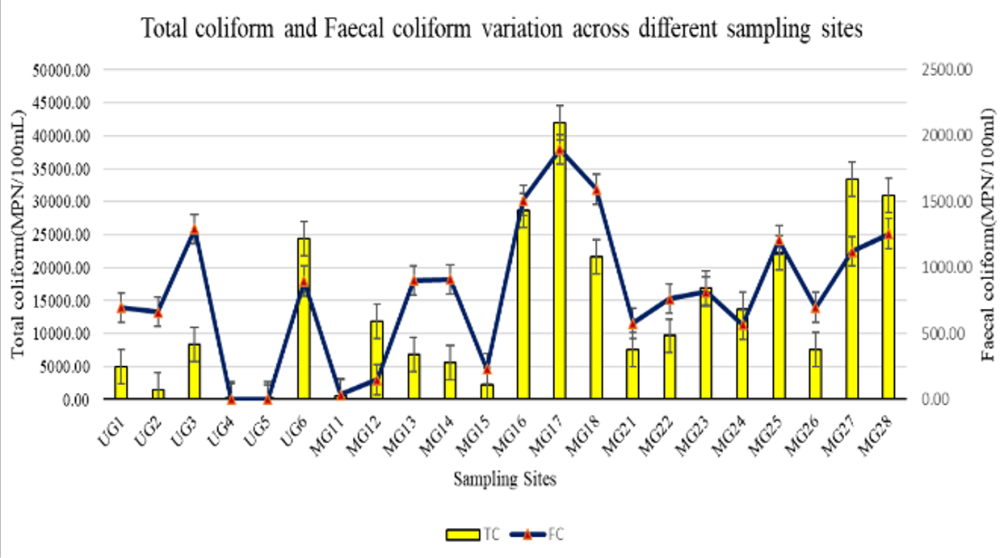 Figure 3
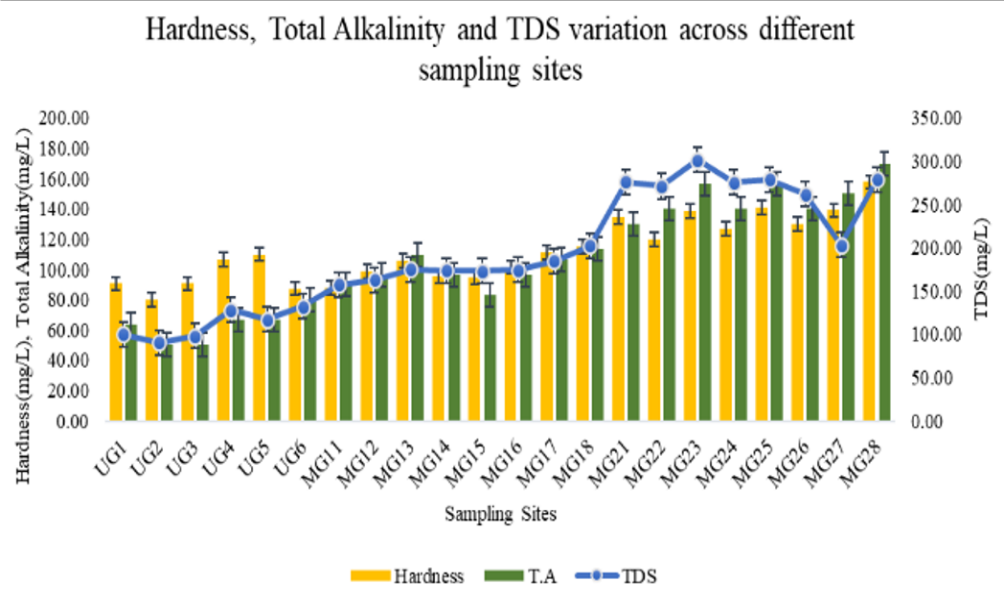 Figure 4
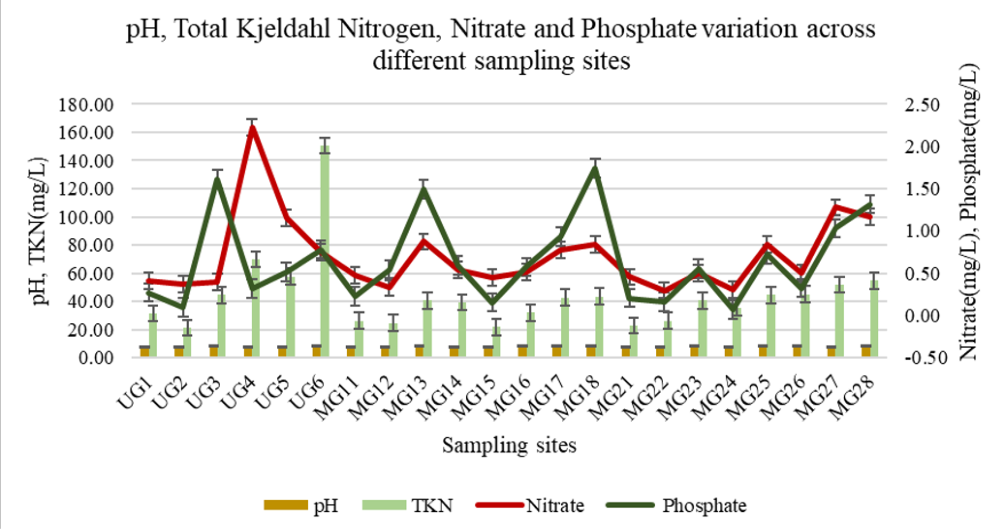 Figure 5
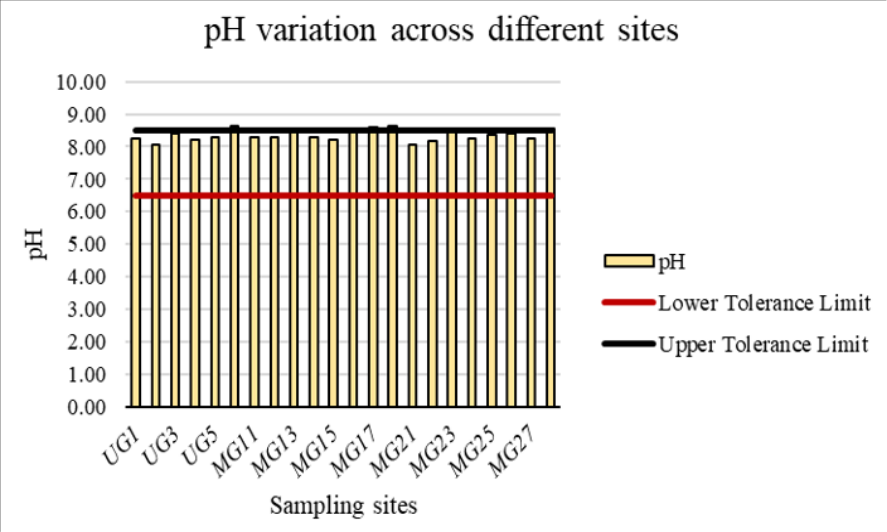 Figure 6
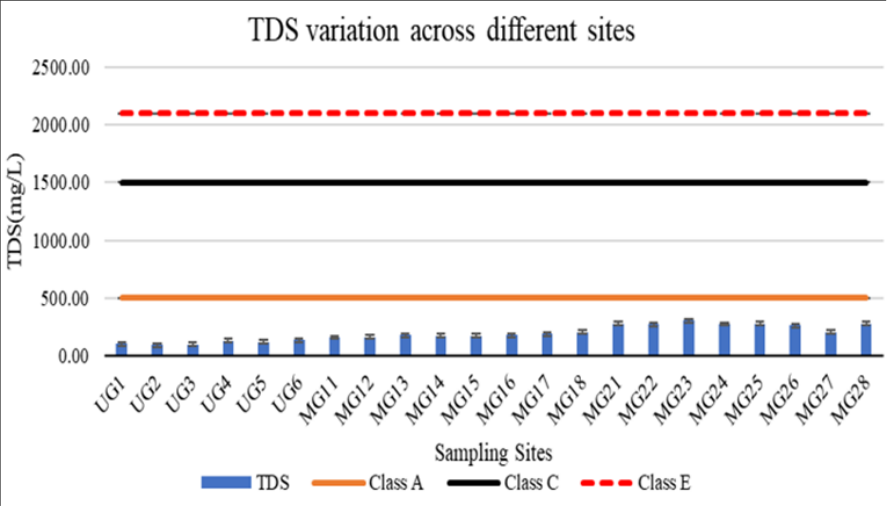 Figure 7
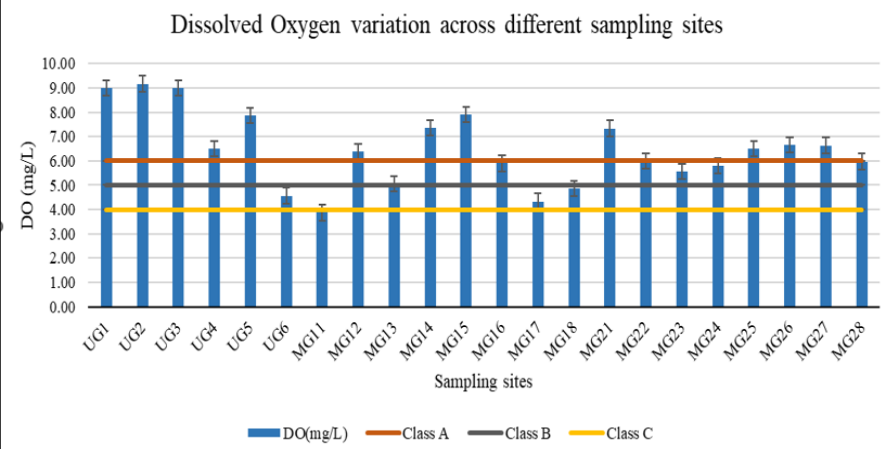 Figure 8
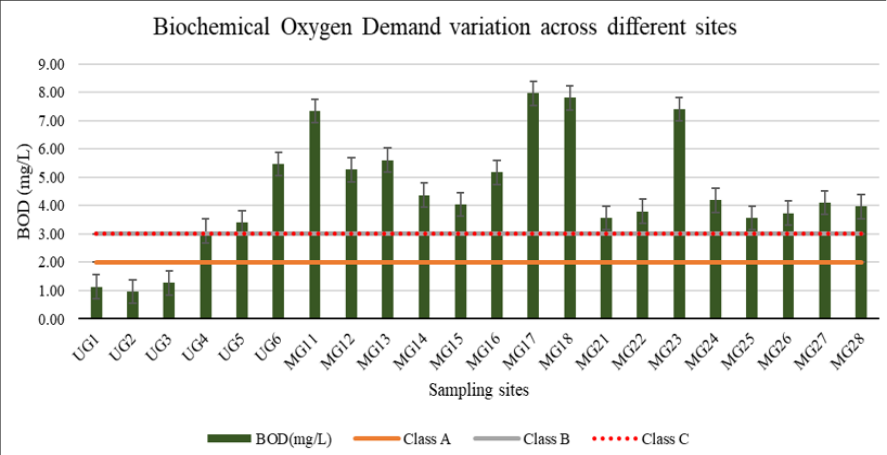 Figure 9
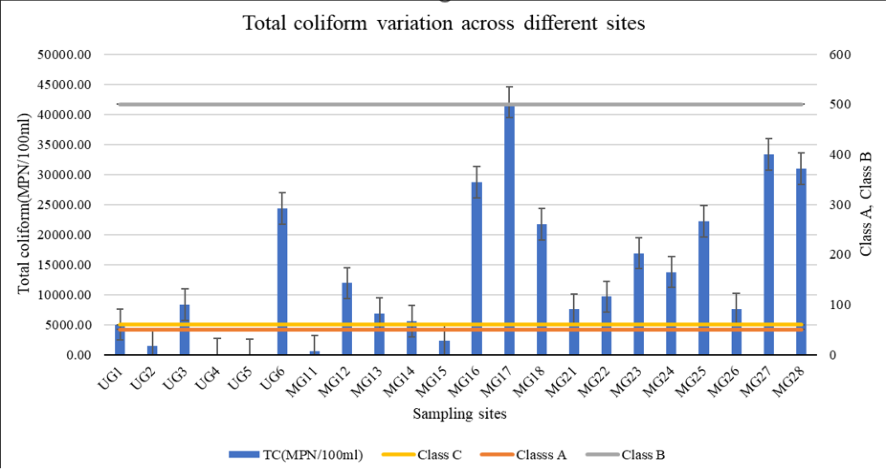 Figure 10
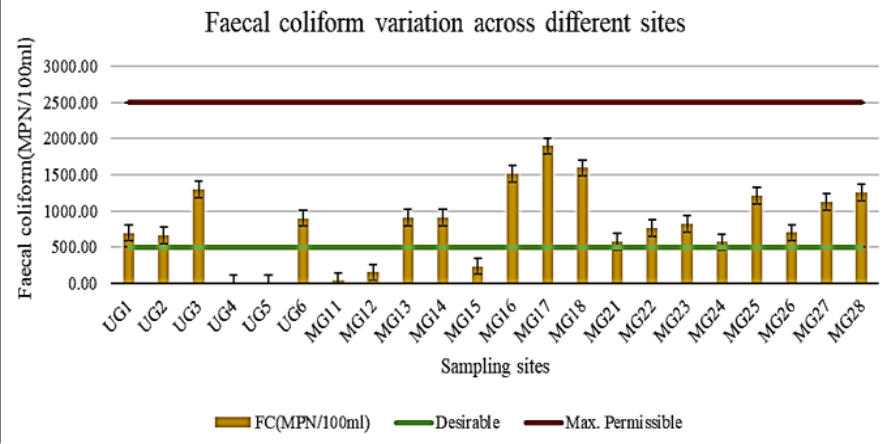 Figure 11
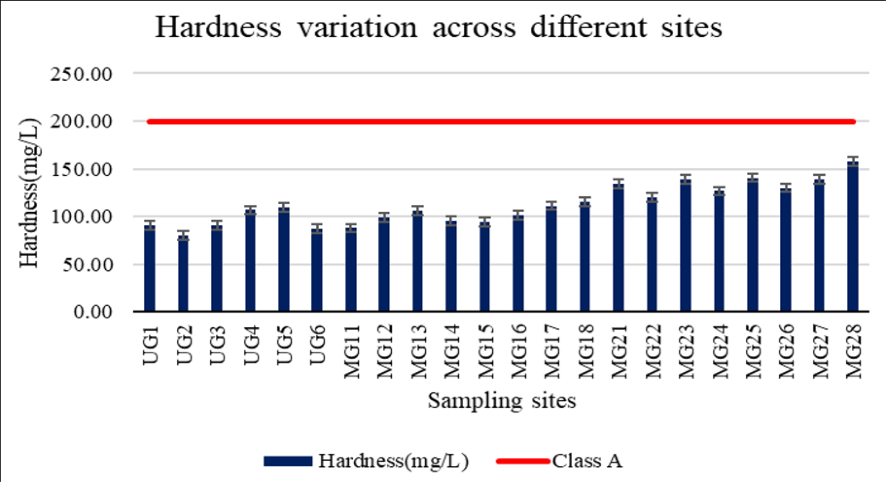 Figure 12
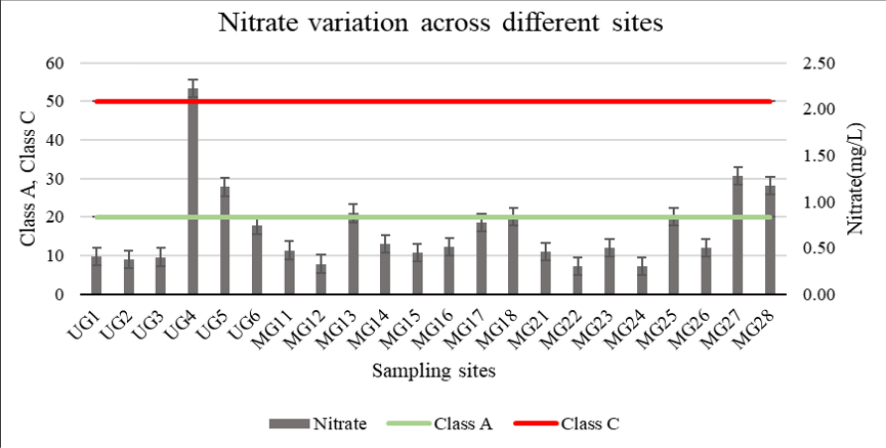 Figure 13
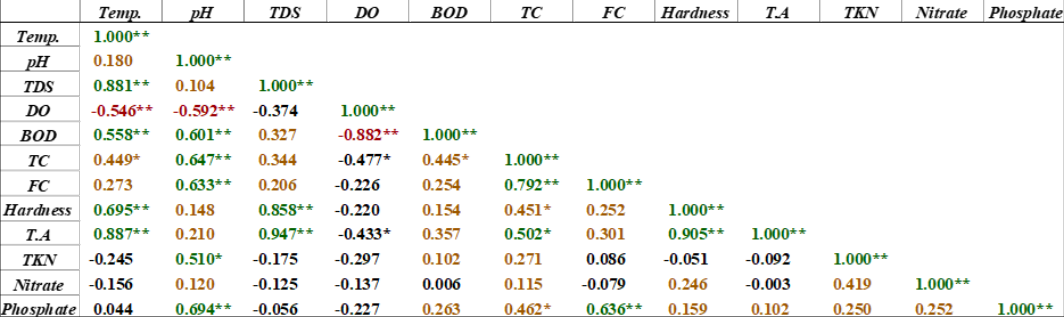 Figure 14
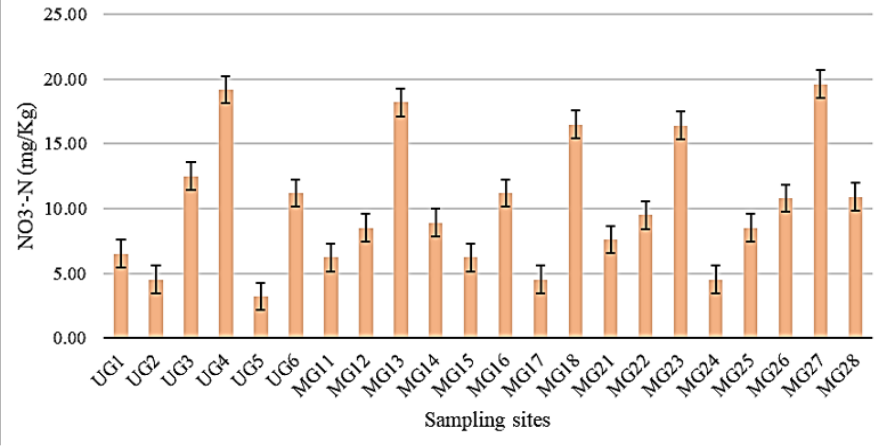 Figure 15
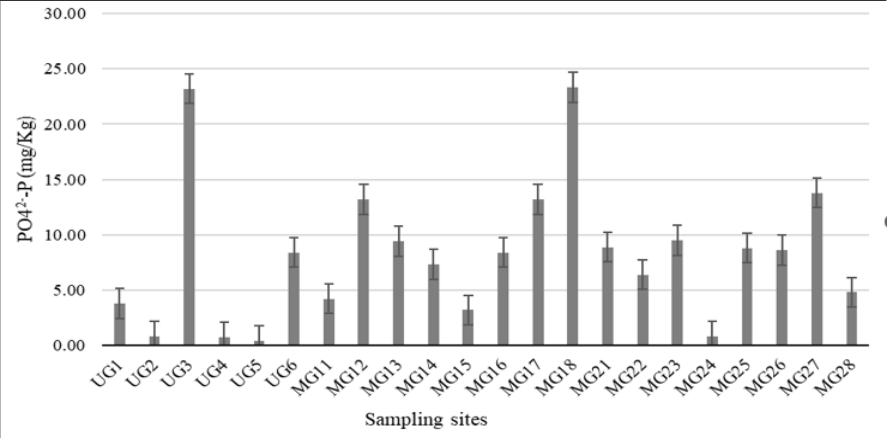 Figure 16
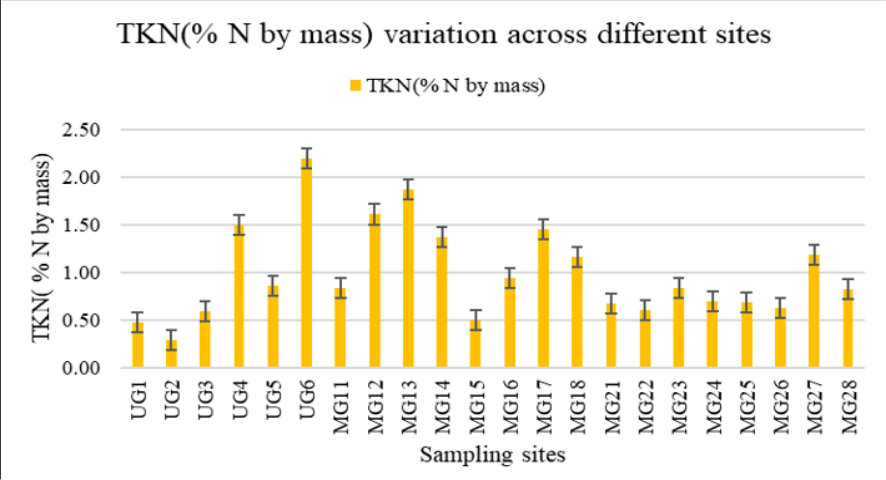 Figure 17
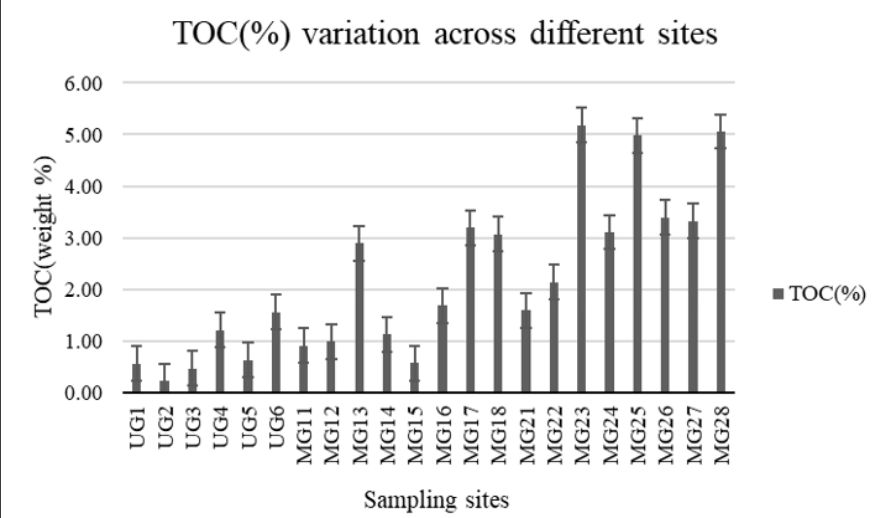 Figure 18
Introduction
Water is one of the most indispensable natural resources that serves as the lifeline of humankind and other living beings. While oceans hold around 97 percent of the world's water, the freshwater resources account for just three percent (1386 million cubic kilometers). Around 69 percent of the freshwater is trapped in ice and glaciers, while only 0.3 percent of the freshwater is found in rivers and lakes that is suitable for human use (Postel et al. 1996) [11] . Nations have been grouped according to their extent of water shortage employing their per capita annual water resource (AWR) (Gosain et al. 2006) [5] . The continuation of all life forms, the provision of food, the growth of the economy, and overall health all rely on water. It is a truly one-of-a-kind gift from nature to human civilization since it can't be exchanged for a majority of its uses, is challenging to clean it up upon contamination, is expensive to transport, and is tough to de-pollute (Kumar et al. 2005) [9] . Surface availability of water per person in India was 2309 m 3 in 1991 and 1902 m 3 in 2001, but by the years 2025 and 2050, these figures are anticipated to decline even further to 1401 m and 1191 m 3 (Ramesh and Yadava, 2005) [13] . 4000 km 3 of precipitation, comprising snowfall, fall on India annually.
Rivers are regarded as the lifeblood of humanity and are vital to sustaining the livelihoods of the populace and their traditions by bringing them a variety of advantages. India's extensive cultural legacy places a high value on the river Ganga. The river is regarded as being extremely pious and pure, and bathers are said to be cleansed in body, mind, and spirit by it. It offers water for a wide range of uses, including drinking and non-drinking, energy production, water sports, livelihood generation, fostering ecotourism, and providing habitat for numerous native and migratory birds. The river has regrettably been designated among the top 10 rivers in the world that suffer from the greatest pollution stresses and threats due to the booming population, sizable migrations from rural to urban regions, unorganized urban and industrial enterprises, the building of dams and barrages throughout the river reaches, release of untreated waste from cities and factories, floral and religious offerings, burning of the corpses on the banks of the river, and others (Khwaja et al., 2001, WRG, 2009) [8,18] . The water quality and biodiversity of rivers are both impacted by anthropogenic activities like overgrazing and deforestation (Joshi et al. 2009) [7] . River Ganga is noted for having consistently clean, fresh water. Nonetheless, various studies showed that excessive sewage pollution is causing a decrease in the amount of dissolved oxygen in the water and an increase in the number of coliform bacteria, indicating a drop in the water's ability to dilute its contaminants (Agarwal, 2015; Sharma and Kaushik, 2018) [1,14] . Due to development, the Ganga stream's sediment quality has been negatively impacted (Singh et al., 2002) [16] . The characteristics of ground water rejuvenation and the systems and processes that currently exist in rivers are both being drastically altered by the urban clusters that line their banks (Misra, 2011) [10] . Some earlier investigations on the Ganga demonstrate that the river's ecology and water quality have both declined. Sewage contamination and organic solid and liquid wastes have been determined to be the primary causes of river Ganga pollution in Haridwar (Bhutiani et al., 2016) [3] . The surge in organic contaminants and wastewater is triggering a rise of pathogenic organisms, which is creating microbiological load in freshwater sources and reservoirs in Uttarakhand (Tyagi et al., 2015) [17] . Quality of Kanpur City's treated water from filtration plants, surface water, and ground water have also shown impact on Ganga river (Trivedi et al. 2010). The Ganga plain's development has a significant negative impact on the stream's silt quality (Singh et al. 2002) [16] . Studies have been conducted to evaluate the Ganga River's water quality by contrasting the pre and post Ganga Action Plan situations. The water quality can change when the anthropogenic activities are minimized, as observed in case of Covid-19 Pandemic lockdown. However, this has been found to result in restoration of water quality only in some areas for a short time. For long term restoration of the river, holistic strategic plans and policy interventions are required. The water quality dynamics of the Ganga River in Varanasi across geographical and temporal variability have been carried out along with the land use changes being analyzed, having closer associations with water quality at Varanasi. Varanasi's cities were reported to more accountable for the Ganga's water pollution owing to the persistence of the pollution there (Rai, 2013) [12] . The present study aims at analyzing and comparing the quality of water in the upper stretch of river Ganga encompassing Devprayag and the Rishikesh-Haridwar region, and the middle stretch covering the regions of Bithoor -Kanpur and Varanasi region covering various ghats. The anthropogenic activities in the two sections of the river show marked variations and hence the river water quality has been assessed and compared in the light of these stressors.
Materials and Methods
Materials and Methods
Study Area
The study area incorporates 6 sites from Devprayag to Haridwar and 8 locations each from Bithoor to Kanpur and Varanasi region respectively as shown in Figure 1. The study sites have been depicted along with the GPS locations and prevailing anthropogenic activities in Table 1.
Sample Collection Pre-Sample Preparation
The high-quality Teflon sample bottles were precleaned with dilute nitric acid followed by distilled water. The bottles were rinsed first with sample water and then filled.
Collection of Water Samples
At each sampling spot triplicate samples were collected. Grab sampling technique was brought out for cluster of samples and water quality examination was carried out as per standard procedures (APHA, 2012) [2] . The water samples were collected from 22 sites for the year 2017-2018 for the upper and middle Ganga basins. BOD bottles of 300 ml capacity were employed to collect water samples for DO determination. The parameters of temperature, pH and TDS were evaluated on the site utilizing handheld meter (Eutech multiparameter), while DO was determined using titrimetric techniques on site whereas the rest of the parameters were analyzed in the laboratory.
Collection of Sediment Samples
A sediment core sampler with a tube length of 13 cm and a diameter of 6 cm was used to collect surface sediment samples from 0 to 15 cm in depth. The corer, full of sediments, was enclosed with a steel clamp to minimize any loss of the microscopic sediment particles. From each site, three samples were obtained, which were combined to form a composite sample. Before evaluation, the samples were oven-dried and homogenized in a mortar and pestle. The estimation of Biochemical Oxygen Demand (BOD), Total coliform (TC), Faecal coliform (FC), hardness, total alkalinity, nitrate, phosphate and Total Kjeldahl Nitrogen (TKN) in water and Total Organic Carbon (TOC), nitrate, Total Kjeldahl Nitrogen (TKN) and phosphate in sediments was done using the methods as shown in Table 2. Fecal coliforms are presumed to be a more precise predictor of either human or animal waste rather than the more generic total coliform bacteria category since their sources are more distinctive than the latter. Therefore, the total coliforms are more in number with lesser number of indicator organisms. The higher coliform values are seen for UG-06, MG1-07, MG1-08 and MG2-03, MG2-05, MG2-07 and MG2-08. The Faecal coliforms were found in the range of (2-1292.33) MPN/100ml, (35.33-18960) MPN/100 ml and (577.67-1256.33) MPN/100 ml for the upper, middle Ganga one and middle Ganga two respectively, with higher numbers at UG-03, UG-06, MG1-07, MG1-08, MG2-05, MG2-07 and MG2-08. This can be attributed to all the sites being ritualistic bathing sites and faecal coliform may enter through unregulated human sewage, fertilizer runoff, and direct animal and bird waste disposal. During the rainy season, individual residential septic tanks may become overburdened, forcing untreated human waste into drainage canals. TDS was found in the range of (90.23-132.40) mg/L, (157.17-202.63) mg/L and (203.33-301.67) mg/L for the stretch in upper, middle Ganga one, middle Ganga basin two respectively. Higher TDS values refer to more amount of organic and inorganic solids entering the river due to various religious and cultural activities including holy dipping, washing activities, flower, leaves and woody debris, partially treated waste and effluent discharge as seen for UG-04, UG-06, MG1 -07, MG1-08, MG2-03, MG2-05 and MG2-08.The hardness values were found to be on the higher side for the same sites showing significant relationships and were seen to be varying between (80-110)mg/L,(88-115.33)mg/L and (120-157.67)mg/L respectively for the three basins( UG, MG1 and MG2) respectively. The reasons could be attributed to high mineral content in water due to natural and anthropogenic sources. The total alkalinity in the upper, middle one and middle two Ganga basins were found in the range of (50.0-80.0) mg/L, (83.33-113.33) mg/L and (130.0-170.0) mg/L respectively. The higher alkalinity values at UG-06, MG1-03, MG1-07, MG1-08, MG2-03, MG2-05, MG2-08 can be ascribed to the fluctuations in the pH due to agricultural runoffs, fossil fuel emissions and acid my drainage. Due to the design and make-up of the stream bed, rivers have some capacity to withstand pH shifts. The pH values were found to be fluctuating between (8.06-8.64), (8.21-8.63) and ( 8.07-8.55) for UG, MG1 and MG2 respectively. The nitrate content varied between (0.37-2.22) mg/L for UG, (0.33-0.87) mg/L for MG1 and (0.30-1.28) mg/L for MG2 respectively. UG-04, MG1-03, MG1-07, MG1-08, MG2-05, MG2-07 and MG2-08 showed higher nitrate content values as at all the sites human waste introduction, poorly functioning septic systems, waste water input and agricultural runoff are commonly seen. The total kjeldahl nitrogen concentrations were witnessed to be varying between (21.19-150.61) mg/L for upper Ganga, (21.79-43.38) mg/L for middle Ganga one and 22.82-54.70) mg/L for middle Ganga two. Common reasons for the rise in TKN include farming water that contains nutrients, wastewater treatment facility outflow, commercial input from the dairy sector, and many others. Moreover, as nitrogen deteriorates over time, nitrate is released. UG-04, UG-06, MG1-03, MG1 -07, MG1-08, MG2-03, MG2-05, MG2-07 and MG2-08 asserted high TKN content. The phosphate values varied between the range of (0.10-1.61) mg/L for UG, 90.15-1.74) mg/L for MG1 and (0.30-1.28) mg/L for MG2 respectively. The highest phosphate content for UG-03 was discovered in the upper Ganga basin, which may be related to its inherent existence in rocks and mineral resources. Moreover, the MG1-03 and MG1-08 sites receive inputs of organic waste and fertilizer, resulting in higher levels. Because of the site's exposure to organic contamination, MG2-08 showed higher values in the middle Ganga basin 2. The sampling sites were categorized into different water quality classes based on the maximum permissible limits given by CPCB, that have been depicted in Figs. 6-13 respectively. A correlation matrix was created between the diverse water parameters that has been depicted in Fig. 14. CPCB carried out the analysis for whole stretch of Ganga taking into account the major hotspot locations of anthropogenic inputs for the year 2002-2011, which was compiled in 2013.
| Parameters | Methods | Instrumentation/Apparatus used |
|---|---|---|
| Temperature | Electrometric | Multiparameter |
| pH | Electrometric | pH Meter |
| TDS | Electrometric | Conductivity Meter/TDS Meter |
| Dissolved Oxygen | Winkler Method | Titrimetric |
| Biological Oxygen Demand | 5-Day BOD Test, | Titrimetric |
| Total coliform | MPN Technique | Multiple Tube Fermentation Apparatus |
| Faecal coliform | MPN Technique | Multiple Tube Fermentation Apparatus |
| Alkalinity | Titration with H2SO4 | Titrimetric |
| Hardness | Titration with EDTA | Titrimetric |
| Nitrate | Ultraviolet Screening | UV-VIS Spectrophotometer |
| Phosphate | Ultraviolet Screening | UV-VIS Spectrophotometer |
| Kjeldahl Nitrogen | Analytical Digestion | Kjeldahl Apparatus |
| Total Organic Carbon | Walkley and Black Method | Chromic Acid Wet Oxidation apparatus |
Table text extracted from the original PDF; superscript letters are shown inline. The original table image is below.
View original table image
If the concentration values of the parameters are found to be exceeding the maximum permissible limits with respect to the standards, the status of the water quality is believed to be poor and the condition is said to be degraded. When compared to the earlier report of CPCB (2013) [4] , the water quality parameter values in the study area were seen to be transcending the maximum admissible limits at multiple sites as per established best use categories of surface water by CPCB. The water quality attributes revealed favorable improvement in terms of parameters of electrical conductivity, dissolved oxygen, biochemical oxygen demand and total coliform when analogized to prior reports of Central Pollution Control board but yet the water was not found appropriate for drinking and bathing purposes. FC-Phosphate, Hardness-TDS, TA-TDS, TA-Temperature, TC-pH, and Phosphate-pH showed significant positive correlations. In contrast, notable negative correlations were witnessed between DO-Temperature, DO-pH, and BOD-DO. Phosphate crystals are an important constituent of faeces, thus faecal contamination causes a greater number of faecal coliform bacteria. More the amount of total dissolved solids, more would be the electrical conductivity. Total Hardness is due to salts of Ca, Mg and HCO3.All these are included in TDS. Thus, stronger correlation values. As alkalinity includes, bicarbonate, hydroxide and carbonate of salts, thus it can be positively correlated to TDS. Although Temperature does not affect the alkalinity to a much extent but it is a property of water that is dependent on the presence of certain chemicals in water. So, Hardness and TDS presence can be the coincidental cause of high alkalinity along with high temperature. Total coliform concentrations are known to be affected by pH as more sewage dismissals would move the pH to alkaline, causing rise in concentrations of coliforms and if the pH decreases due to industrial pollution load or septic tanks input, would reduce the number of the bacteria. The moderate positive correlation between phosphate and pH indicates that manure and fertilizer input would be the cause of pH in water. Negative correlations between DO and temperature exists because of the fact that the greatest solubility of the oxygen depends on temperature. Similarly DO and BOD have a significant negative correlation as the aerobic microorganisms use dissolved oxygen to disintegrate the organic matter in river water. The pH levels are not directly influenced due to dissolved oxygen because the two have no physical-chemical connection. Nevertheless, in some circumstances, there are indirect associations from outer elements, such as added nutrients advancing algal bloom. The results of the sedimental component analysis for nitrate, phosphate, total kjeldahl nitrogen and total organic carbon have been illustrated in Figs15-18 respectively.
Conclusion
It is inferred that the water quality parameter values surpass the permissible values at all the locations as per designated best-use categories of surface water by CPCB. The water quality attributes have indicated little progress when approximated to earlier Central Pollution Control board reports. However, still, the water needs to be seen as eligible for domestic use. All the water quality parameters for one of the sites in the upper Ganga basin (UG-03) were found to be falling under permissible limits, except for the total and faecal coliform values for which it qualified for class C and exceeded the desirable limits respectively, which could be due to the open defecation activities prevalent at the site. Besides that, UG-04 and UG-05 showcased the faecal coliform values within desirable limits and in terms of total coliforms qualified for Class A, which is attributed to the full functionality of STPs at the sites. River Ganga, the scared river of the country, is impaired by the endless gush of municipal sewage, domestic discharges, nonbiodegradable industrial effluents, and runoffs from the fields that are swirled out of the anthropogenic stirs along the river banks and have prolonged consequences on human and marine healthiness due to their tainted disposition. Unparalleled population augmentation in the river basin and mechanization have altered land use, behaving as drivers of river ecosystem modification. These drivers can imperil diverse ecosystem benefits being supplied by the river Ganga. If the population detonation and pollution problems and retention capability of the river are given prompt watch, it will be easier for us to switch the natural condition of river Ganga. Though the environmental administration and lawful policy framework are now acknowledged as prime subjects, proper execution of environmental criteria must be practiced to address the pollution pressure and preserve the ecosystem health of the river. Anubha Kaushik: Conceptualization, validation, review and editing, Visualisation, Supervision.
Acknowledgement
AcknowledgmentsThe author is thankful to Guru Gobind Singh Indraprastha University, New Delhi, India, for providing the Indraprastha Research Fellowship.
Figures and tables from the paper
References
16 in the original paper- Agarwal PK. A review of ganga river pollution reasons and remedies. Journal of Indian Water Resources Society. 2015;35(3):46-52.
- Bhutiani R, Khanna DR, Kulkarni DB, Ruhela M. Assessment of Ganga River ecosystem at Haridwar, Uttarakhand, India with reference to water quality indices. Applied Water Science. 2016;6:107-113.
- Gosain AK, Rao S, Basuray D. Climate change impact assessment on hydrology of Indian river basins. Current science. 2006;90(3):346-353.
- Dr. Rai A. Toxicity of heavy metals in the water quality of Ganga River in Kanpur, Uttar Pradesh, India. Int. J Adv. Chem. Res. 2020;2(1):01-04. DOI: 10.33545/26646781.2020.v2.i1a.14
- Joshi DM, Kumar A, Agrawal N. Studies on physicochemical parameters to assess the water quality of river Ganga for drinking purpose in Haridwar district. Rasayan journal of chemistry. 2009;2(1):195203.
- Khwaja AR, Singh R, Tandon SN. Monitoring of Ganga water and sediments vis-a-vis tannery pollution at Kanpur (India): a case study. Environmental Monitoring and Assessment. 2001;68:19-35.
- Kumar R, Singh RD, Sharma KD. Water resources of India. Current science. 2005;89(5):794-811.
- Misra AK. Impact of urbanization on the hydrology of Ganga Basin (India). Water resources management. 2011;25:705-719.
- Postel SL, Daily GC, Ehrlich PR. Human appropriation of renewable fresh water. Science. 1996;271(5250):785-788.
- Rai B. Pollution and conservation of Ganga River in modern India. International Journal of Scientific and Research Publications. 2013;3(4):1-4.
- Ramesh R, Yadava MG. Climate and water resources of India. Current Science. 2005;89:818-824.
- Sharma P, Kaushik A. Drivers of Ecosystem Change: A Case Study of River Ganga. Environ. We Int. J. Sci. Tech. 2018;13:167-176.
- Sharma P, Kaushik A. Riverine water quality engendered by policy interventions, episodic sociocultural activities, and the COVID-19 pandemic lockdown: A case study of upper and middle Ganga, India. International Journal of Geography, Geology and Environment. 2023;5(1):15-24
- Singh M, Müller G, Singh IB. Heavy metals in freshly deposited stream sediments of rivers associated with urbanisation of the Ganga Plain, India. Water, Air, and Soil Pollution. 2002;141:35-54.
- Tyagi S, Singh P, Sharma B, Singh R, Dobhal R, Uniyal DP. Bacteriological assessment of drinking water sources of Uttarakhand, India. National Academy Science Letters. 2015;38:37-44.
- 2030 Water Resources Group. Charting Our Water Future; Economic frameworks to improve decisionmaking, a report by the Water Resources Group Online at; c2009. (https://www.2030wrg.org/charting-ourwater-future/).
Cited by 6
From OpenAlex, OpenCitations and reference lists read by Scinovex
- Assessment of Pollution Status in Surajpur Wetland using multivariate statistical analysis, Uttar Pradesh, India ↗
Koshal Rajora, Kiranmay Sarma · Environmental Earth Sciences · 2024
❝ 7 - Riverine water quality engendered by policy interventions, episodic socio-cultural activities, and the COVID-19 pandemic lockdown: A case study of upper and middle Ganga, India
Prerna Sharma, Ajeet Kaushik · International Journal of Geography Geology and Environment · 2023
Ganga is one of the most important rivers of India known for its unique anti-bacterial and self-purifying properties. While the river has been providing various direct and indirect services to the people in its densely populated basin, it has also been facing tremendous anthropogenic pressures in the past few decades due to developmental activities that deteriorated the riverine quality making it to the list of top ten world rivers at risk. The river also faces episodic challenges of pollution and health, due to frequent cultural and religious events involving mass bathing and rituals in Ganga
- Assessment of water quality parameters using water quality index (WQI) of upper Ganga basin
Akanksha Mathur, Vikas Kumar Singh, Shivam Shivam, Vipul Chaudhary, Khwahiz Ali, Mo Akram · International Journal of Research in Agronomy · 2024
The Upper Ganga Basin, a vital water resource for millions of people and a diverse ecosystem, faces significant challenges due to anthropogenic activities and natural processes affecting water quality. The aim of this study to evaluate the water quality of the Upper Ganga Basin using the Water Quality Index (WQI). By integrating multiple water quality parameters, the WQI provides a single, aggregated value that represents the overall health of the water body. Various water quality parameters data such as Dissolved Oxygen (DO), pH, Electrical Conductivity (EC), Water Temperature, Total Dissolve
- A study on the water pollution of river Ghaggar with impacts and mitigation strategies ↗
Arpit · International Journal of Humanities and Education Research · 2023
The Ghaggar River flowing through the northern Indian states of Haryana, Punjab and Rajasthan is a seasonal river with significant historical, cultural and ecological importance. In recent decades, however, the river has become heavily polluted due to untreated industrial effluents, domestic sewage and agricultural runoff. This research paper investigates the major sources of pollution, analyzes the environmental and human health
- Marketing strategy for low cost gravity-based water purifier in the West Bengal market ↗
Indraneel Das, Sudip Kumar Ghosh, Pranabesh Ghosh · International Journal of Research in Marketing Management and Sales · 2024
Water contamination is the biggest problem in the world because of the rapid growth of industry and people. In industrial effluents, hazardous substances such as radioactive elements and heavy metals are found in high concentrations, which have an adverse effect on human health. Now-a-days various waste water technology available in the West Bengal as well as Indian market, but they
- Limnological study of river Ganga at sindhora ghat with special reference to fish fauna resources ↗
R. K. Dubey, Awadhesh Singh Yadav · International Journal of Fisheries and Aquatic Studies · 2024
The river Ganga is the largest river in India and the fifth longest in the world. Although many studies on fish ecology and systematic research have been conducted largely to improve fisheries, fish diversity and their distribution pattern from conservation point of view have never been adequately addressed in the Ganges. In this connection, current distribution and abundance of freshwater