
Research article · 2021 · Full text
International Journal of Advanced Biochemistry ResearchEffect of changes in storage conditions and temperature on routine biochemical analytes in serum assessed at periodic intervals
Volume 5(2) · Pages 54–57 · DOI: 10.33545/26174693.2021.v5.i2a.160 ↗
Research areasClinical Laboratory Practices and Quality Control
Abstract
Author-writtenBackground: To observe the changes in common biochemical analytes namely glucose, urea, creatinine, total protein, albumin, total cholesterol & triglycerides when subjected to different temperature and storage conditions. Materials and Methods: This study was conducted in 100 randomly selected OPD patients. 5 ml of blood was collected in a clot activator plain tube without any anticoagulant. Blood was allowed to clot at room temperature for 30 minutes and serum was separated in different aliquots. Common biochemical parameters were performed immediately from these sera. Then the sera were divided and stored at room temperature as well as at 2 to 8 °C. After that all parameters were measured again at intervals of 6 and 24 hours. Results: Baseline values of biochemical parameters analyzed within 2 hours of blood collection was compared with the same samples stored at room temperature and at 2-8 °C. Data was analyzed and statistical significance was calculated. It showed that glucose was highly unstable when stored at room temperature and even when stored at 2-8 °C for 24 hours, while the stability of creatinine and total protein was also less. Other analytes were found stable.Conclusion: This study helped us to identify sensitive analytes that significantly vary when not stored properly. If samples are delayed to be analyzed, then it is essential to store them at defined temperature for analytes like glucose, creatinine and total protein.
Summary
Source-checkedPlain-language reading of the full paper, prepared with AI and checked against the text. Each point links to the authors' own words.
Why it matters
- Accurate measurement of blood, serum, and plasma analytes is critical for patient diagnosis, treatment, and follow-up in evidence-based medicine. View evidence ↗
- Preanalytical errors, such as improper sample storage temperature and time, are the most frequent errors in clinical laboratories and must be controlled to ensure precision and accuracy. View evidence ↗
The question
- The study aimed to determine how different storage temperatures and durations impact the quantitative values of seven common biochemical parameters in serum. View evidence ↗
What they did
- The study involved 100 randomly selected outpatient department (OPD) patients at Dr M K Shah Medical College & SMS Multispecialty Hospital in Ahmedabad between May 1 and June 30, 2020. View evidence ↗
- Five milliliters of venous blood were collected in plain clot activator tubes without anticoagulants and allowed to clot for 30 minutes at room temperature. View evidence ↗
- Serum was divided into four groups: a baseline group analyzed within 2 hours at 20-25 °C, a group stored at room temperature for 6 hours, and two groups stored at 2-8 °C for 6 and 24 hours respectively. View evidence ↗
- The seven analytes measured across all storage conditions were glucose, urea, creatinine, total protein, albumin, total cholesterol, and triglycerides. View evidence ↗
What they found
- Urea, total cholesterol, triglycerides, and albumin remained stable across both room temperature (6 hours) and refrigerated (24 hours) storage conditions. View evidence ↗
What it means
- The authors recommend that serum samples be analyzed within 2 hours of collection to ensure the validity of results, particularly for sensitive analytes. View evidence ↗
- For analytes such as glucose, creatinine, and total protein, strict adherence to defined storage temperatures is essential if analysis is delayed. View evidence ↗
- The study was limited by a small sample size, the exclusion of other biochemical parameters like enzymes, and the failure to account for run-to-run variations. View evidence ↗
Visual summary
2 visualsIllustrations explain the paper; charts are replotted from the paper's own table values.
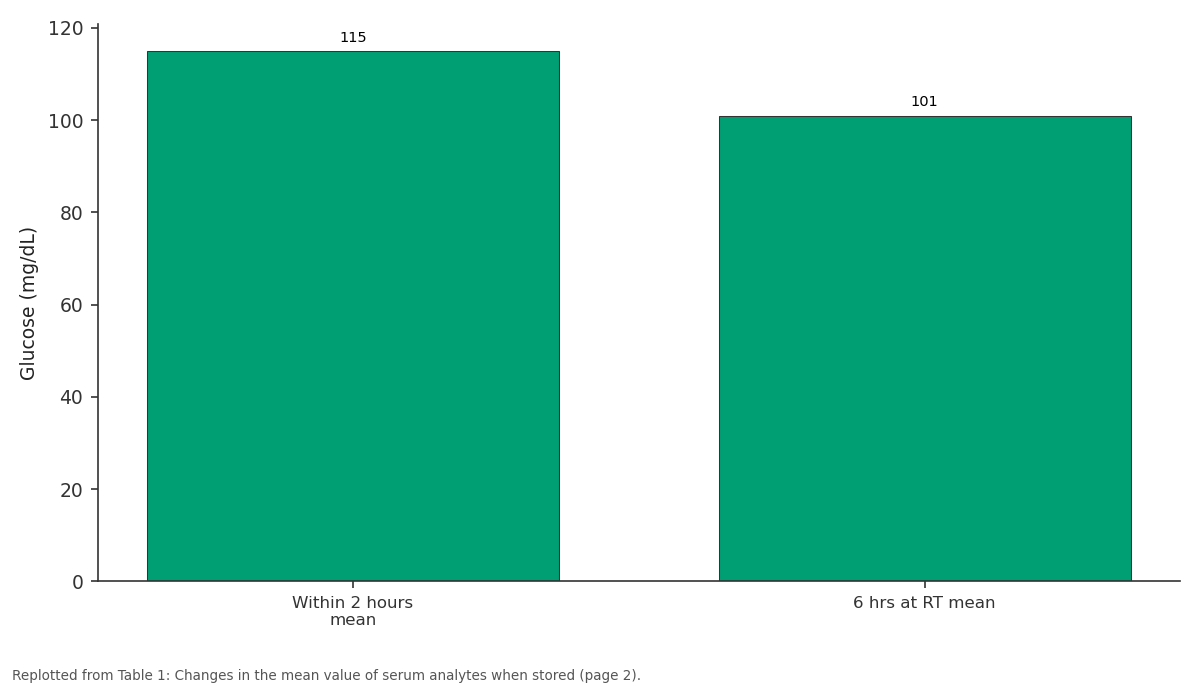
Glucose (mg/dL): Within 2 hours mean vs 6 hrs at RT mean
Replotted from Table 1 (page 2) of the original paper. Every bar is the paper's own table value.
View source evidence ↗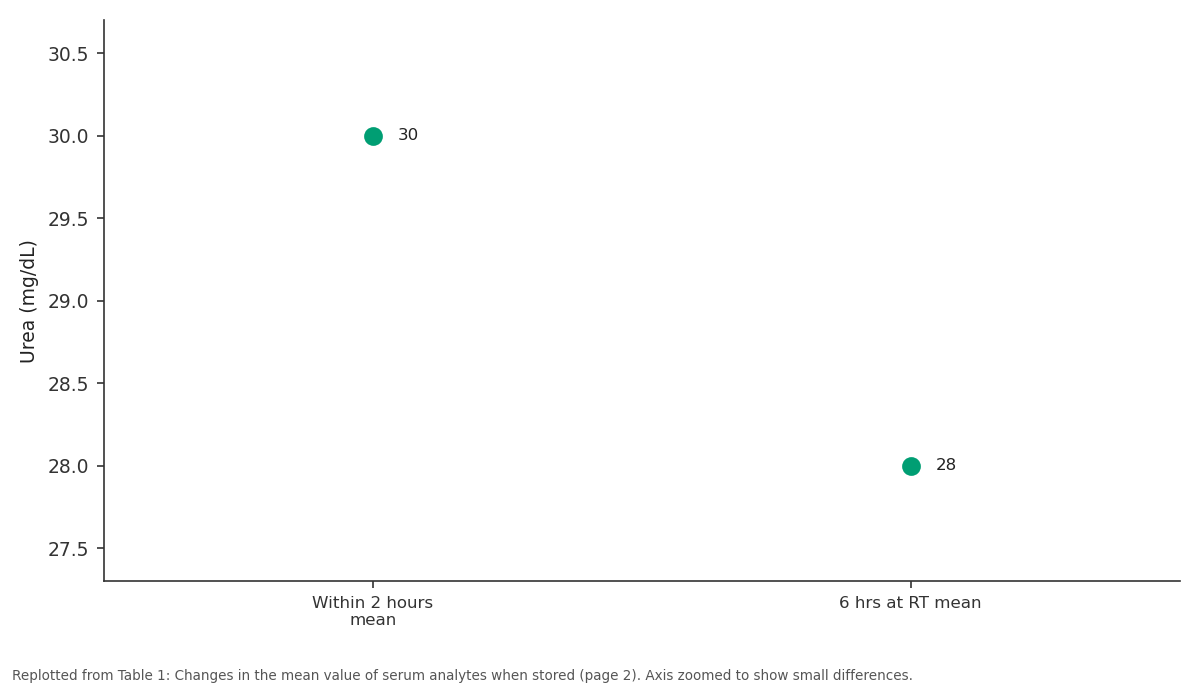
Urea (mg/dL): Within 2 hours mean vs 6 hrs at RT mean
Replotted from Table 1 (page 2) of the original paper. Every bar is the paper's own table value.
View source evidence ↗Figures & tables
From the original paper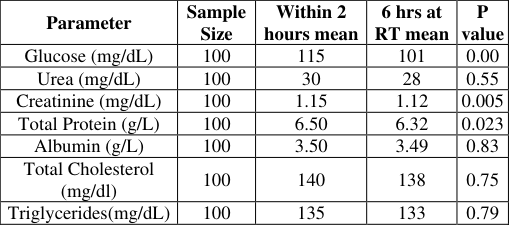 Table 1
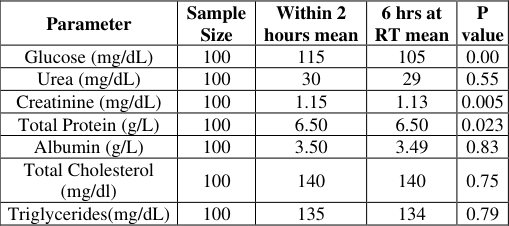 Table 2
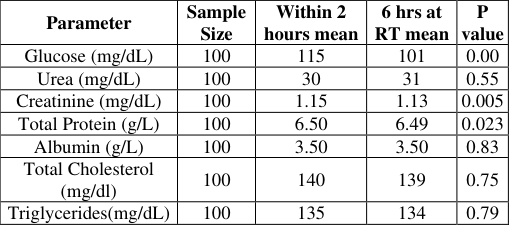 Table 3
Introduction
The diagnosis, treatment, and follow-up of patients rely heavily on the accurate measurement of numerous bloods, serum and plasma analytes as we live in the era of evidence-based medicine. The principal sources of error affecting the accuracy of any clinical laboratory test result can be categorized as preanalytical, analytical, or postanalytical [1] . For most routine assays in a clinical laboratory, serum is the sample. The laboratory receives the specimen in the form of whole blood, and then separates the serum from the clot by centrifugation. Preanalytical errors are the most common errors in the laboratories. To improve the precision and accuracy of the test results along with reduction of errors, it is necessary to monitor and control the preanalytical errors like sample storage temperature and time [2,3] . This study was done to see the impact of temperature and different storage time on the seven common biochemical parameters in serum in an attempt to detect quantitative variations when stored for different period and temperature.
Materials and Methods
This study was carried out on 100 randomly selected OPD patients as advised by their clinicians for routine biochemical tests at Dr M K Shah Medical College & SMS Multispecialty Hospital, Ahmedabad from 1 st May 2020 to 30 th June 2020. 5 ml of random venous blood samples were collected in plain clot activator tube without any anticoagulant. The samples were allowed to clot for 30 minutes at room temperature. Children, elder more than 60 years, critically ill patients and antenatal mothers were excluded from the study. Visibly hemolysed and lipemic sera were also excluded. Then the samples were centrifuged at 3000 rpm for 10 minutes. Sera were separated from each sample as early as possible within 2 hours of blood collection. Serum from each sample was distributed evenly into four groups of aliquots as below: 1st aliquot group: The separated serum was analyzed immediately within 2 hours at room temperature (20-25 °C) to get the baseline value. 2nd aliquot group: They were kept at room temperature and analyzed after 6 hours. 3rd aliquot group: They were kept in the refrigerator at 2-8 °C and analyzed after 6 hours. 4th aliquot group: They were kept in the refrigerator at 2-8 °C and analyzed after 24 hours. The aliquots were kept to avoid from light exposure by wrapping the samples with aluminium foil and stored in respective temperature conditions. Sera from all four groups of aliquots were analyzed for glucose, urea, creatinine, total protein, albumin, total cholesterol and triglycerides. Quality control values for the analytes that we studied were within ± 2 SD (standard deviation) of their respective target means during the entire procedure. All analyses were done on full auto analyzer -Miura (ISE, Italy). The different assay analytes and their principles in this study were as follows:
Glucose Estimation by GOD POD Method
Glucose is oxidized to gluconic acid and hydrogen peroxide in the presence of enzyme glucose oxidase (GOD). Hydrogen peroxide, thus liberated is converted to water and oxygen by the enzyme peroxidase (POD). 4aminoantipyrine, an oxygen acceptor takes up the oxygen and together with phenol forms a pink coloured quinoneimine dye complex. Intensity of the colour formed is directly proportional to the amount of glucose present in sample which can be measured by using green filter at 505 nm.
Urea Estimation by Urease GLDH Method
Enzyme Urease hydrolyses urea to ammonia and CO2. The ammonia formed further combines with alpha-ketoglutarate and NADH to form Glutamate and NAD+ in presence of enzyme GLDH. The concentration of NAD+ is reduced when the urea concentration in the sample is increased.
Creatinine Estimation by Enzymatic Method
Creatinine present in sample is converted into creatine by creatinine amidohydrolase. The creatine produced is hydrolyzed to sarcosine and urea by creatine amidinohydrolase. Next, the enzyme sarcosine oxidase causes the oxidative demethylation of sarcosine, yielding glycine, formaldehyde and hydrogen peroxide. In presence of peroxidase, hydrogen peroxide reacts with N-ethyl-Nsulfopropryl-m-toluidine (ESPMT) and 4aminoantipyrine, yielding a quinoneimine with maximum absorbance at 546 nm. The color intensity of the reaction product is directly proportional to the creatinine concentration in sample
Total Protein Estimation by Biuret Method
Protein in an alkaline medium bind with the cupric ions presents in the Biuret reagent to form a blue violet colored complex. The colour intensity can be measured at 540 nm to quantify the protein in the sample. Albumin Estimation by BCG Method: Albumin in buffered medium at pH 4.15 binds with the Bromocresol-Green (BCG) dye resulting in formation of green coloured complex. The Intensity of the colour formed is directly proportional to the amount of albumin present in sample which can be measured by using 630 nm filters.
Total Cholesterol Estimation by CHOD POD Method
Cholesterol esters in serum are hydrolyzed by cholesterol esterase to form free cholesterol. The free cholesterol is then oxidized to corresponding ketones and liberating hydrogen peroxide. In the presence of enzyme cholesterol oxidase (CHOD) hydrogen peroxide, thus liberated is converted to water and oxygen by the enzyme peroxidase (POD). 4aminoantipyrine, an oxygen acceptor takes up the oxygen and together with phenol forms a pink colored quinoneimine dye complex. Intensity of the colour formed is directly proportional to the amount of cholesterol present in sample which can be measured by using 505 nm green filters.
Triglycerides Estimation by GPO POD Method
Triglycerides in serum are hydrolysed by Lipoprotein Lipase to glycerol and free fatty acids. The glycerol formed with ATP in the presence of enzyme glycerol kinase forms glycerol 3 phosphates which are oxidized by the enzyme glycerol phosphate oxidase (GPO) to form hydrogen peroxide. The hydrogen peroxide thus liberated is converted to water and oxygen by the enzyme peroxidase (POD). 4aminoantipyrine, an oxygen acceptor takes up the oxygen and together with phenol forms a red colored quinoneimine dye complex. Intensity of the colour formed is directly proportional to the amount of triglycerides present in sample which can be measured by using 505 nm green filters
Results
The results were expressed as Mean values. Comparison of difference between the analytes before and after storage was done using students paired t test and p-value less than 0.05 were considered significant. Table 1 shows the comparison of mean values of serum analytes between base values within 2 hours of sample collection and readings taken after 6 hours at room temperature after sample collection. As per table 1, there was a significant change in the values of glucose, creatinine & total protein, while there was no significant change in the values of urea, albumin, total cholesterol and triglycerides. Table 2 shows the comparison of mean values of serum analytes between base values within 2 hours of sample collection and readings taken after 6 hours at 2-8° C after sample collection. As per table 2, there was a significant change in the values of glucose &creatinine, while there was no significant change in the values of urea, total protein, albumin, total cholesterol and triglycerides. As per table 3, there was a significant change in the values of glucose &creatinine, while there was no significant change in the values of urea, total protein, albumin, total cholesterol and triglycerides.
| Parameter | Sample Size | Within 2 hours mean | 6 hrs at RT mean | P value |
|---|---|---|---|---|
| Glucose (mg/dL) | 100 | 115 | 101 | 0.00 |
| Urea (mg/dL) | 100 | 30 | 31 | 0.55 |
| Creatinine (mg/dL) | 100 | 1.15 | 1.13 | 0.005 |
| Total Protein (g/L) | 100 | 6.50 | 6.49 | 0.023 |
| Albumin (g/L) | 100 | 3.50 | 3.50 | 0.83 |
| Total Cholesterol (mg/dl) | 100 | 140 | 139 | 0.75 |
| Triglycerides(mg/dL) | 100 | 135 | 134 | 0.79 |
Table text extracted from the original PDF; superscript letters are shown inline. The original table image is below.
View original table image
| Parameter | Sample Size | Within 2 hours mean | 6 hrs at RT mean | P value |
|---|---|---|---|---|
| Glucose (mg/dL) | 100 | 115 | 105 | 0.00 |
| Urea (mg/dL) | 100 | 30 | 29 | 0.55 |
| Creatinine (mg/dL) | 100 | 1.15 | 1.13 | 0.005 |
| Total Protein (g/L) | 100 | 6.50 | 6.50 | 0.023 |
| Albumin (g/L) | 100 | 3.50 | 3.49 | 0.83 |
| Total Cholesterol (mg/dl) | 100 | 140 | 140 | 0.75 |
| Triglycerides(mg/dL) | 100 | 135 | 134 | 0.79 |
Table text extracted from the original PDF; superscript letters are shown inline. The original table image is below.
View original table image
| Parameter | Sample Size | Within 2 hours mean | 6 hrs at RT mean | P value |
|---|---|---|---|---|
| Glucose (mg/dL) | 100 | 115 | 101 | 0.00 |
| Urea (mg/dL) | 100 | 30 | 28 | 0.55 |
| Creatinine (mg/dL) | 100 | 1.15 | 1.12 | 0.005 |
| Total Protein (g/L) | 100 | 6.50 | 6.32 | 0.023 |
| Albumin (g/L) | 100 | 3.50 | 3.49 | 0.83 |
| Total Cholesterol (mg/dl) | 100 | 140 | 138 | 0.75 |
| Triglycerides(mg/dL) | 100 | 135 | 133 | 0.79 |
Table text extracted from the original PDF; superscript letters are shown inline. The original table image is below.
View original table image
Discussion
Any health care professionals or laboratory staff knows that the sample collection, handling & storage is critical in giving accurate test results. Laboratory errors will lead to either repeated specimen collection for laboratory tests, or repeated laboratory analysis thus resulting in an unjustified increase in costs. Several previous studies showed variable changes in laboratory results, occurring due to poor laboratory practices and control measures [4] . Serum is the liquid portion of the blood devoid of cellular elements and clotting factors. Blood samples require 30-60 minutes to clot at room temperature. When the serum samples were allowed less than 30 minutes then, retained cells and contamination can occur. When the serum samples were allowed more than 60 minutes, cellular components may be released due to cell lysis [5] . Ideal time of serum separation from the sample for most of the common biochemical analytes is within two hours as per the recommendations of Clinical and Laboratory Standards Institute [6] . According to study by Donnelly et al, many common analytes were very much stable when stored below 20 °C, while stability was not there when stored at room temperature [7] . In another study done by Bobby et al, most of the serum analytes were stable for more than 48 hours when serum was separated immediately after blood collection and stored at room temperature of about 25 °C [8] . Sodium Fluoride is commonly added in the blood sample for glucose estimation, because it inhibits glycolysis and gives actual glucose concentration present in the sample. Level of glucose can be reduced by 7% per hour if blood is collected in a tube without sodium fluoride [9] . In the study conducted by Selvakumar et al., time delay in the analysis, the effect of ambient temperature and the effect of hemolysis are studied for common analytes like glucose, urea, creatinine, electrolytes and alkaline phosphatase. Their results showed a significant change in serum glucose and alkaline phosphatase levels after four hours and 24 hours at room temperature [10] . In our study, delay in the analysis showed changes in serum glucose which could be attributed to its utilization by glycolysis. Glucose is required for cellular metabolism and the rate at which glucose is depleted is dependent on temperature and time. At higher temperatures, there is a higher metabolic rate and glucose is depleted quickly, whereas at lower temperatures it is depleted more slowly [11] . No preservatives were added in the glucose sample in our study. Sodium fluoride is preferred as a preservative added to blood samples collected for glucose estimation to prevent glycolysis [12] . We found in our study that glucose was highly unstable when stored at room temperature for 6 hours and also when it was stored at 2 -8° C. So it is advisable to assay glucose within 2 hours after collection of blood. We also found in our study that the stability of creatinine and total protein was less when stored at room temperature for 6 hours, while the stability of urea, total cholesterol, triglycerides and albumin was good when stored at room temperature for 6 hours and also at 2-8 °C for 24 hours. Previous studies on the effect of temperature on serum analyte stability showed that majority of the analytes show detoriation at room temperature and at lower temperature (2-8 ºC) overall metabolism taking place inside RBC is reduced thereby preventing the loss of serum analytes (13). So, storing samples at 2-8 ºC was ideal for all analytes except K+.
Conclusion
In conclusion, we observed significant change amongst common biochemical parameters like glucose, creatinine and total protein when stored at room temperature for more than 6 hours. So we recommend that samples should be analyzed in the laboratory within 2 hrs of collection to ensure valid results. This study helped us to identify sensitive analytes that significantly vary when not stored properly. The results from our study helped us to determine those analytes that produce valid results despite exposure to variable storage conditions. This knowledge will help us to improve the precision and accuracy of current diagnostic strategies. However due to practical and economical constraints, sample size was small and many other biochemical parameters including enzymes were not measured and also run to run variations were not accounted.
Acknowledgement
AcknowledgmentsI am very thankful to Senior faculties, management and other staff for their support.
References
12 in the original paper- Vrancken MJV, Briscoe D, Anderson KM, Wians FH. Time-dependent stability of 22 analytes in lithiumplasma specimens stored at refrigerator temperature for up to 4 days, Lab. Med. 2012;43:268-275.
- Carraro P, Plebani M. Errors in a stat laboratory: Types and frequencies 10 years later. Clin Chem. 2007;53:1338-1342.
- Kouri T, Siloaho M, Pohjavaara S, et al., Preanalytical factors and measurement uncertainty, Scand J Clin Lab Invest. 2005;65:463-476.
- Kalra J, Saxena A, Mulla A, Neufeld H, Qureshi M, Massey KL. Medical error: A clinical laboratory approach in enhancing quality care. Clin Biochem. 2004;32:732-3.
- Timms JF, Arslan-Low E, Gentry-Maharaj A, et al. Clin Chem. PubMed. 2007;53(4):645-656.
- Donnelly JG, Soldin SJ, Nealon DA, Hicks JM. Stability of twenty-five analytes in human serum at 22 degree C, 4 degrees C and-20degree C. Pediatr Pathol Lab Led. 1995;15(6):869-874, 8.
- Bobby L Boyanton Jr, Kenneth E. Blick. Stability studies of twenty-four analytes in human plasma and serum. Clinical Chemistry. 2002;48:2242-2247.
- Weissman M, Klein B. Evaluation of glucose determination in untreated serum samples. Clin Chem. 1958;4:420-422.
- Selvakumar C, Madhubala V. Effect of sample storage and time delay (delayed processing) on analysis of common clinical biochemical parameters. International Journal of Clinical Biochemistry and Research. 2017 Jul-Sept;4(3):295-298.
- Bruns DE, William C. Knowler. Stabilization of Glucose in Blood Samples: Why It Matters. Clin Chem. 2009 Mar;55(5):850-852.
- Chan AYW, Swaminathan R, Cockram CS. Effectiveness of sodium fluoride as a preservative of glucose in blood. Clin Chem. 1989;35:315-317.
- Ono T, Kitaguchi K, Takehara M, Shiiba M, Hayami K, Serum constituent's analyses: Effect of duration and temperature of storage of clotted blood. Clin Chem. 1981;27:35-8.