
Research article · 2023 · Full text
International Journal of Advanced Chemistry ResearchEffect of edible coatings and packaging materials on quality of mango (Mangifera indica L.) in cold storage
Volume 5(1) · Pages 30–40 · DOI: 10.33545/26646781.2023.v5.i1a.141 ↗
Research areasPostharvest Quality and Shelf Life ManagementNanocomposite Films for Food PackagingPlant Physiology and Cultivation Studies
Abstract
Author-writtenThe present investigation entitled “Effect of edible coatings and packaging materials on quality of Mango (Mangifera indica L.) cv. Kesar in cold storage” was conducted during 2019-20 and 2020-21 at laboratory of Post-Harvest Technology, Department of Horticulture, M.P.K.V., Rahuri, Dist. Ahmednagar (M.S). The experiment was laid out in Factorial Completely Randomize Design, which is replicated twice with two factors i.e. Factor A: edible coating, i.e. C1-Control (without coated), C2-Alginate (2%), C3-Beeswax (2%), C4-Aloe vera gel (75%), C5-Tapioca starch (5%), C6-Cinnamon oil (0.02%), C7-Chitosan (0.5%), C8-Acacia gum (5%), C9-Pectin (2%). Factor B: packaging materials, i.e. P1-Corrugated Fibre Boxe and P2-Plastic crates. In this experiment, freshly harvested, mango fruits were selected for each treatment combination and coated with nine different coatings and packed in CFB boxes and Plastic crates as per the treatments. The treated fruits were stored in cold storage (CS) (13 °C with 90-95% R.H). Observations were taken at 4 days intervals up to the end of shelf life. Fruit coated with chitosan 0.5% (T7P1) packed in CFB box recorded significantly lowest TSS, total sugars, non-reducing sugars, and higher acidity, ascorbic acid recorded.
Summary
Source-checkedPlain-language reading of the full paper, prepared with AI and checked against the text. Each point links to the authors' own words.
Why it matters
- Mango is the national fruit of India and holds significant cultural, religious, and economic importance. View evidence ↗
- Edible coatings are used in post-harvest management to prevent dehydration, reduce transpiration, and limit microbial growth. View evidence ↗
- Proper packaging is necessary during post-harvest handling to minimize physical damage and optimize the shelf-life of produce. View evidence ↗
The question
- The study aimed to investigate how different edible coatings and packaging materials affect the quality of Kesar mangoes stored in cold storage. View evidence ↗
What they did
- The research used a Factorial Completely Randomized Design with two factors: nine edible coatings (including Alginate, Beeswax, Aloe vera gel, Tapioca starch, Cinnamon oil, Chitosan, Acacia gum, Pectin, and a control) and two packaging types (Corrugated Fibre Boxes and Plastic crates). View evidence ↗
- Mangoes were stored in cold storage at 13 °C with 90-95% relative humidity, with measurements taken every 4 days. View evidence ↗
What they found
- The lowest total soluble solids (TSS) were found in mangoes treated with 0.5% chitosan in CFB boxes, while the highest TSS occurred in uncoated fruits in plastic crates by day 24. View evidence ↗
- Mangoes coated with 0.5% chitosan in CFB boxes maintained the highest titratable acidity (0.35%), whereas the lowest (0.18%) was seen in the control group in plastic crates at day 24. View evidence ↗
- The minimum total sugar content (14.64%) was recorded for 0.5% chitosan in CFB boxes, while the maximum (16.20%) was found in the control group in plastic crates at day 24. View evidence ↗
- The lowest non-reducing sugar levels (8.60%) were observed in beeswax-coated fruits in CFB boxes, compared to the highest (10.01%) in the control group in plastic crates at day 24. View evidence ↗
- The highest ascorbic acid content (36.49 mg/100 g) was found in 0.5% chitosan-coated fruits in CFB boxes, while the lowest (38.05 mg/100 g) was in the control group in plastic crates at day 24. View evidence ↗
- TSS increased more slowly in Corrugated Fibre Boxes (P1) than in Plastic crates (P2), with P1 reaching 17.260B and P2 reaching 18.010B by day 28. View evidence ↗
What it means
- The authors conclude that edible coatings and packaging materials improve mango quality, and specifically that Corrugated Fibre Boxes are a better alternative to plastic crates. View evidence ↗
- The authors state that edible coating technology is an eco-friendly solution that is necessary for current food preservation needs. View evidence ↗
Visual summary
2 visualsIllustrations explain the paper; charts are replotted from the paper's own table values.
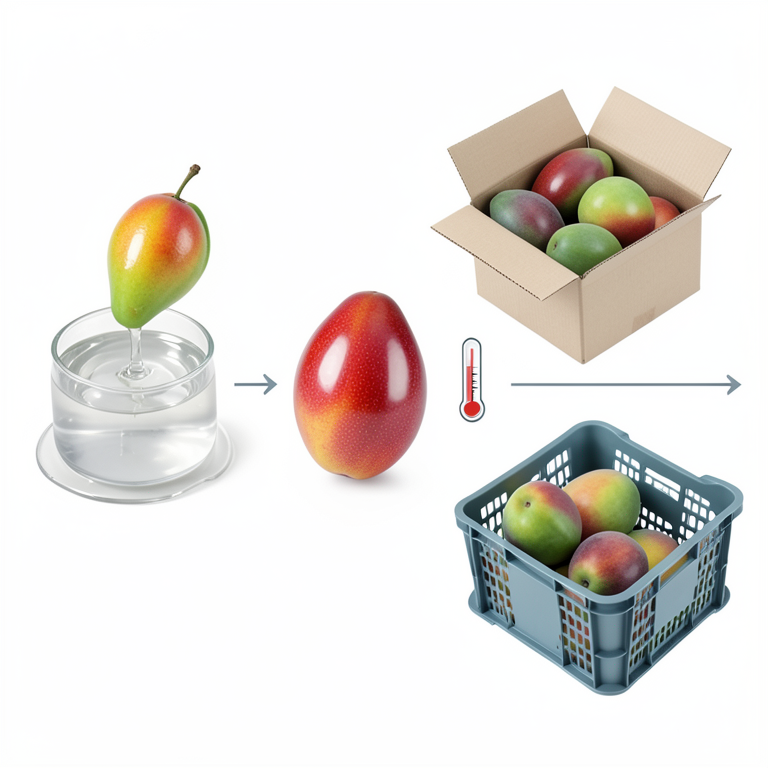
Experimental Setup
AI-generated conceptual illustration (Mango fruits (Mangifera indica L.)). It explains the idea and does not show study data.
View source evidence ↗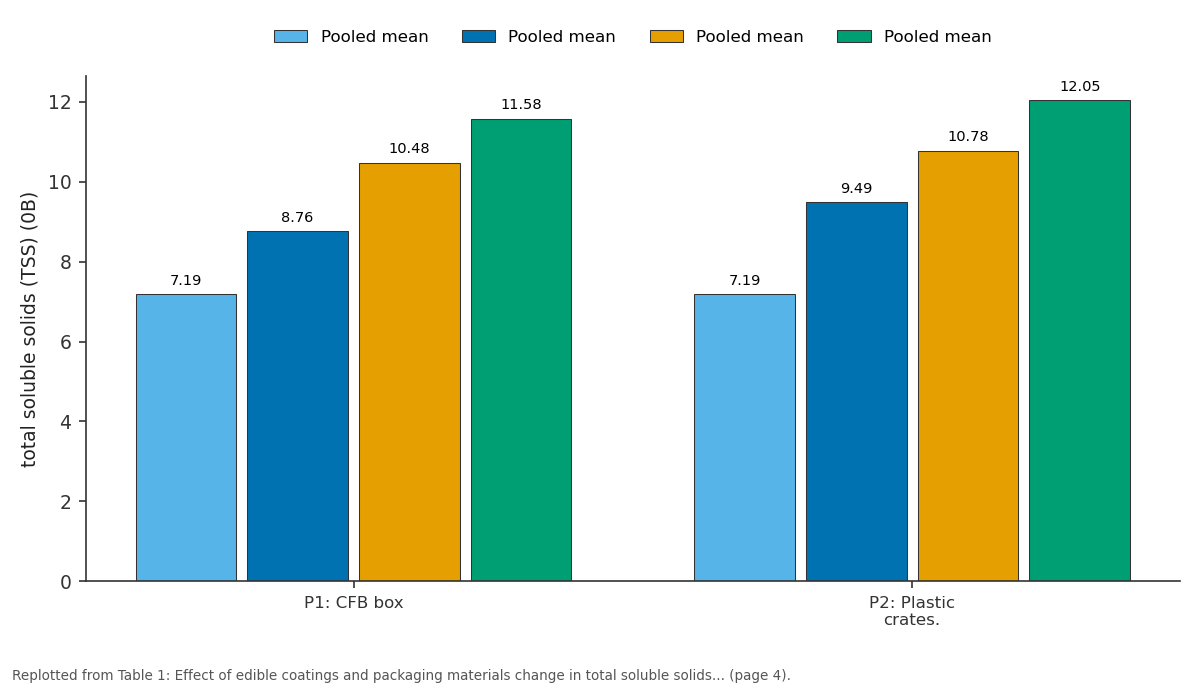
Pooled mean and Pooled mean and more: P1: CFB box vs P2: Plastic crates.
Replotted from Table 1 (page 4) of the original paper. Every bar is the paper's own table value.
View source evidence ↗Figures & tables
From the original paper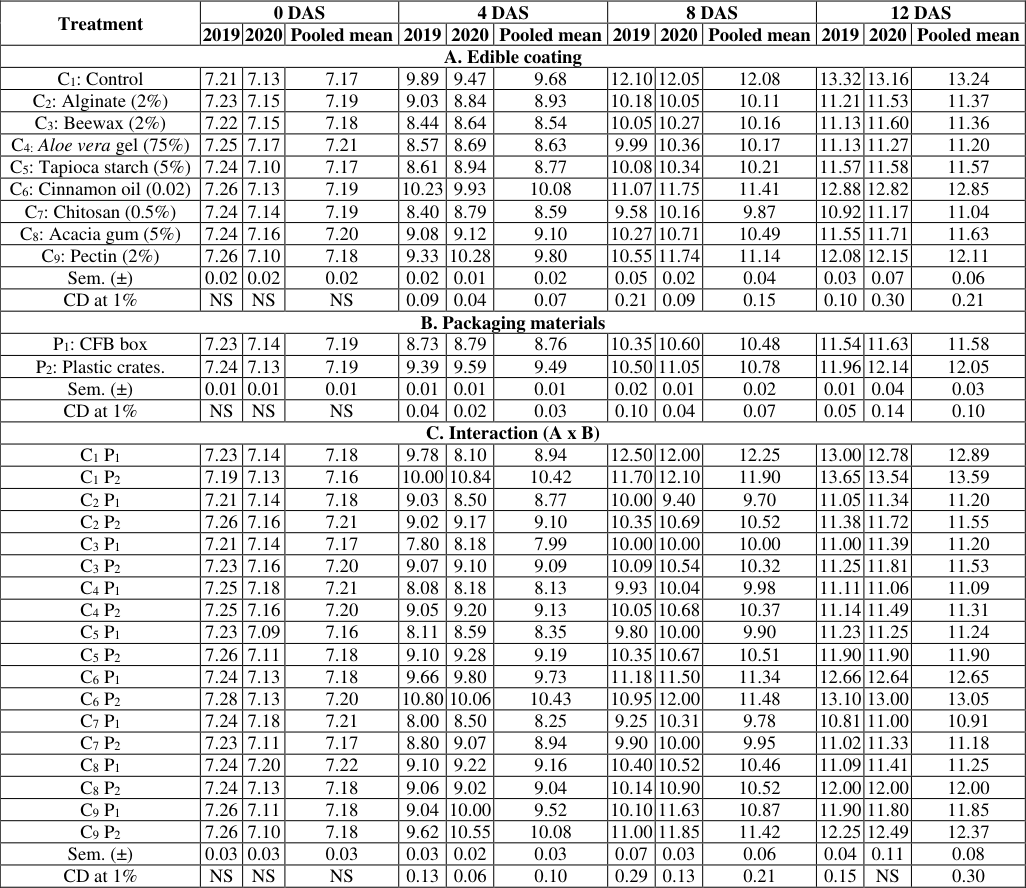 Table 1
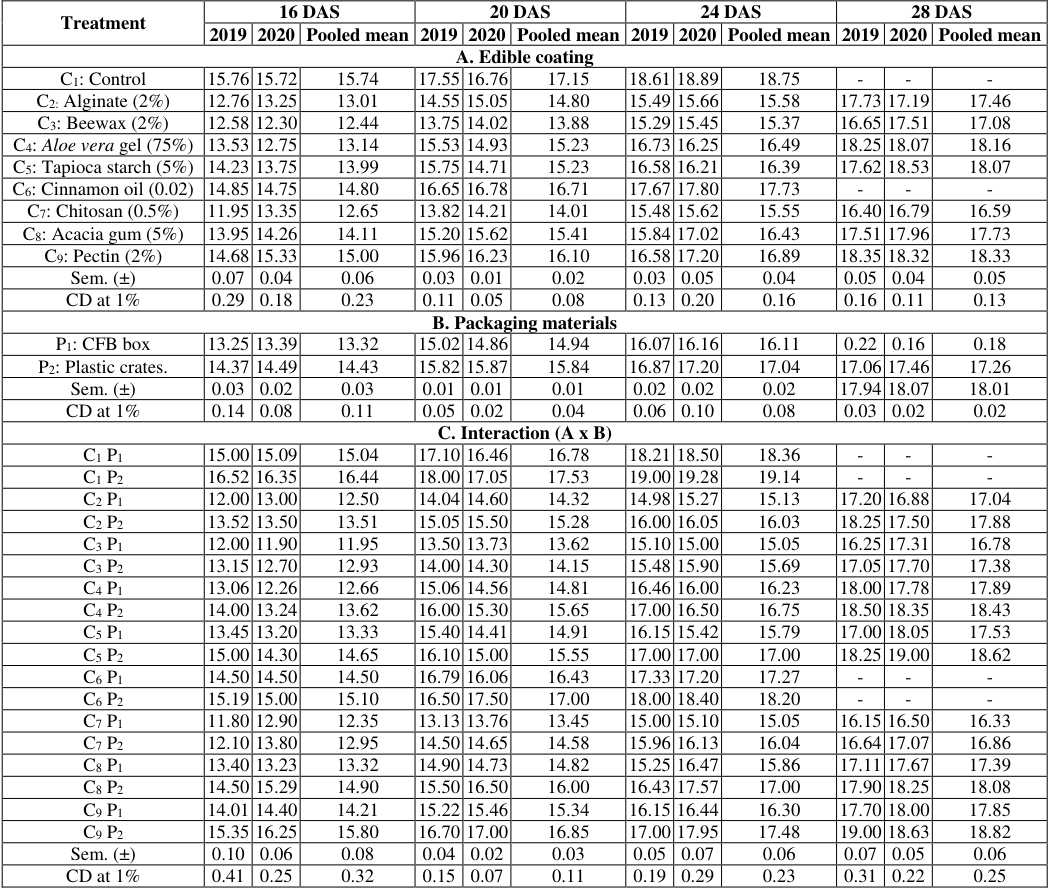 Table 2
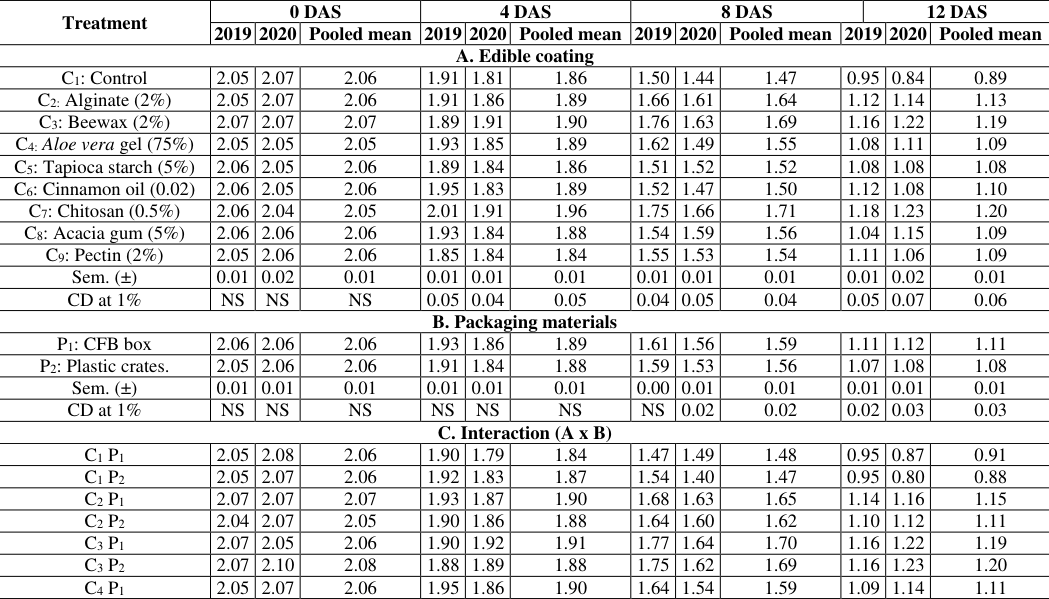 Table 2
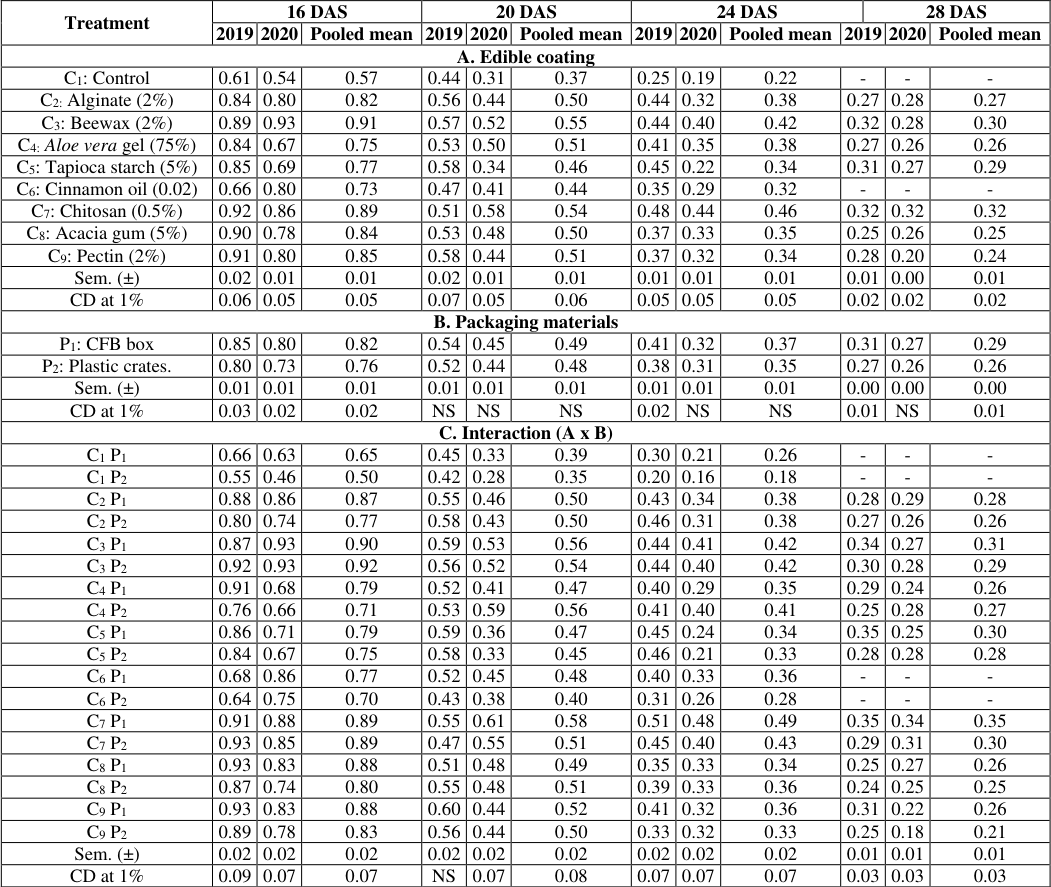 Table 3
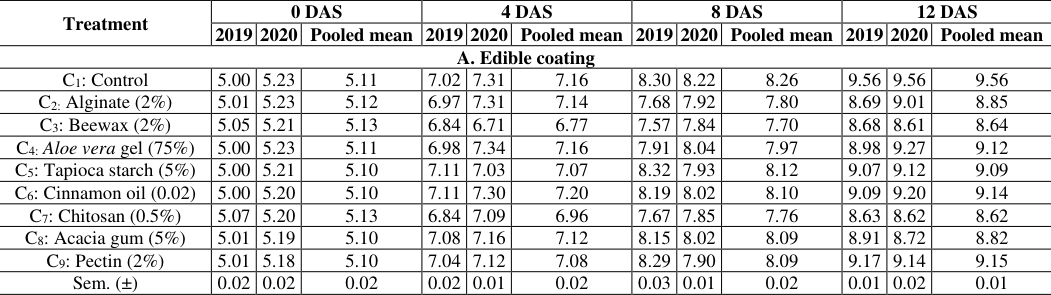 Table 3
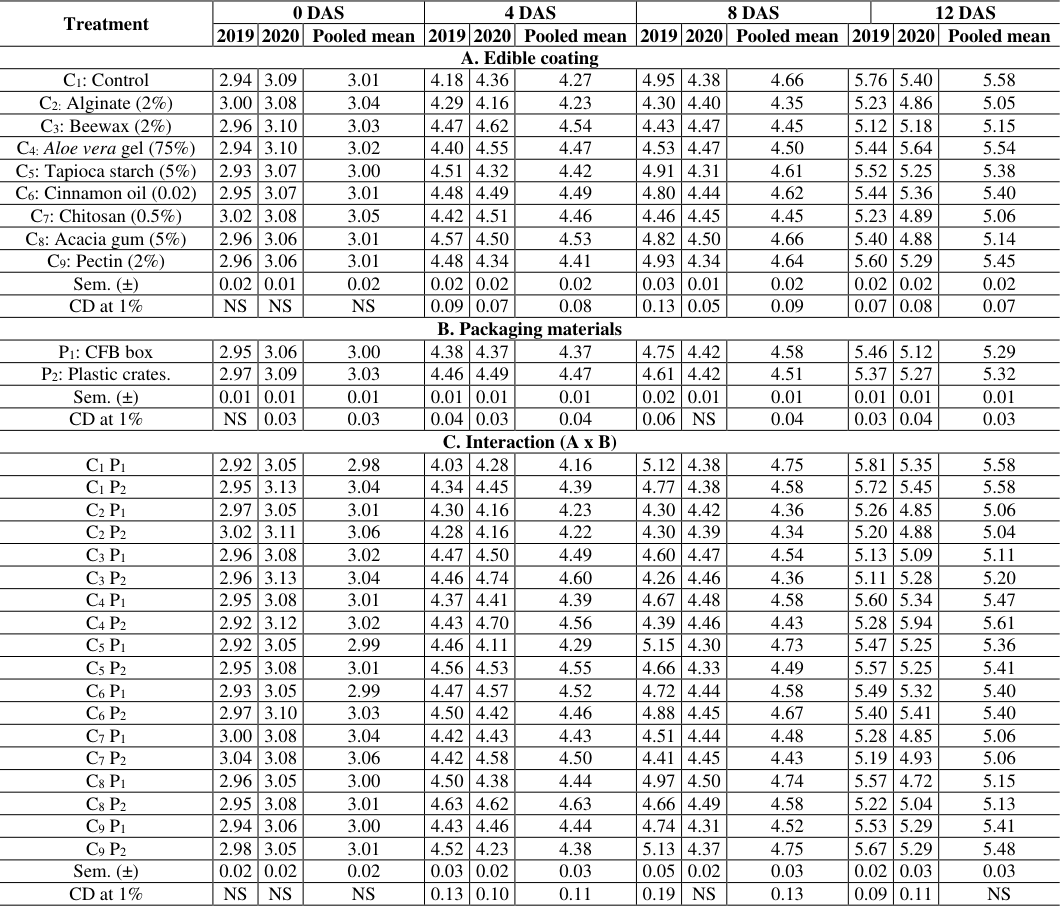 Table 4
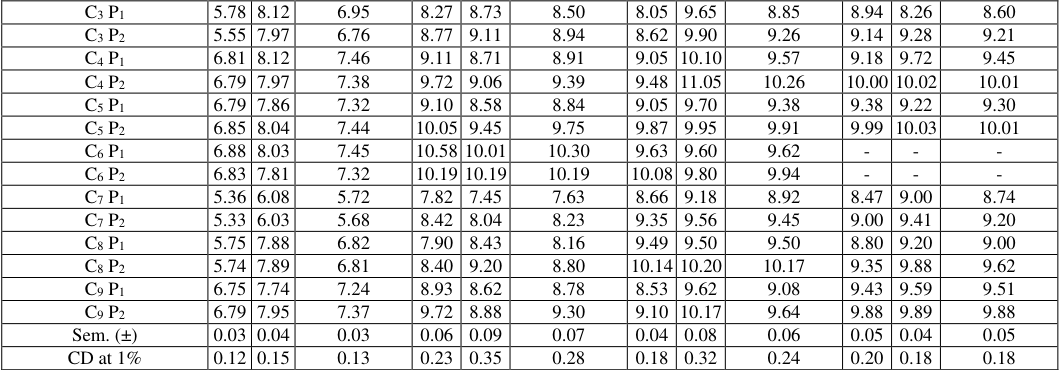 Table 5
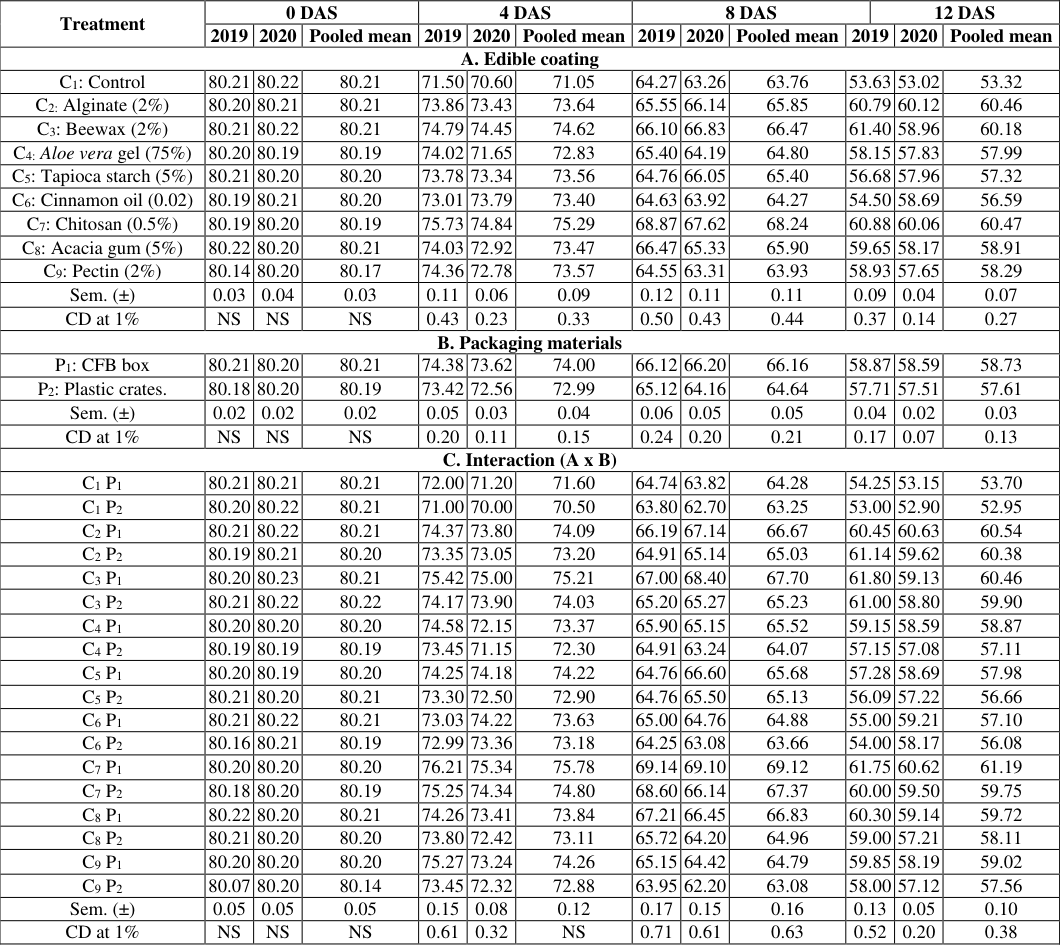 Table 5
Introduction
Mango (Mangifera indica L.) is one of the oldest sub-tropical fruit which is rightly known as "King of Fruits". It has intimate association with cultural religious, aesthetic and economic lives of Indians Since time immemorial and hence it is the national fruit of India. It is originated from South East Asia, the Indo Burma region, in foothills of the Himalayans (Mukhrjee, 1997) [9] . Mango is member of Anacardiaceous family. Mango can grow on wide variety of soils under varied climatic condition. Kesar is the important commercial cultivar of Mango and also leading variety for export. It is also preferred variety for mango pulp processors. It is a dual-purpose variety used for both table and juice purposes, as juice are moderately abundant. Edible coatings are one of the techniques used in post-harvest management of fruits. They reduce microbial proliferation, delay dehydration, and prevent a high rate of transpiration from fruits and vegetables (Adetunji et al., 2014) [2] . Healthy and eco-friendly postharvest treatments/technologies are very demanding now-a-days (Prasad and Sharma, 2016) [12] . Films and edible coatings are defined as "a thin application of material that forms a protective barrier around an edible commodity and can be consumed along with the coated product" (Guilbert, 1986) [5] . Chitosan is natural coating material used in several fruit for prolonging their shelf life (Graham, 1990) [4] . Alginate coating as a biodegradable compound can be used to maintain the quality during the shelf life of fruits and vegetables (Somayeh et al., 2019) [19] . (Sharma and Gautam, 2013) [17] Aloe vera gel is a novel edible coating for organic fruit storage technology. Starchs are good oxygen barrier, used for edibal coating vegetables and fruits characterized by high respiration rates (Durango et al., 2006) [3] . The gums are polysaccharides based products which are soluble in water. They include exudate gums (Gum Arabic), extractive gums (locust bean and guar) and microbial. Pectin is a complex anionic polysaccharide composed of β-1, 4-linked d-galacturonic acid residues (Sanchez, 2016) [15] . Packaging is an essential and indispensable component at different steps of postharvest handling. Packaging essential to minimize physical damage to fresh produce in order to obtain optimal shelf-life. Many fruits like mangoes, apples, grapes, etc. TSS value is defined as the amount of sugar and soluble minerals present in fruits. Total soluble solids (TSS) were determined with the help of Hand refract meter (Erma Japan, 0 to 32 0 Brix) and value was corrected at 20 °C with the help of temperature correction chart (A.O.A.C., 1975).
Acidity was estimated by the procedure described by Ranganna (1986) [14] . Ten grams of sample was ground well and transferred to volumetric flask and volume was made to 100 ml with distilled water. The contents were filtered through Whatmann No. 1 filter paper. An aliquot of 10 ml was taken into a conical flask and 2-3 drops of phenolphthalein indicator was added and then titrated against 0.1N NaOH. Appearance of light pink colour denotes the end point. It was calculated using the following formula and expressed in percentage (Eq. wt. of citric acid = 0.064).
The total sugars of mango fruit were determined by the method of Lane and Eynon (1923) [8] as described by Ranganna (1977) [13] . In 250 ml conical flask, 50 ml of lead free solution prepared for estimation of reducing sugars was taken. To this, 10 ml of conc. HCl (1:1) added, invert the sucrose and kept for 24 hrs. The solution was taken in 250 ml volumetric flask and neutralized by adding 1N NaOH. The volume of the neutralized hydrolysate was made to 250 ml with distilled water. This hydrolysate was used for determination of total sugars by titrating it against the boiling mixture of Fehling's solution A and B (5 ml each) using methylene blue as indicator. Total sugars were by calculated using the following formula and the results are expressed on percent basis.
The non-reducing sugars were calculated as difference between total and reducing sugars by using the following formula.
Non-reducing sugars (%) = Total sugars (%) -Reducing sugars (%) 6. Ascorbic acid (mg/100 g) Ascorbic acid was estimated by Indophenol method (Ranganna, 1986) [14] . Ten grams of fresh fruit sample was ground well and blended with 3% Meta phosphoric acid (HPO 3 ) and the volume was made to 100 ml with HPO 3 solution. An aliquot of 10 ml was taken and titrated against standard dye solution (2, 6 dichlorophenol indophenol dye) till light pink colour persist for at least 15 seconds. Standardization of dye (dye factor) was done by titrating it against standard ascorbic acid diluted in 3% HPO 3 solution. The ascorbic acid was calculated using the following formula and expressed as mg ascorbic acid per 100 g fresh weight.
Statistical analysis
The design adopted was completely randomized design with factorial concept and the data were subjected to statistical analysis as per the procedure advocated by Panse and Sukhatme (1995) [10] .
Results and Discussion 1. Total soluble solids ( 0 Brix) TSS showed significant difference with coatings treatments throughout the storage period in cold storage ( [21] who explained that lower levels of total soluble solids in fruits coated with chitosan may be due to protective oxygen barrier that reduces oxygen supply to the fruit surface which in turn inhibited respiration. Sharafat et al. (1990) [16] found that as storage is prolonged, the rate of respiration, transpiration and other metabolic changes are more in control fruits than edible coated mango fruits. Kittur et al.
(2001) [7] Chitosan coatings were increase shelf-life and quality of banana and mango than polysaccharide-based coating.
In cold storage pooled data clearly showed that the treatment C 7 maximum titratable acidity (0.32%) which was statistically at par with the treatment of C 3 (0.30%) at 28 th day of storage. Whereas, minimum titratable acidity (0.22%) was observed in control C 1 at 24 th day of storage. Packaging materials effect revealed non-significant result with respect to acidity during storage except at 16 th day. Rate of decrease in acidity was slow in P 1 as compared to P 2 . Highest acidity recorded by P 1 and P 2 was 0.29 and 0.26 percent at 28 th day respectively. The interaction effect of different coating and packaging material, during storage on fruit titratable acidity was significant during storage. The data presented in the Table 2 showed that titratable acidity of the fruits in the pooled data shows decreasing trend up to 28 th day of storage. The maximum titratable acidity (0.35%) was observed in the treatment C 7 P 1 (chitosan 0.5% + CFB box), which followed by the treatment C 3 P 1 (beeswax 2% + CFB box) (0.35%). Whereas, minimum titratable acidity (0.18%) was observed in control C 1 P 2 (control + plastic crates) treatment at 24 th day. At the end of the storage the minimum value was recorded for the control treatment and higher of titratable acidity was recorded for mango fruits coated with chitosan 0.5% and beeswax 2% they found that edible coating reduce the respiration rate of the fruits and thus rate of utilization of the respiratory substrates such as organic acids was so minimal similarly result higher acidity due to postharvest treatments that delay respiration could be a result of the reduced utilization rate of respiratory substrates such as organic acids.
| Treatment | 0 DAS | — | — | 4 DAS | — | — | 8 DAS | — | — | — | 12 DAS | — | — |
|---|---|---|---|---|---|---|---|---|---|---|---|---|---|
| 2019 | 2020 | Pooled mean | 2019 | 2020 | Pooled mean | 2019 | 2020 | Pooled mean | 2019 | 2020 | Pooled mean | ||
| A. Edible coating | |||||||||||||
| C1: Control | 2.05 | 2.07 | 2.06 | 1.91 | 1.81 | 1.86 | 1.50 | 1.44 | 1.47 | 0.95 | 0.84 | 0.89 | |
| C2: Alginate (2%) | 2.05 | 2.07 | 2.06 | 1.91 | 1.86 | 1.89 | 1.66 | 1.61 | 1.64 | 1.12 | 1.14 | 1.13 | |
| C3: Beewax (2%) | 2.07 | 2.07 | 2.07 | 1.89 | 1.91 | 1.90 | 1.76 | 1.63 | 1.69 | 1.16 | 1.22 | 1.19 | |
| C4: Aloe vera gel (75%) | 2.05 | 2.05 | 2.05 | 1.93 | 1.85 | 1.89 | 1.62 | 1.49 | 1.55 | 1.08 | 1.11 | 1.09 | |
| C5: Tapioca starch (5%) | 2.06 | 2.05 | 2.06 | 1.89 | 1.84 | 1.86 | 1.51 | 1.52 | 1.52 | 1.08 | 1.08 | 1.08 | |
| C6: Cinnamon oil (0.02) | 2.06 | 2.05 | 2.06 | 1.95 | 1.83 | 1.89 | 1.52 | 1.47 | 1.50 | 1.12 | 1.08 | 1.10 | |
| C7: Chitosan (0.5%) | 2.06 | 2.04 | 2.05 | 2.01 | 1.91 | 1.96 | 1.75 | 1.66 | 1.71 | 1.18 | 1.23 | 1.20 | |
| C8: Acacia gum (5%) | 2.06 | 2.06 | 2.06 | 1.93 | 1.84 | 1.88 | 1.54 | 1.59 | 1.56 | 1.04 | 1.15 | 1.09 | |
| C9: Pectin (2%) | 2.05 | 2.06 | 2.06 | 1.85 | 1.84 | 1.84 | 1.55 | 1.53 | 1.54 | 1.11 | 1.06 | 1.09 | |
| Sem. (±) | 0.01 | 0.02 | 0.01 | 0.01 | 0.01 | 0.01 | 0.01 | 0.01 | 0.01 | 0.01 | 0.02 | 0.01 | |
| CD at 1% | NS | NS | NS | 0.05 | 0.04 | 0.05 | 0.04 | 0.05 | 0.04 | 0.05 | 0.07 | 0.06 | |
| B. Packaging materials | |||||||||||||
| P1: CFB box | 2.06 | 2.06 | 2.06 | 1.93 | 1.86 | 1.89 | 1.61 | 1.56 | 1.59 | 1.11 | 1.12 | 1.11 | |
| P2: Plastic crates. | 2.05 | 2.06 | 2.06 | 1.91 | 1.84 | 1.88 | 1.59 | 1.53 | 1.56 | 1.07 | 1.08 | 1.08 | |
| Sem. (±) | 0.01 | 0.01 | 0.01 | 0.01 | 0.01 | 0.01 | 0.00 | 0.01 | 0.01 | 0.01 | 0.01 | 0.01 | |
| CD at 1% | NS | NS | NS | NS | NS | NS | NS | 0.02 | 0.02 | 0.02 | 0.03 | 0.03 | |
| C. Interaction (A x B) | |||||||||||||
| C1 P1 | 2.05 | 2.08 | 2.06 | 1.90 | 1.79 | 1.84 | 1.47 | 1.49 | 1.48 | 0.95 | 0.87 | 0.91 | |
| C1 P2 | 2.05 | 2.07 | 2.06 | 1.92 | 1.83 | 1.87 | 1.54 | 1.40 | 1.47 | 0.95 | 0.80 | 0.88 | |
| C2 P1 | 2.07 | 2.07 | 2.07 | 1.93 | 1.87 | 1.90 | 1.68 | 1.63 | 1.65 | 1.14 | 1.16 | 1.15 | |
| C2 P2 | 2.04 | 2.07 | 2.05 | 1.90 | 1.86 | 1.88 | 1.64 | 1.60 | 1.62 | 1.10 | 1.12 | 1.11 | |
| C3 P1 | 2.07 | 2.05 | 2.06 | 1.90 | 1.92 | 1.91 | 1.77 | 1.64 | 1.70 | 1.16 | 1.22 | 1.19 | |
| C3 P2 | 2.07 | 2.10 | 2.08 | 1.88 | 1.89 | 1.88 | 1.75 | 1.62 | 1.69 | 1.16 | 1.23 | 1.20 | |
| C4 P1 | 2.05 | 2.07 | 2.06 | 1.95 | 1.86 | 1.90 | 1.64 | 1.54 | 1.59 | 1.09 | 1.14 | 1.11 |
Table text extracted from the original PDF; superscript letters are shown inline. The original table image is below.
View original table image
| Treatment | 16 DAS | — | — | 20 DAS | — | — | 24 DAS | — | — | 28 DAS | — | — |
|---|---|---|---|---|---|---|---|---|---|---|---|---|
| 2019 | 2020 | Pooled mean | 2019 | 2020 | Pooled mean | 2019 | 2020 | Pooled mean | 2019 | 2020 | Pooled mean | |
| A. Edible coating | ||||||||||||
| C1: Control | 15.76 | 15.72 | 15.74 | 17.55 | 16.76 | 17.15 | 18.61 | 18.89 | 18.75 | - | - | - |
| C2: Alginate (2%) | 12.76 | 13.25 | 13.01 | 14.55 | 15.05 | 14.80 | 15.49 | 15.66 | 15.58 | 17.73 | 17.19 | 17.46 |
| C3: Beewax (2%) | 12.58 | 12.30 | 12.44 | 13.75 | 14.02 | 13.88 | 15.29 | 15.45 | 15.37 | 16.65 | 17.51 | 17.08 |
| C4: Aloe vera gel (75%) | 13.53 | 12.75 | 13.14 | 15.53 | 14.93 | 15.23 | 16.73 | 16.25 | 16.49 | 18.25 | 18.07 | 18.16 |
| C5: Tapioca starch (5%) | 14.23 | 13.75 | 13.99 | 15.75 | 14.71 | 15.23 | 16.58 | 16.21 | 16.39 | 17.62 | 18.53 | 18.07 |
| C6: Cinnamon oil (0.02) | 14.85 | 14.75 | 14.80 | 16.65 | 16.78 | 16.71 | 17.67 | 17.80 | 17.73 | - | - | - |
| C7: Chitosan (0.5%) | 11.95 | 13.35 | 12.65 | 13.82 | 14.21 | 14.01 | 15.48 | 15.62 | 15.55 | 16.40 | 16.79 | 16.59 |
| C8: Acacia gum (5%) | 13.95 | 14.26 | 14.11 | 15.20 | 15.62 | 15.41 | 15.84 | 17.02 | 16.43 | 17.51 | 17.96 | 17.73 |
| C9: Pectin (2%) | 14.68 | 15.33 | 15.00 | 15.96 | 16.23 | 16.10 | 16.58 | 17.20 | 16.89 | 18.35 | 18.32 | 18.33 |
| Sem. (±) | 0.07 | 0.04 | 0.06 | 0.03 | 0.01 | 0.02 | 0.03 | 0.05 | 0.04 | 0.05 | 0.04 | 0.05 |
| CD at 1% | 0.29 | 0.18 | 0.23 | 0.11 | 0.05 | 0.08 | 0.13 | 0.20 | 0.16 | 0.16 | 0.11 | 0.13 |
| B. Packaging materials | ||||||||||||
| P1: CFB box | 13.25 | 13.39 | 13.32 | 15.02 | 14.86 | 14.94 | 16.07 | 16.16 | 16.11 | 0.22 | 0.16 | 0.18 |
| P2: Plastic crates. | 14.37 | 14.49 | 14.43 | 15.82 | 15.87 | 15.84 | 16.87 | 17.20 | 17.04 | 17.06 | 17.46 | 17.26 |
| Sem. (±) | 0.03 | 0.02 | 0.03 | 0.01 | 0.01 | 0.01 | 0.02 | 0.02 | 0.02 | 17.94 | 18.07 | 18.01 |
| CD at 1% | 0.14 | 0.08 | 0.11 | 0.05 | 0.02 | 0.04 | 0.06 | 0.10 | 0.08 | 0.03 | 0.02 | 0.02 |
| C. Interaction (A x B) | ||||||||||||
| C1 P1 | 15.00 | 15.09 | 15.04 | 17.10 | 16.46 | 16.78 | 18.21 | 18.50 | 18.36 | - | - | - |
| C1 P2 | 16.52 | 16.35 | 16.44 | 18.00 | 17.05 | 17.53 | 19.00 | 19.28 | 19.14 | - | - | - |
| C2 P1 | 12.00 | 13.00 | 12.50 | 14.04 | 14.60 | 14.32 | 14.98 | 15.27 | 15.13 | 17.20 | 16.88 | 17.04 |
| C2 P2 | 13.52 | 13.50 | 13.51 | 15.05 | 15.50 | 15.28 | 16.00 | 16.05 | 16.03 | 18.25 | 17.50 | 17.88 |
| C3 P1 | 12.00 | 11.90 | 11.95 | 13.50 | 13.73 | 13.62 | 15.10 | 15.00 | 15.05 | 16.25 | 17.31 | 16.78 |
| C3 P2 | 13.15 | 12.70 | 12.93 | 14.00 | 14.30 | 14.15 | 15.48 | 15.90 | 15.69 | 17.05 | 17.70 | 17.38 |
| C4 P1 | 13.06 | 12.26 | 12.66 | 15.06 | 14.56 | 14.81 | 16.46 | 16.00 | 16.23 | 18.00 | 17.78 | 17.89 |
| C4 P2 | 14.00 | 13.24 | 13.62 | 16.00 | 15.30 | 15.65 | 17.00 | 16.50 | 16.75 | 18.50 | 18.35 | 18.43 |
| C5 P1 | 13.45 | 13.20 | 13.33 | 15.40 | 14.41 | 14.91 | 16.15 | 15.42 | 15.79 | 17.00 | 18.05 | 17.53 |
| C5 P2 | 15.00 | 14.30 | 14.65 | 16.10 | 15.00 | 15.55 | 17.00 | 17.00 | 17.00 | 18.25 | 19.00 | 18.62 |
| C6 P1 | 14.50 | 14.50 | 14.50 | 16.79 | 16.06 | 16.43 | 17.33 | 17.20 | 17.27 | - | - | - |
| C6 P2 | 15.19 | 15.00 | 15.10 | 16.50 | 17.50 | 17.00 | 18.00 | 18.40 | 18.20 | - | - | - |
| C7 P1 | 11.80 | 12.90 | 12.35 | 13.13 | 13.76 | 13.45 | 15.00 | 15.10 | 15.05 | 16.15 | 16.50 | 16.33 |
| C7 P2 | 12.10 | 13.80 | 12.95 | 14.50 | 14.65 | 14.58 | 15.96 | 16.13 | 16.04 | 16.64 | 17.07 | 16.86 |
| C8 P1 | 13.40 | 13.23 | 13.32 | 14.90 | 14.73 | 14.82 | 15.25 | 16.47 | 15.86 | 17.11 | 17.67 | 17.39 |
| C8 P2 | 14.50 | 15.29 | 14.90 | 15.50 | 16.50 | 16.00 | 16.43 | 17.57 | 17.00 | 17.90 | 18.25 | 18.08 |
| C9 P1 | 14.01 | 14.40 | 14.21 | 15.22 | 15.46 | 15.34 | 16.15 | 16.44 | 16.30 | 17.70 | 18.00 | 17.85 |
| C9 P2 | 15.35 | 16.25 | 15.80 | 16.70 | 17.00 | 16.85 | 17.00 | 17.95 | 17.48 | 19.00 | 18.63 | 18.82 |
| Sem. (±) | 0.10 | 0.06 | 0.08 | 0.04 | 0.02 | 0.03 | 0.05 | 0.07 | 0.06 | 0.07 | 0.05 | 0.06 |
| CD at 1% | 0.41 | 0.25 | 0.32 | 0.15 | 0.07 | 0.11 | 0.19 | 0.29 | 0.23 | 0.31 | 0.22 | 0.25 |
Table text extracted from the original PDF; superscript letters are shown inline. The original table image is below.
View original table image
The data on effect of coating on total sugars (%) of mango in CS has been presented in Table 3. The pooled data clearly showed that the minimum total sugars were seen in C 7 (14.86%). It was followed by C 3 ( Considering the effect of coating and packaging the total sugar is one of the most important factor of fruit quality. The possible reasons and findings associated with increase in total sugar up to peak and slight decline with increase in storage period and lower percentage of total sugar in treated fruits of chitosan 0.5% and beeswax 2% accumulation of sugar as a consequence of starch hydrolysis, further at the over ripe stage the leaching of sugar was carried out because of hydrolysis process. Similar results was also recorded by Kapse (1993) [6] and Singh et al. (2000) [18] .
| Treatment | 0 DAS | — | — | 4 DAS | — | — | 8 DAS | — | — | 12 DAS | — | — |
|---|---|---|---|---|---|---|---|---|---|---|---|---|
| 2019 | 2020 | Pooled mean | 2019 | 2020 | Pooled mean | 2019 | 2020 | Pooled mean | 2019 | 2020 | Pooled mean | |
| A. Edible coating | ||||||||||||
| C1: Control | 5.00 | 5.23 | 5.11 | 7.02 | 7.31 | 7.16 | 8.30 | 8.22 | 8.26 | 9.56 | 9.56 | 9.56 |
| C2: Alginate (2%) | 5.01 | 5.23 | 5.12 | 6.97 | 7.31 | 7.14 | 7.68 | 7.92 | 7.80 | 8.69 | 9.01 | 8.85 |
| C3: Beewax (2%) | 5.05 | 5.21 | 5.13 | 6.84 | 6.71 | 6.77 | 7.57 | 7.84 | 7.70 | 8.68 | 8.61 | 8.64 |
| C4: Aloe vera gel (75%) | 5.00 | 5.23 | 5.11 | 6.98 | 7.34 | 7.16 | 7.91 | 8.04 | 7.97 | 8.98 | 9.27 | 9.12 |
| C5: Tapioca starch (5%) | 5.00 | 5.21 | 5.10 | 7.11 | 7.03 | 7.07 | 8.32 | 7.93 | 8.12 | 9.07 | 9.12 | 9.09 |
| C6: Cinnamon oil (0.02) | 5.00 | 5.20 | 5.10 | 7.11 | 7.30 | 7.20 | 8.19 | 8.02 | 8.10 | 9.09 | 9.20 | 9.14 |
| C7: Chitosan (0.5%) | 5.07 | 5.20 | 5.13 | 6.84 | 7.09 | 6.96 | 7.67 | 7.85 | 7.76 | 8.63 | 8.62 | 8.62 |
| C8: Acacia gum (5%) | 5.01 | 5.19 | 5.10 | 7.08 | 7.16 | 7.12 | 8.15 | 8.02 | 8.09 | 8.91 | 8.72 | 8.82 |
| C9: Pectin (2%) | 5.01 | 5.18 | 5.10 | 7.04 | 7.12 | 7.08 | 8.29 | 7.90 | 8.09 | 9.17 | 9.14 | 9.15 |
| Sem. (±) | 0.02 | 0.02 | 0.02 | 0.02 | 0.01 | 0.02 | 0.03 | 0.01 | 0.02 | 0.01 | 0.02 | 0.01 |
Table text extracted from the original PDF; superscript letters are shown inline. The original table image is below.
View original table image
| Treatment | 16 DAS | — | — | 20 DAS | — | — | 24 DAS | — | — | — | 28 DAS | — | — |
|---|---|---|---|---|---|---|---|---|---|---|---|---|---|
| 2019 | 2020 | Pooled mean | 2019 | 2020 | Pooled mean | 2019 | 2020 | Pooled mean | 2019 | 2020 | Pooled mean | ||
| A. Edible coating | |||||||||||||
| C1: Control | 0.61 | 0.54 | 0.57 | 0.44 | 0.31 | 0.37 | 0.25 | 0.19 | 0.22 | - | - | - | |
| C2: Alginate (2%) | 0.84 | 0.80 | 0.82 | 0.56 | 0.44 | 0.50 | 0.44 | 0.32 | 0.38 | 0.27 | 0.28 | 0.27 | |
| C3: Beewax (2%) | 0.89 | 0.93 | 0.91 | 0.57 | 0.52 | 0.55 | 0.44 | 0.40 | 0.42 | 0.32 | 0.28 | 0.30 | |
| C4: Aloe vera gel (75%) | 0.84 | 0.67 | 0.75 | 0.53 | 0.50 | 0.51 | 0.41 | 0.35 | 0.38 | 0.27 | 0.26 | 0.26 | |
| C5: Tapioca starch (5%) | 0.85 | 0.69 | 0.77 | 0.58 | 0.34 | 0.46 | 0.45 | 0.22 | 0.34 | 0.31 | 0.27 | 0.29 | |
| C6: Cinnamon oil (0.02) | 0.66 | 0.80 | 0.73 | 0.47 | 0.41 | 0.44 | 0.35 | 0.29 | 0.32 | - | - | - | |
| C7: Chitosan (0.5%) | 0.92 | 0.86 | 0.89 | 0.51 | 0.58 | 0.54 | 0.48 | 0.44 | 0.46 | 0.32 | 0.32 | 0.32 | |
| C8: Acacia gum (5%) | 0.90 | 0.78 | 0.84 | 0.53 | 0.48 | 0.50 | 0.37 | 0.33 | 0.35 | 0.25 | 0.26 | 0.25 | |
| C9: Pectin (2%) | 0.91 | 0.80 | 0.85 | 0.58 | 0.44 | 0.51 | 0.37 | 0.32 | 0.34 | 0.28 | 0.20 | 0.24 | |
| Sem. (±) | 0.02 | 0.01 | 0.01 | 0.02 | 0.01 | 0.01 | 0.01 | 0.01 | 0.01 | 0.01 | 0.00 | 0.01 | |
| CD at 1% | 0.06 | 0.05 | 0.05 | 0.07 | 0.05 | 0.06 | 0.05 | 0.05 | 0.05 | 0.02 | 0.02 | 0.02 | |
| B. Packaging materials | |||||||||||||
| P1: CFB box | 0.85 | 0.80 | 0.82 | 0.54 | 0.45 | 0.49 | 0.41 | 0.32 | 0.37 | 0.31 | 0.27 | 0.29 | |
| P2: Plastic crates. | 0.80 | 0.73 | 0.76 | 0.52 | 0.44 | 0.48 | 0.38 | 0.31 | 0.35 | 0.27 | 0.26 | 0.26 | |
| Sem. (±) | 0.01 | 0.01 | 0.01 | 0.01 | 0.01 | 0.01 | 0.01 | 0.01 | 0.01 | 0.00 | 0.00 | 0.00 | |
| CD at 1% | 0.03 | 0.02 | 0.02 | NS | NS | NS | 0.02 | NS | NS | 0.01 | NS | 0.01 | |
| C. Interaction (A x B) | |||||||||||||
| C1 P1 | 0.66 | 0.63 | 0.65 | 0.45 | 0.33 | 0.39 | 0.30 | 0.21 | 0.26 | - | - | - | |
| C1 P2 | 0.55 | 0.46 | 0.50 | 0.42 | 0.28 | 0.35 | 0.20 | 0.16 | 0.18 | - | - | - | |
| C2 P1 | 0.88 | 0.86 | 0.87 | 0.55 | 0.46 | 0.50 | 0.43 | 0.34 | 0.38 | 0.28 | 0.29 | 0.28 | |
| C2 P2 | 0.80 | 0.74 | 0.77 | 0.58 | 0.43 | 0.50 | 0.46 | 0.31 | 0.38 | 0.27 | 0.26 | 0.26 | |
| C3 P1 | 0.87 | 0.93 | 0.90 | 0.59 | 0.53 | 0.56 | 0.44 | 0.41 | 0.42 | 0.34 | 0.27 | 0.31 | |
| C3 P2 | 0.92 | 0.93 | 0.92 | 0.56 | 0.52 | 0.54 | 0.44 | 0.40 | 0.42 | 0.30 | 0.28 | 0.29 | |
| C4 P1 | 0.91 | 0.68 | 0.79 | 0.52 | 0.41 | 0.47 | 0.40 | 0.29 | 0.35 | 0.29 | 0.24 | 0.26 | |
| C4 P2 | 0.76 | 0.66 | 0.71 | 0.53 | 0.59 | 0.56 | 0.41 | 0.40 | 0.41 | 0.25 | 0.28 | 0.27 | |
| C5 P1 | 0.86 | 0.71 | 0.79 | 0.59 | 0.36 | 0.47 | 0.45 | 0.24 | 0.34 | 0.35 | 0.25 | 0.30 | |
| C5 P2 | 0.84 | 0.67 | 0.75 | 0.58 | 0.33 | 0.45 | 0.46 | 0.21 | 0.33 | 0.28 | 0.28 | 0.28 | |
| C6 P1 | 0.68 | 0.86 | 0.77 | 0.52 | 0.45 | 0.48 | 0.40 | 0.33 | 0.36 | - | - | - | |
| C6 P2 | 0.64 | 0.75 | 0.70 | 0.43 | 0.38 | 0.40 | 0.31 | 0.26 | 0.28 | - | - | - | |
| C7 P1 | 0.91 | 0.88 | 0.89 | 0.55 | 0.61 | 0.58 | 0.51 | 0.48 | 0.49 | 0.35 | 0.34 | 0.35 | |
| C7 P2 | 0.93 | 0.85 | 0.89 | 0.47 | 0.55 | 0.51 | 0.45 | 0.40 | 0.43 | 0.29 | 0.31 | 0.30 | |
| C8 P1 | 0.93 | 0.83 | 0.88 | 0.51 | 0.48 | 0.49 | 0.35 | 0.33 | 0.34 | 0.25 | 0.27 | 0.26 | |
| C8 P2 | 0.87 | 0.74 | 0.80 | 0.55 | 0.48 | 0.51 | 0.39 | 0.33 | 0.36 | 0.24 | 0.25 | 0.25 | |
| C9 P1 | 0.93 | 0.83 | 0.88 | 0.60 | 0.44 | 0.52 | 0.41 | 0.32 | 0.36 | 0.31 | 0.22 | 0.26 | |
| C9 P2 | 0.89 | 0.78 | 0.83 | 0.56 | 0.44 | 0.50 | 0.33 | 0.32 | 0.33 | 0.25 | 0.18 | 0.21 | |
| Sem. (±) | 0.02 | 0.02 | 0.02 | 0.02 | 0.02 | 0.02 | 0.02 | 0.02 | 0.02 | 0.01 | 0.01 | 0.01 | |
| CD at 1% | 0.09 | 0.07 | 0.07 | NS | 0.07 | 0.08 | 0.07 | 0.07 | 0.07 | 0.03 | 0.03 | 0.03 |
Table text extracted from the original PDF; superscript letters are shown inline. The original table image is below.
View original table image
The data on effect of coating on non-reducing sugars (%) of mango in CS has been presented in Table 4. The pooled data clearly showed that the minimum non-reducing sugars were seen in C 3 (8.90%). It was followed by C 7 (8.97%) treatment 28 th day of storage. Maximum (9.91%) non-reducing sugars was observed in C 1 P 2 (control + plastic crates) treatment 24 th day of storage. Packaging material showed significant difference during storage in CS. Rate of increasing in total sugars (%) was slow in P 1 as compared to P 2 . Highest nonreducing sugars recorded by P 1 and P 2 was 9.12 and 9.64 percent at 28 th day. The interaction effect of different coatings and packaging materials during storage on fruit non-reducing sugars (%) was significant during storage. The pooled data presented in the Table 4 showed that the minimum non-reducing sugars (8.60%) was observed in the treatment C 3 P 1 (beeswax 2% + CFB box) which is followed by C 7 P 1 (chitosan 0.5% + CFB box) (8.74%) maximum nonreducing sugars was observed (10.01%) in C 1 P 2 (control + plastic crates) treatment at 24 th day. Non-reducing sugars content was continuously increased during the storage period up to peak than decline slightly in fruits of Kesar mango. This may be a consequence of release of sugar during starch hydrolysis. Mango is a climacteric fruit, rich in starch reserves and during postharvest storage starch is hydrolyzed and liberating reducing sugars with enhancement of storage Kapse, 1993 and Singh et al., 2000) [6,18] .
| Treatment | 0 DAS | — | — | 4 DAS | — | — | 8 DAS | — | — | — | 12 DAS | — | — |
|---|---|---|---|---|---|---|---|---|---|---|---|---|---|
| 2019 | 2020 | Pooled mean | 2019 | 2020 | Pooled mean | 2019 | 2020 | Pooled mean | 2019 | 2020 | Pooled mean | ||
| A. Edible coating | |||||||||||||
| C1: Control | 2.94 | 3.09 | 3.01 | 4.18 | 4.36 | 4.27 | 4.95 | 4.38 | 4.66 | 5.76 | 5.40 | 5.58 | |
| C2: Alginate (2%) | 3.00 | 3.08 | 3.04 | 4.29 | 4.16 | 4.23 | 4.30 | 4.40 | 4.35 | 5.23 | 4.86 | 5.05 | |
| C3: Beewax (2%) | 2.96 | 3.10 | 3.03 | 4.47 | 4.62 | 4.54 | 4.43 | 4.47 | 4.45 | 5.12 | 5.18 | 5.15 | |
| C4: Aloe vera gel (75%) | 2.94 | 3.10 | 3.02 | 4.40 | 4.55 | 4.47 | 4.53 | 4.47 | 4.50 | 5.44 | 5.64 | 5.54 | |
| C5: Tapioca starch (5%) | 2.93 | 3.07 | 3.00 | 4.51 | 4.32 | 4.42 | 4.91 | 4.31 | 4.61 | 5.52 | 5.25 | 5.38 | |
| C6: Cinnamon oil (0.02) | 2.95 | 3.07 | 3.01 | 4.48 | 4.49 | 4.49 | 4.80 | 4.44 | 4.62 | 5.44 | 5.36 | 5.40 | |
| C7: Chitosan (0.5%) | 3.02 | 3.08 | 3.05 | 4.42 | 4.51 | 4.46 | 4.46 | 4.45 | 4.45 | 5.23 | 4.89 | 5.06 | |
| C8: Acacia gum (5%) | 2.96 | 3.06 | 3.01 | 4.57 | 4.50 | 4.53 | 4.82 | 4.50 | 4.66 | 5.40 | 4.88 | 5.14 | |
| C9: Pectin (2%) | 2.96 | 3.06 | 3.01 | 4.48 | 4.34 | 4.41 | 4.93 | 4.34 | 4.64 | 5.60 | 5.29 | 5.45 | |
| Sem. (±) | 0.02 | 0.01 | 0.02 | 0.02 | 0.02 | 0.02 | 0.03 | 0.01 | 0.02 | 0.02 | 0.02 | 0.02 | |
| CD at 1% | NS | NS | NS | 0.09 | 0.07 | 0.08 | 0.13 | 0.05 | 0.09 | 0.07 | 0.08 | 0.07 | |
| B. Packaging materials | |||||||||||||
| P1: CFB box | 2.95 | 3.06 | 3.00 | 4.38 | 4.37 | 4.37 | 4.75 | 4.42 | 4.58 | 5.46 | 5.12 | 5.29 | |
| P2: Plastic crates. | 2.97 | 3.09 | 3.03 | 4.46 | 4.49 | 4.47 | 4.61 | 4.42 | 4.51 | 5.37 | 5.27 | 5.32 | |
| Sem. (±) | 0.01 | 0.01 | 0.01 | 0.01 | 0.01 | 0.01 | 0.02 | 0.01 | 0.01 | 0.01 | 0.01 | 0.01 | |
| CD at 1% | NS | 0.03 | 0.03 | 0.04 | 0.03 | 0.04 | 0.06 | NS | 0.04 | 0.03 | 0.04 | 0.03 | |
| C. Interaction (A x B) | |||||||||||||
| C1 P1 | 2.92 | 3.05 | 2.98 | 4.03 | 4.28 | 4.16 | 5.12 | 4.38 | 4.75 | 5.81 | 5.35 | 5.58 | |
| C1 P2 | 2.95 | 3.13 | 3.04 | 4.34 | 4.45 | 4.39 | 4.77 | 4.38 | 4.58 | 5.72 | 5.45 | 5.58 | |
| C2 P1 | 2.97 | 3.05 | 3.01 | 4.30 | 4.16 | 4.23 | 4.30 | 4.42 | 4.36 | 5.26 | 4.85 | 5.06 | |
| C2 P2 | 3.02 | 3.11 | 3.06 | 4.28 | 4.16 | 4.22 | 4.30 | 4.39 | 4.34 | 5.20 | 4.88 | 5.04 | |
| C3 P1 | 2.96 | 3.08 | 3.02 | 4.47 | 4.50 | 4.49 | 4.60 | 4.47 | 4.54 | 5.13 | 5.09 | 5.11 | |
| C3 P2 | 2.96 | 3.13 | 3.04 | 4.46 | 4.74 | 4.60 | 4.26 | 4.46 | 4.36 | 5.11 | 5.28 | 5.20 | |
| C4 P1 | 2.95 | 3.08 | 3.01 | 4.37 | 4.41 | 4.39 | 4.67 | 4.48 | 4.58 | 5.60 | 5.34 | 5.47 | |
| C4 P2 | 2.92 | 3.12 | 3.02 | 4.43 | 4.70 | 4.56 | 4.39 | 4.46 | 4.43 | 5.28 | 5.94 | 5.61 | |
| C5 P1 | 2.92 | 3.05 | 2.99 | 4.46 | 4.11 | 4.29 | 5.15 | 4.30 | 4.73 | 5.47 | 5.25 | 5.36 | |
| C5 P2 | 2.95 | 3.08 | 3.01 | 4.56 | 4.53 | 4.55 | 4.66 | 4.33 | 4.49 | 5.57 | 5.25 | 5.41 | |
| C6 P1 | 2.93 | 3.05 | 2.99 | 4.47 | 4.57 | 4.52 | 4.72 | 4.44 | 4.58 | 5.49 | 5.32 | 5.40 | |
| C6 P2 | 2.97 | 3.10 | 3.03 | 4.50 | 4.42 | 4.46 | 4.88 | 4.45 | 4.67 | 5.40 | 5.41 | 5.40 | |
| C7 P1 | 3.00 | 3.08 | 3.04 | 4.42 | 4.43 | 4.43 | 4.51 | 4.44 | 4.48 | 5.28 | 4.85 | 5.06 | |
| C7 P2 | 3.04 | 3.08 | 3.06 | 4.42 | 4.58 | 4.50 | 4.41 | 4.45 | 4.43 | 5.19 | 4.93 | 5.06 | |
| C8 P1 | 2.96 | 3.05 | 3.00 | 4.50 | 4.38 | 4.44 | 4.97 | 4.50 | 4.74 | 5.57 | 4.72 | 5.15 | |
| C8 P2 | 2.95 | 3.08 | 3.01 | 4.63 | 4.62 | 4.63 | 4.66 | 4.49 | 4.58 | 5.22 | 5.04 | 5.13 | |
| C9 P1 | 2.94 | 3.06 | 3.00 | 4.43 | 4.46 | 4.44 | 4.74 | 4.31 | 4.52 | 5.53 | 5.29 | 5.41 | |
| C9 P2 | 2.98 | 3.05 | 3.01 | 4.52 | 4.23 | 4.38 | 5.13 | 4.37 | 4.75 | 5.67 | 5.29 | 5.48 | |
| Sem. (±) | 0.02 | 0.02 | 0.02 | 0.03 | 0.02 | 0.03 | 0.05 | 0.02 | 0.03 | 0.02 | 0.03 | 0.03 | |
| CD at 1% | NS | NS | NS | 0.13 | 0.10 | 0.11 | 0.19 | NS | 0.13 | 0.09 | 0.11 | NS |
Table text extracted from the original PDF; superscript letters are shown inline. The original table image is below.
View original table image
In cold storage pooled data clearly showed that the treatment C 7 maximum ascorbic acid (35.87 mg/100 g) which was statistically at par with the treatment of C 3 (35.48 mg/100 g) at 28 th day of storage. Whereas, minimum ascorbic acid (38.03 mg/100 g) was observed in control C 1 at 24 th day of storage. Packaging materials effect revealed significant result with respect to ascorbic acid during storage. Rate of decrease in ascorbic acid was slow in P 1 as compared to P 2 . Highest ascorbic acid recorded by P 1 and P 2 was 34.28 mg/100 g and 33.12 mg/100 g at 28 th day respectively. The interaction effect of different coating and packaging material, during storage on fruit ascorbic acid was significant during storage. The data presented in the Table 5 showed that ascorbic acid of the fruits in the pooled data showed decreasing trend up to 28 th day of storage. The maximum ascorbic acid (36.49 mg/100 g) was observed in the treatment C 7 P 1 (chitosan 0.5% + CFB box), which followed by the treatment C 3 P 1 (beeswax 2% + CFB box) (35.98 mg/100 g). Whereas, minimum ascorbic acid (38.05 mg/100 g) was observed in control C 1 P 2 (control + plastic crates) treatment at 24 th day of storage.
| Treatment | 0 DAS | — | — | 4 DAS | — | — | 8 DAS | — | — | — | 12 DAS | — | — |
|---|---|---|---|---|---|---|---|---|---|---|---|---|---|
| 2019 | 2020 | Pooled mean | 2019 | 2020 | Pooled mean | 2019 | 2020 | Pooled mean | 2019 | 2020 | Pooled mean | ||
| A. Edible coating | |||||||||||||
| C1: Control | 80.21 | 80.22 | 80.21 | 71.50 | 70.60 | 71.05 | 64.27 | 63.26 | 63.76 | 53.63 | 53.02 | 53.32 | |
| C2: Alginate (2%) | 80.20 | 80.21 | 80.21 | 73.86 | 73.43 | 73.64 | 65.55 | 66.14 | 65.85 | 60.79 | 60.12 | 60.46 | |
| C3: Beewax (2%) | 80.21 | 80.22 | 80.21 | 74.79 | 74.45 | 74.62 | 66.10 | 66.83 | 66.47 | 61.40 | 58.96 | 60.18 | |
| C4: Aloe vera gel (75%) | 80.20 | 80.19 | 80.19 | 74.02 | 71.65 | 72.83 | 65.40 | 64.19 | 64.80 | 58.15 | 57.83 | 57.99 | |
| C5: Tapioca starch (5%) | 80.21 | 80.20 | 80.20 | 73.78 | 73.34 | 73.56 | 64.76 | 66.05 | 65.40 | 56.68 | 57.96 | 57.32 | |
| C6: Cinnamon oil (0.02) | 80.19 | 80.21 | 80.20 | 73.01 | 73.79 | 73.40 | 64.63 | 63.92 | 64.27 | 54.50 | 58.69 | 56.59 | |
| C7: Chitosan (0.5%) | 80.19 | 80.20 | 80.19 | 75.73 | 74.84 | 75.29 | 68.87 | 67.62 | 68.24 | 60.88 | 60.06 | 60.47 | |
| C8: Acacia gum (5%) | 80.22 | 80.20 | 80.21 | 74.03 | 72.92 | 73.47 | 66.47 | 65.33 | 65.90 | 59.65 | 58.17 | 58.91 | |
| C9: Pectin (2%) | 80.14 | 80.20 | 80.17 | 74.36 | 72.78 | 73.57 | 64.55 | 63.31 | 63.93 | 58.93 | 57.65 | 58.29 | |
| Sem. (±) | 0.03 | 0.04 | 0.03 | 0.11 | 0.06 | 0.09 | 0.12 | 0.11 | 0.11 | 0.09 | 0.04 | 0.07 | |
| CD at 1% | NS | NS | NS | 0.43 | 0.23 | 0.33 | 0.50 | 0.43 | 0.44 | 0.37 | 0.14 | 0.27 | |
| B. Packaging materials | |||||||||||||
| P1: CFB box | 80.21 | 80.20 | 80.21 | 74.38 | 73.62 | 74.00 | 66.12 | 66.20 | 66.16 | 58.87 | 58.59 | 58.73 | |
| P2: Plastic crates. | 80.18 | 80.20 | 80.19 | 73.42 | 72.56 | 72.99 | 65.12 | 64.16 | 64.64 | 57.71 | 57.51 | 57.61 | |
| Sem. (±) | 0.02 | 0.02 | 0.02 | 0.05 | 0.03 | 0.04 | 0.06 | 0.05 | 0.05 | 0.04 | 0.02 | 0.03 | |
| CD at 1% | NS | NS | NS | 0.20 | 0.11 | 0.15 | 0.24 | 0.20 | 0.21 | 0.17 | 0.07 | 0.13 | |
| C. Interaction (A x B) | |||||||||||||
| C1 P1 | 80.21 | 80.21 | 80.21 | 72.00 | 71.20 | 71.60 | 64.74 | 63.82 | 64.28 | 54.25 | 53.15 | 53.70 | |
| C1 P2 | 80.20 | 80.22 | 80.21 | 71.00 | 70.00 | 70.50 | 63.80 | 62.70 | 63.25 | 53.00 | 52.90 | 52.95 | |
| C2 P1 | 80.21 | 80.22 | 80.21 | 74.37 | 73.80 | 74.09 | 66.19 | 67.14 | 66.67 | 60.45 | 60.63 | 60.54 | |
| C2 P2 | 80.19 | 80.21 | 80.20 | 73.35 | 73.05 | 73.20 | 64.91 | 65.14 | 65.03 | 61.14 | 59.62 | 60.38 | |
| C3 P1 | 80.20 | 80.23 | 80.21 | 75.42 | 75.00 | 75.21 | 67.00 | 68.40 | 67.70 | 61.80 | 59.13 | 60.46 | |
| C3 P2 | 80.21 | 80.22 | 80.22 | 74.17 | 73.90 | 74.03 | 65.20 | 65.27 | 65.23 | 61.00 | 58.80 | 59.90 | |
| C4 P1 | 80.20 | 80.20 | 80.20 | 74.58 | 72.15 | 73.37 | 65.90 | 65.15 | 65.52 | 59.15 | 58.59 | 58.87 | |
| C4 P2 | 80.19 | 80.19 | 80.19 | 73.45 | 71.15 | 72.30 | 64.91 | 63.24 | 64.07 | 57.15 | 57.08 | 57.11 | |
| C5 P1 | 80.20 | 80.19 | 80.20 | 74.25 | 74.18 | 74.22 | 64.76 | 66.60 | 65.68 | 57.28 | 58.69 | 57.98 | |
| C5 P2 | 80.21 | 80.20 | 80.21 | 73.30 | 72.50 | 72.90 | 64.76 | 65.50 | 65.13 | 56.09 | 57.22 | 56.66 | |
| C6 P1 | 80.21 | 80.22 | 80.21 | 73.03 | 74.22 | 73.63 | 65.00 | 64.76 | 64.88 | 55.00 | 59.21 | 57.10 | |
| C6 P2 | 80.16 | 80.21 | 80.19 | 72.99 | 73.36 | 73.18 | 64.25 | 63.08 | 63.66 | 54.00 | 58.17 | 56.08 | |
| C7 P1 | 80.20 | 80.20 | 80.20 | 76.21 | 75.34 | 75.78 | 69.14 | 69.10 | 69.12 | 61.75 | 60.62 | 61.19 | |
| C7 P2 | 80.18 | 80.20 | 80.19 | 75.25 | 74.34 | 74.80 | 68.60 | 66.14 | 67.37 | 60.00 | 59.50 | 59.75 | |
| C8 P1 | 80.22 | 80.20 | 80.21 | 74.26 | 73.41 | 73.84 | 67.21 | 66.45 | 66.83 | 60.30 | 59.14 | 59.72 | |
| C8 P2 | 80.21 | 80.20 | 80.20 | 73.80 | 72.42 | 73.11 | 65.72 | 64.20 | 64.96 | 59.00 | 57.21 | 58.11 | |
| C9 P1 | 80.20 | 80.20 | 80.20 | 75.27 | 73.24 | 74.26 | 65.15 | 64.42 | 64.79 | 59.85 | 58.19 | 59.02 | |
| C9 P2 | 80.07 | 80.20 | 80.14 | 73.45 | 72.32 | 72.88 | 63.95 | 62.20 | 63.08 | 58.00 | 57.12 | 57.56 | |
| Sem. (±) | 0.05 | 0.05 | 0.05 | 0.15 | 0.08 | 0.12 | 0.17 | 0.15 | 0.16 | 0.13 | 0.05 | 0.10 | |
| CD at 1% | NS | NS | NS | 0.61 | 0.32 | NS | 0.71 | 0.61 | 0.63 | 0.52 | 0.20 | 0.38 |
Table text extracted from the original PDF; superscript letters are shown inline. The original table image is below.
View original table image
| C3 P1 | 5.78 | 8.12 | 6.95 | 8.27 | 8.73 | 8.50 | 8.05 | 9.65 | 8.85 | 8.94 | 8.26 | 8.60 |
|---|---|---|---|---|---|---|---|---|---|---|---|---|
| C3 P2 | 5.55 | 7.97 | 6.76 | 8.77 | 9.11 | 8.94 | 8.62 | 9.90 | 9.26 | 9.14 | 9.28 | 9.21 |
| C4 P1 | 6.81 | 8.12 | 7.46 | 9.11 | 8.71 | 8.91 | 9.05 | 10.10 | 9.57 | 9.18 | 9.72 | 9.45 |
| C4 P2 | 6.79 | 7.97 | 7.38 | 9.72 | 9.06 | 9.39 | 9.48 | 11.05 | 10.26 | 10.00 | 10.02 | 10.01 |
| C5 P1 | 6.79 | 7.86 | 7.32 | 9.10 | 8.58 | 8.84 | 9.05 | 9.70 | 9.38 | 9.38 | 9.22 | 9.30 |
| C5 P2 | 6.85 | 8.04 | 7.44 | 10.05 | 9.45 | 9.75 | 9.87 | 9.95 | 9.91 | 9.99 | 10.03 | 10.01 |
| C6 P1 | 6.88 | 8.03 | 7.45 | 10.58 | 10.01 | 10.30 | 9.63 | 9.60 | 9.62 | - | - | - |
| C6 P2 | 6.83 | 7.81 | 7.32 | 10.19 | 10.19 | 10.19 | 10.08 | 9.80 | 9.94 | - | - | - |
| C7 P1 | 5.36 | 6.08 | 5.72 | 7.82 | 7.45 | 7.63 | 8.66 | 9.18 | 8.92 | 8.47 | 9.00 | 8.74 |
| C7 P2 | 5.33 | 6.03 | 5.68 | 8.42 | 8.04 | 8.23 | 9.35 | 9.56 | 9.45 | 9.00 | 9.41 | 9.20 |
| C8 P1 | 5.75 | 7.88 | 6.82 | 7.90 | 8.43 | 8.16 | 9.49 | 9.50 | 9.50 | 8.80 | 9.20 | 9.00 |
| C8 P2 | 5.74 | 7.89 | 6.81 | 8.40 | 9.20 | 8.80 | 10.14 | 10.20 | 10.17 | 9.35 | 9.88 | 9.62 |
| C9 P1 | 6.75 | 7.74 | 7.24 | 8.93 | 8.62 | 8.78 | 8.53 | 9.62 | 9.08 | 9.43 | 9.59 | 9.51 |
| C9 P2 | 6.79 | 7.95 | 7.37 | 9.72 | 8.88 | 9.30 | 9.10 | 10.17 | 9.64 | 9.88 | 9.89 | 9.88 |
| Sem. (±) | 0.03 | 0.04 | 0.03 | 0.06 | 0.09 | 0.07 | 0.04 | 0.08 | 0.06 | 0.05 | 0.04 | 0.05 |
| CD at 1% | 0.12 | 0.15 | 0.13 | 0.23 | 0.35 | 0.28 | 0.18 | 0.32 | 0.24 | 0.20 | 0.18 | 0.18 |
Table text extracted from the original PDF; superscript letters are shown inline. The original table image is below.
View original table image
The ascorbic acid content of mango cv. Kesar was found to be decreased in all coated fruit during the advancement of storage period in both storage conditions however the rate was faster in uncoated fruit as compared to coated fruit. While uncoated fruits showed high ascorbic acid content than coated ones. A decline in ascorbic acid content of the mango fruits might be due to utilization of ascorbic acid in respiration process during ripening at ambient conditions and cold storage. This might be due to the presence of oxygen at surroundings during storage, which increased in respiration rate, thus, resulted in the release of water. This, there by increased the degradation of ascorbic acid as ascorbic acid is readily oxidized in the presence of moisture maximum on ascorbic acid was recorded in coated fruit Similar trend was also observed by Wong et at., (2016) [20] .
Conclusion
From the experiment to study the effect of edible coatings and packaging materials on quality of mango cv. Kesar. It can be concluded that, edible coating and packaging materials improve the quality of mango fruit. All the coated fruits showed significantly reduced weight loss and delayed changes in the ripening parameters such as TSS, acidity, sugars, and ascorbic acid, of mango fruit. Coating and Packaging had significant interaction effects on the biochemical qualities of Kesar mango fruits in cold storage.
In this experiment, it can be concluded that while CFB box is a better alternate for plastic crates. From the presented research it can be said that edible coating technology is a eco-friendly and needed of present era. Various food and food safety regulatory bodies and drug administrations have approved and prescribed the safe limits of edible coatings. The advantage of storage of fruit by using edible coating is easily applicable with cheap and locally available raw materials.
Figures and tables from the paper
| Treatment | 0 DAS | — | — | 4 DAS | — | — | 8 DAS | — | — | 12 DAS | — | — |
|---|---|---|---|---|---|---|---|---|---|---|---|---|
| 2019 | 2020 | Pooled mean | 2019 | 2020 | Pooled mean | 2019 | 2020 | Pooled mean | 2019 | 2020 | Pooled mean | |
| A. Edible coating | ||||||||||||
| C1: Control | 7.21 | 7.13 | 7.17 | 9.89 | 9.47 | 9.68 | 12.10 | 12.05 | 12.08 | 13.32 | 13.16 | 13.24 |
| C2: Alginate (2%) | 7.23 | 7.15 | 7.19 | 9.03 | 8.84 | 8.93 | 10.18 | 10.05 | 10.11 | 11.21 | 11.53 | 11.37 |
| C3: Beewax (2%) | 7.22 | 7.15 | 7.18 | 8.44 | 8.64 | 8.54 | 10.05 | 10.27 | 10.16 | 11.13 | 11.60 | 11.36 |
| C4: Aloe vera gel (75%) | 7.25 | 7.17 | 7.21 | 8.57 | 8.69 | 8.63 | 9.99 | 10.36 | 10.17 | 11.13 | 11.27 | 11.20 |
| C5: Tapioca starch (5%) | 7.24 | 7.10 | 7.17 | 8.61 | 8.94 | 8.77 | 10.08 | 10.34 | 10.21 | 11.57 | 11.58 | 11.57 |
| C6: Cinnamon oil (0.02) | 7.26 | 7.13 | 7.19 | 10.23 | 9.93 | 10.08 | 11.07 | 11.75 | 11.41 | 12.88 | 12.82 | 12.85 |
| C7: Chitosan (0.5%) | 7.24 | 7.14 | 7.19 | 8.40 | 8.79 | 8.59 | 9.58 | 10.16 | 9.87 | 10.92 | 11.17 | 11.04 |
| C8: Acacia gum (5%) | 7.24 | 7.16 | 7.20 | 9.08 | 9.12 | 9.10 | 10.27 | 10.71 | 10.49 | 11.55 | 11.71 | 11.63 |
| C9: Pectin (2%) | 7.26 | 7.10 | 7.18 | 9.33 | 10.28 | 9.80 | 10.55 | 11.74 | 11.14 | 12.08 | 12.15 | 12.11 |
| Sem. (±) | 0.02 | 0.02 | 0.02 | 0.02 | 0.01 | 0.02 | 0.05 | 0.02 | 0.04 | 0.03 | 0.07 | 0.06 |
| CD at 1% | NS | NS | NS | 0.09 | 0.04 | 0.07 | 0.21 | 0.09 | 0.15 | 0.10 | 0.30 | 0.21 |
| B. Packaging materials | ||||||||||||
| P1: CFB box | 7.23 | 7.14 | 7.19 | 8.73 | 8.79 | 8.76 | 10.35 | 10.60 | 10.48 | 11.54 | 11.63 | 11.58 |
| P2: Plastic crates. | 7.24 | 7.13 | 7.19 | 9.39 | 9.59 | 9.49 | 10.50 | 11.05 | 10.78 | 11.96 | 12.14 | 12.05 |
| Sem. (±) | 0.01 | 0.01 | 0.01 | 0.01 | 0.01 | 0.01 | 0.02 | 0.01 | 0.02 | 0.01 | 0.04 | 0.03 |
| CD at 1% | NS | NS | NS | 0.04 | 0.02 | 0.03 | 0.10 | 0.04 | 0.07 | 0.05 | 0.14 | 0.10 |
| C. Interaction (A x B) | ||||||||||||
| C1 P1 | 7.23 | 7.14 | 7.18 | 9.78 | 8.10 | 8.94 | 12.50 | 12.00 | 12.25 | 13.00 | 12.78 | 12.89 |
| C1 P2 | 7.19 | 7.13 | 7.16 | 10.00 | 10.84 | 10.42 | 11.70 | 12.10 | 11.90 | 13.65 | 13.54 | 13.59 |
| C2 P1 | 7.21 | 7.14 | 7.18 | 9.03 | 8.50 | 8.77 | 10.00 | 9.40 | 9.70 | 11.05 | 11.34 | 11.20 |
| C2 P2 | 7.26 | 7.16 | 7.21 | 9.02 | 9.17 | 9.10 | 10.35 | 10.69 | 10.52 | 11.38 | 11.72 | 11.55 |
| C3 P1 | 7.21 | 7.14 | 7.17 | 7.80 | 8.18 | 7.99 | 10.00 | 10.00 | 10.00 | 11.00 | 11.39 | 11.20 |
| C3 P2 | 7.23 | 7.16 | 7.20 | 9.07 | 9.10 | 9.09 | 10.09 | 10.54 | 10.32 | 11.25 | 11.81 | 11.53 |
| C4 P1 | 7.25 | 7.18 | 7.21 | 8.08 | 8.18 | 8.13 | 9.93 | 10.04 | 9.98 | 11.11 | 11.06 | 11.09 |
| C4 P2 | 7.25 | 7.16 | 7.20 | 9.05 | 9.20 | 9.13 | 10.05 | 10.68 | 10.37 | 11.14 | 11.49 | 11.31 |
| C5 P1 | 7.23 | 7.09 | 7.16 | 8.11 | 8.59 | 8.35 | 9.80 | 10.00 | 9.90 | 11.23 | 11.25 | 11.24 |
| C5 P2 | 7.26 | 7.11 | 7.18 | 9.10 | 9.28 | 9.19 | 10.35 | 10.67 | 10.51 | 11.90 | 11.90 | 11.90 |
| C6 P1 | 7.24 | 7.13 | 7.18 | 9.66 | 9.80 | 9.73 | 11.18 | 11.50 | 11.34 | 12.66 | 12.64 | 12.65 |
| C6 P2 | 7.28 | 7.13 | 7.20 | 10.80 | 10.06 | 10.43 | 10.95 | 12.00 | 11.48 | 13.10 | 13.00 | 13.05 |
| C7 P1 | 7.24 | 7.18 | 7.21 | 8.00 | 8.50 | 8.25 | 9.25 | 10.31 | 9.78 | 10.81 | 11.00 | 10.91 |
| C7 P2 | 7.23 | 7.11 | 7.17 | 8.80 | 9.07 | 8.94 | 9.90 | 10.00 | 9.95 | 11.02 | 11.33 | 11.18 |
| C8 P1 | 7.24 | 7.20 | 7.22 | 9.10 | 9.22 | 9.16 | 10.40 | 10.52 | 10.46 | 11.09 | 11.41 | 11.25 |
| C8 P2 | 7.24 | 7.13 | 7.18 | 9.06 | 9.02 | 9.04 | 10.14 | 10.90 | 10.52 | 12.00 | 12.00 | 12.00 |
| C9 P1 | 7.26 | 7.11 | 7.18 | 9.04 | 10.00 | 9.52 | 10.10 | 11.63 | 10.87 | 11.90 | 11.80 | 11.85 |
| C9 P2 | 7.26 | 7.10 | 7.18 | 9.62 | 10.55 | 10.08 | 11.00 | 11.85 | 11.42 | 12.25 | 12.49 | 12.37 |
| Sem. (±) | 0.03 | 0.03 | 0.03 | 0.03 | 0.02 | 0.03 | 0.07 | 0.03 | 0.06 | 0.04 | 0.11 | 0.08 |
| CD at 1% | NS | NS | NS | 0.13 | 0.06 | 0.10 | 0.29 | 0.13 | 0.21 | 0.15 | NS | 0.30 |
Table text extracted from the original PDF; superscript letters are shown inline. The original table image is below.
View original table image
References
14 in the original paper- Adetunji CO, Fadiji AE, Aboyeji OO. Effect of chitosan coating combined Aloe vera gel on cucumber Cucumis sativa L. post-harvest quality during ambient storage. Journal of Emerging Trends in Engineering and Applied Sciences. 2014;5(6):391-397.
- Durango AM. Microbiological evaluation of an edible antimicrobial coating on minimally processed carrots. Food Control. 2006;17(5):336-341.
- Graham NB. Controlled drug delivery systems. Chemistry in Industry. 1990;15:482-486.
- Kittur FS, Saroja N, Tharanathan R. Polysaccharidebased composite coating formulations for shelf-life extension of fresh banana and mango. European Food Research and Technology. 2001;213(4-5):306-311.
- Lane JH, Eynon L. Determination of reducing sugars by Fehling's solution with methylene blue as indicator. Journal of the Society of Chemical Industry. 1923;42:32-37.
- Arebu Hussen. Impact of temperature and relative humidity in quality and shelf life of mango fruit. Int. J Hortic Food Sci. 2021;3(1):46-50.
- Prasad K, Sharma RR. Screening of mango genotypes for the incidence of lenticels browning, a new postharvest problem. Indian Journal of Agricultural Sciences. 2016;86(9):1169-1171.
- Sanchez GL. Effect of hydroxypropyl methylcellulose and chitosan coatings with and without bergamot essential oil on quality and safety of cold-stored grapes. Postharvest Biology and Technology. 2016 Apr 1;60(1):57-63.
- Sharafat G, Muhammad I, Shah SH. Studies on the effect of storage on the quality of sweet oranges. Sarhad Journal of Agriculture. 1990;6(5):433-436.
- Sharma A, Gautam S. An overview on medicinal properties of Aloe vera: Antibacterial and antifungal aspects. International Journal of Pharmacy and Biological Sciences. 2013;4:694-705.
- Singh J, Janes J, Tan SC. Effect of different surfactants on calcium uptake and its effects on fruit ripening, quality and post-harvest storage of Mango under modified atmosphere packaging. Acta Horticulture. 2000;509:413-417.
- Somayeh R, Hamed HK, Mahsa R. Effectiveness of alginate coating on antioxidant enzymes and biochemical changes during storage of mango fruit. Journal of Food Biochemistry 2019 Nov;43(11):e12990.
- Wong FL, Wan Zaliha WS, Yusnita H. Quality of chok anan mango as affected by tapioca-sago starch coating solutions stored at room temperature. Journal of Microbiology, Biotechnology and Food Sciences. 2016;6(1):737-742.
- Yonemoto Y, Higuchi H, Kitano. Effects of storage temperature and wax coating on ethylene production, respiration and shelf-life in Cherimoya fruit. Journal of the Japanese Society for Horticultural Science. 2002;71(5):643-650.