
Research article · 2019 · Full text
International Journal of Biology SciencesValue chain analysis of fish production from Langano Lake in Oromia Regional, Ethiopia
Volume 1(1) · Pages 34–44 · DOI: 10.33545/26649926.2019.v1.i1a.40 ↗
Research areasAquatic Ecosystems and Biodiversity
Abstract
Author-writtenAt the household level, capture fishery plays a critical economic, nutritional, healthy and social role in the lives of smallholder farm households. This study was undertaken in West Arsi zone (Nagele Arsi district), East Shoa Zone (A.T.J. K), with the title of Fish Value chain analysis in Langano lake. Both primary and secondary data were collected for this study. The data were collected by means of a semi-structured questionnaire from 150 respondents (130 fishermen around the lake, 2 fishing equipment supplier, 2 primary processors, 5 fish marketers, 6 fish consumers, 3 fish restaurants and 2 hotels). Multi-stage sampling technique was followed to select households for the study purpose. During the first stage two districts (Nagele Arsi from West Arsi zone and A.T.J.K from East Shoa Zone) where fishery production were taken place were identified purposively and at the next stage about 150 fishermen and marketing actors were selected randomly. Key informant interviews and focus group discussion were undertaken during the period of 2020 and 2021. The main functions in the fish value chain in the central rift valley area includes: input supply, production, processing, marketing and consumption of fish and fish products. The main value chain actors identified by the study were input suppliers, fish harvesters, fish processors, fish marketers and individual consumers in the study area. Total gross marketing margin in fish marketing is highest in channels VIII; it accounts a TGMM of 75.2%. Fishery cooperatives enjoy the highest net marketing margin that is 37 birr in channel VI. Producers share from the price paid by consumers is highest in channel III, which accounts 67.5% & followed by channel II which accounts 66% of the price paid by consumers. The lowest net marketing margin, which accounts 11Birr, is associated with fish processor in channel VIII of fish marketing channel in the study area. To point out the possible investment and research entry points so as improve the position of smallholder. Fish producers, Fishery cooperatives and other stakeholders should strongly work on value adding activities instead of selling whole fish. The policy implication is that the fishermen should be educated through extension service, providing modern input and technologies, strengthening of market extension and linking them with financial service to improve the fishery value addition development. Government intervention should be needed to control illegal production and marketing of fish.
Summary
Source-checkedPlain-language reading of the full paper, prepared with AI and checked against the text. Each point links to the authors' own words.
Why it matters
- Capture fisheries are vital for the economic, nutritional, and social well-being of smallholder farm households. View evidence ↗
- There is a lack of available information and government attention regarding the value chain analysis of fish production and marketing systems. View evidence ↗
The question
- The study aimed to identify fish value chain actors and their roles, analyze market performance, and assess the major challenges facing the fisheries sector in the study areas. View evidence ↗
What they did
- A multi-stage sampling technique was used, purposively selecting the Nagele Arsi and A.T.J.K districts, followed by random selection of 150 participants. View evidence ↗
- The researchers used STATA version 14 to perform descriptive analysis and econometric modeling on the collected data. View evidence ↗
What they found
- A majority of respondents (66.67%) lacked access to modern transportation services for their fishing activities. View evidence ↗
- Fishing equipment availability was low, with 78.67% of the 150 respondents reporting it was not available. View evidence ↗
- The highest total gross marketing margin (TGMM) was found in marketing channel VIII, reaching 75.2%. View evidence ↗
- Producers received the highest share of the consumer price in channel III (67.5%) and channel II (66%). View evidence ↗
- Fishery cooperatives achieved the highest net marketing margin of 37 birr in channel VI. View evidence ↗
- The primary challenge identified was the expansion of illegal fishing and traders, leading to overexploitation of fish stocks (reported by 22.91% of respondents). View evidence ↗
What it means
- The authors recommend that fish producers and cooperatives focus on value-adding activities rather than selling only whole fish. View evidence ↗
- Policy recommendations include improving fisherman education via extension services, providing modern technology, and increasing access to financial services. View evidence ↗
- The authors state that future research is needed to identify limitations in market-based production and further processing to encourage a commercial fishing system. View evidence ↗
Visual summary
3 visualsIllustrations explain the paper; charts are replotted from the paper's own table values.
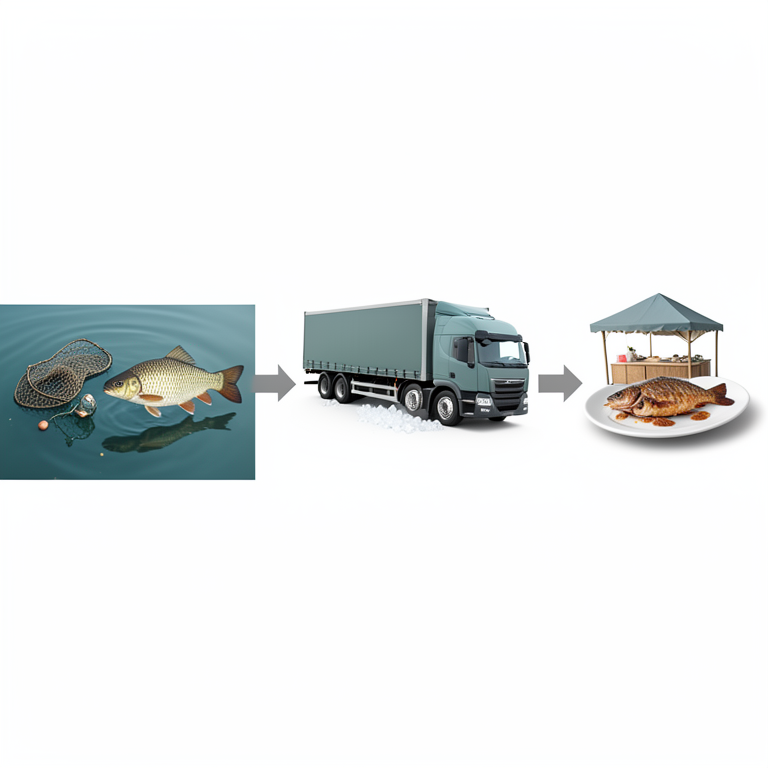
Fish Value Chain Flow
AI-generated conceptual illustration (Tilapia fish from Lake Langano, Ethiopia). It explains the idea and does not show study data.
View source evidence ↗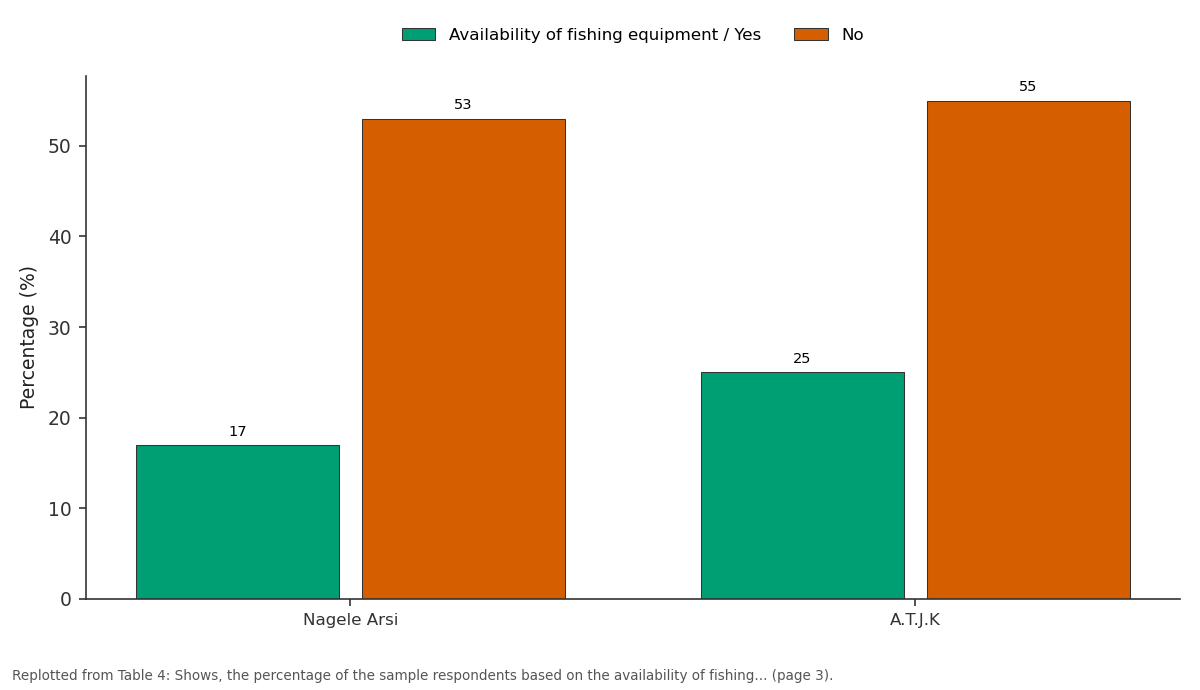
Availability of fishing equipment / Yes and No: Nagele Arsi vs A.T.J.K
Replotted from Table 4 (page 3) of the original paper. Every bar is the paper's own table value.
View source evidence ↗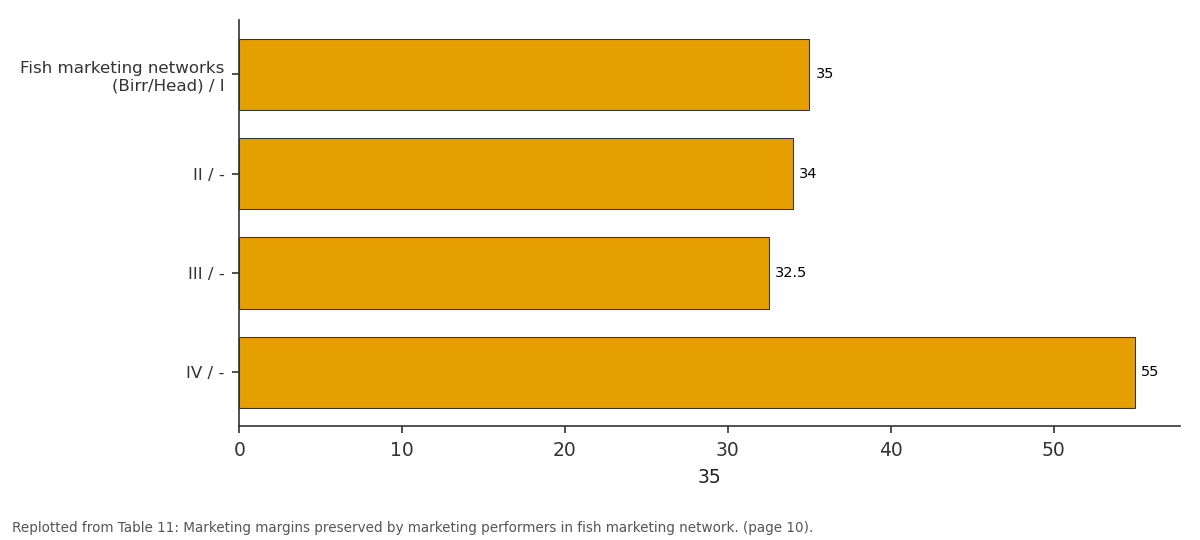
35: Fish marketing networks... vs II / - vs III / - vs IV / -
Replotted from Table 11 (page 10) of the original paper. Every bar is the paper's own table value.
View source evidence ↗Figures & tables
From the original paper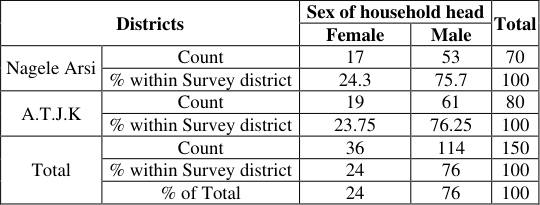 Table 1
 Table 2
 Table 3
 Table 4
 Table 5
 Table 6
 Table 7
 Table 8
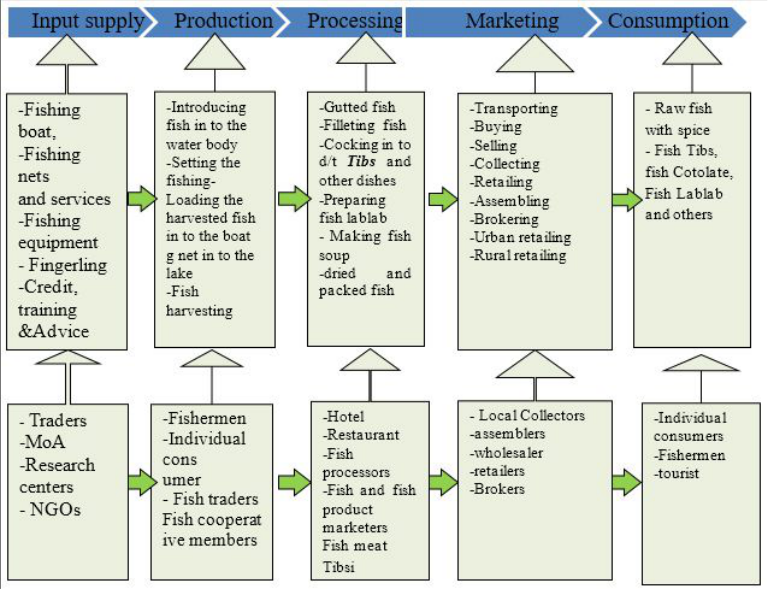 Figure 1
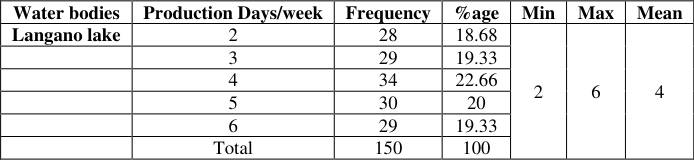 Table 9
 Table 10
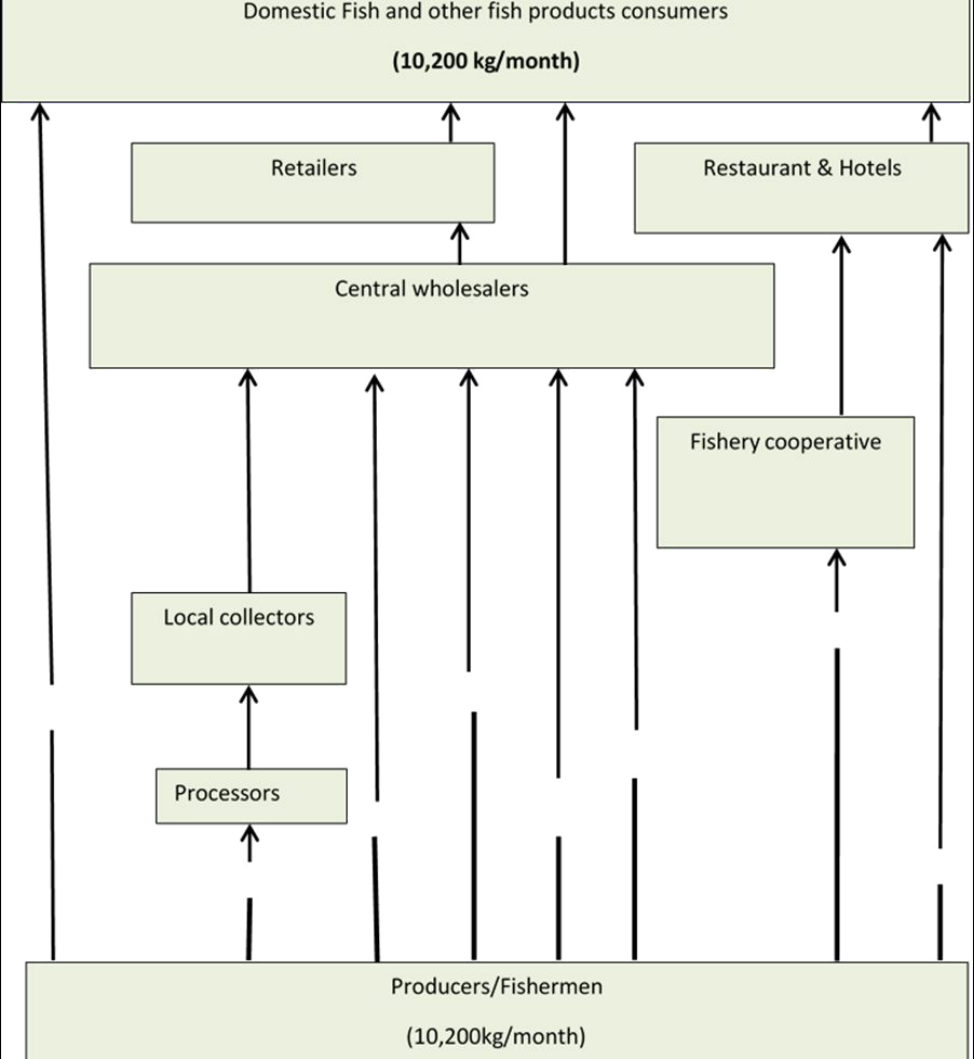 Figure 2
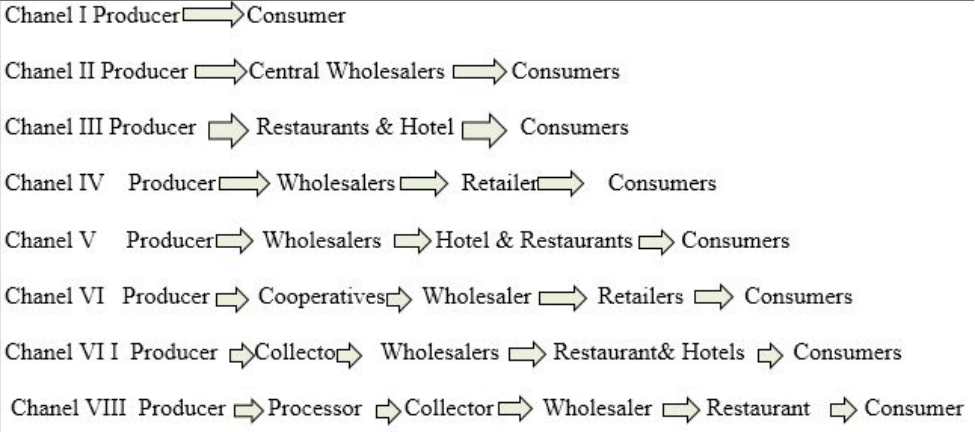 Figure 3
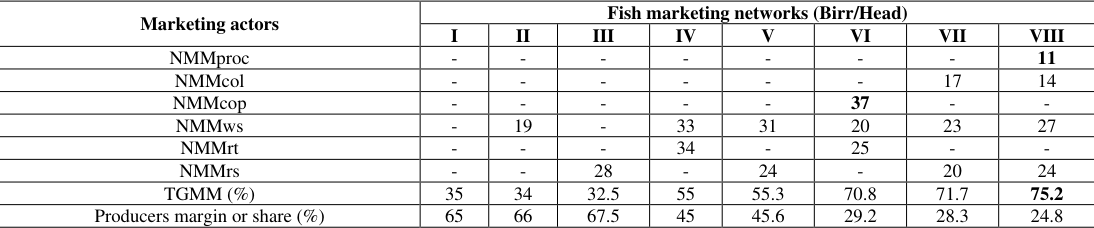 Table 11
 Table 12
Introduction
Ethiopian fresh marine systems can be classified into seven drainage basins. These are Abay, Awash, Baro Akobo, Omo-Gibe, Rift valley Lakes, Tekeze and Wabishebele-Genale basins (Tola et al, 2017). The Oromia regional state has plenty natural properties; water bodies constitute persistent and intermittent rivers, lakes, reservoirs and ponds with diversified fish species and potential for fish production. It appears that the potential for the development of river in fishery is vast (Alemu, 2014) [1] . Fishery sector's contribution to the local economy is tremendous. Despite significant contributions that fisheries make to employment, nutrition, and trade in the developing world, it is rarely included in national development policy and donor priorities. This is largely due to problems with valuation of small-scale fisheries, as policy makers often do not have access to data which reflect the importance of fisheries to development. The availability of information on value chain analysis of fish production and marketing system is scanty. The government has hardly paid any attention to it. Therefore, conducting value chain analysis of fish will be necessary in developing value chain of fish and prioritizing fisheries constraints in Oromia region. In Ethiopia the major problems that were identified by the stakeholders (the producers, consumers and hotel owners) involved in the fishing activities face problems such as lack of proper fishing gears; most of them use hook for fishing, Poor post-harvest handling and lack of proper fish processing and storage facilities, low price of fish as a result of low bargaining power of producers, lack of awareness, lack of transportation facilities, Poor culture of eating fish in the community, lack of enough boat in the area, lack of permanent fish market places or shops (Assefa, 2014, EFASA, 2011) [2] . Ethiopian lakes, on which the inland fishing is mainly experienced, are endangered by catchment's deforestation, beach damage, water pollution, siltation and eutrophication and over fishing.
Objectives of the study I.
To identify major fish value chain actors and their roles in fish value chain II. To analysis market performance of fish along the chain actors. III. To assess the major challenges of fisheries sectors in the study areas.
Research Methodology 2.1 Description of the Study Area
The study was conducted in selected districts of West Arsi zone (Nagele Arsi district) and East Shoa Zone (A.T.J K). Of Oromia region, Ethiopia. The study was conducted in Lake Langano of Oromia regional state and adjacent town including Arsi Nagele, Batu, and Addis Ababa.
Langano Lake
Langano is a lake in the Oromia Region of Ethiopia, exactly 200 kilometers by road south of the capital city, Addis Ababa, on the border between the East Shoa zone and West Arsi Zones. It is located to the east of Lake Abijatta in the Main Ethiopian Rift at an elevation of 1,585 meters (Lake Langano is 18 kilometers long and 16 km wide, with a surface area of 230 km 2 and a maximum depth of 46 meters (CSA, 2005). The lake has a catchment 1600 square kilometers in size, and is drained by the Hora Kallo river, which drains into the adjacent Lake Abijatta (Robert et al, 1992). Lake Langano is popular with tourists and city-inhabitants. The lake is brown in color and at first sight one may think that the lake is not clean. However this is not the case, the reason for the color is due to the richness of minerals including high sulphur levels which have led many to believe that the lake water has healing properties. There are a number of resorts around the lake and water sports are popular. There are variety of wildlife around the lake, which includes hip pos (rare), monkeys, baboons, warthogs, and a huge variety of birds. The area around the lake is largely deforested, however, and a large number of herders live around the area (Samuel, 2002). Two earthquakes had their epic enter near this lake, the first in 1906 (a magnitude 6.8 on the Richter scale), and the second in 1985 (magnitude 6.2). After the earthquake of 1906 there formed a 25-30 m tall geyser on Edo Laki Island on the northern part of the lake. The geyser disappeared circa 1966-1970, leaving a hot spring.
Sample size and sampling technique
Multi-stage sampling techniques were employed for this study. At the first stage representative districts like Arsi Nagele and, A/T/J/K were selected purposively based on potentiality of fish production and marketing. In consultation with respective agriculture and rural development offices, potential PAs having a fish production and marketing were listed. In the second stage, the 3 small administrative unit were selected randomly from listed kebeles based on the potentiality of casting activities and presence of distinct fishermen and potential fish supportive from selected water body. At the third stage a total of 130 fish producers were selected using proportional simple random sampling methods from a total producer of the selected districts and 20 other market actors like fish processors, restaurants, hotels consumers, fish equipment sellers and other market actors. In addition to this, Key informants interview and 5 focus group discussions were held which contain 7-12 farmers were selected and involved in this study.The sample size determination was resolved by means of Yamane (1967) sampling formula with 95% confidence level.
Where n is sample size, N is the total number of fish producers in the selected districts (N=240) and e is the desired level of precision which is 0.05.
Types of data and Method of Data Collection
In this study, both qualitative and measurable data types were collected from primary and secondary sources. Secondary data collected from zonal and district office published and unpublished material. Primary data was collected from the fishermen, fish processors, fish cooperatives, fish eaters and fish and fish product marketers (brokers, wholesalers and local collectors). The formal survey was done using semi-structured questionnaire and checklist prepared for each group (i.e. fish producers, fishery cooperatives, local collector, individual consumers, wholesalers, retailers, and cafeterias/hotels). The group included all individuals joining in the value chain of fish in the study area. The informal surveys were done using Rapid Market Appraisal (RMA) technique using checklists. Field observations also conducted to supplement primary data collected through individual interviews and group discussion in the study area.
Methods of data analysis
Based on the objectives of this study, both descriptive analysis and econometric models were employed to analyse data and come up with the results. Statistical tools such as STATA version 14 were used for analysis and provide output for the descriptive as well as for econometric models. Descriptive analyses were used to analysis characteristics of sample respondents. Costs and margins along the value chains were analyzed.
Market margin analysis:
A marketing margin measures the share of the final selling price that is captured by a particular agent in the marketing chain Value chain: It describes the full range of activities which are required to bring a Product or service from conception, through the different phases of production (involving a combination of physical transformation and the input of various producer services), delivery to final consumers, and final disposal after use (Kaplinsky and Morris, 2001).
Value chain actors: are those involved in producing, processing, trading or consuming a particular agricultural product. The value chain actors are the main market actors related to specific product(s) exporters/importers, traders/retailers and end consumers (Feyera, 2013) [4] .
Management and conservation of commercial fish species harvested from Langano Lake: It is recommended that appropriate fishing activities and fishing equipment have been established and followed for the commercial fish species harvesting like Nile tilapia, African catfish and Common carp in the selected water bodies. This species should not harvest in the lengths less than 25cm and the fish size at the first maturity is an important parameter and it is considered in this study.
Results and Discussion
Results and Discussion
Demographic and Socio-economic Characteristics of the sample households:
In this section descriptive analysis were used to describe characteristics of the sample households in the study area. Both continuous and discrete variables were used in order to describe the sample households included in this study. Sex of household head: Out of 140 sample respondent, 24% were female household head where as 76% of them were male headed household. In Nagele Arsi District, 24.3 % were female and 75.7% were male headed household. In A.T.J.K district out of 80 respondents 23.75% were female while 76.25% were found to be male headed household in the study area. Household head`s access to the modern transportation services: Out of 150 sample respondent, 33.33% of them have got access to modern transportation services on fishing activities where as 66.67% of them had not obtain access to modern transportation services on fishing activities in the study area. In Nagele Arsi District out of 70 sampled respondents, 30 % of the respondents have got access to modern transportation services on fishing activities and 70% of them have not obtain access to transportation services on the fishing activities in the area. In A.T.J. K district out of 80 respondents 36.25% of the respondents have got access to the modern transportation services on fishing activities and 63.75% of them have not obtain access to it on the fishing activities in the area. Household head`s access to the nearest market: In the study area out of 150 sample respondent, 54% of them have an access to the market to sell their fish and other fish products where as 46% of them had not access to market to sell their fish products in the study area. In Nagele Arsi District out of 70 sampled respondents, 51.42 % of the respondents have got access to the market to sell their fish and other fish products and 48.58% of them have not obtain access to market to sell their fish and other fish products in the study area. In A.T.J. K district out of 80 respondents 56.25% of the respondents have got access to market to sell their fish and other fish products and 43.75% of them had not obtain market access to sell their fish and other fish products in the study area. Availability of fishing equipment in the district: Out of 150 sample respondent, 21.33% of them have said yes whereas 78.67% of them have said No response about the availability of the fishing equipment in the study area. In Nagele Arsi District out of 70 sampled respondents, 24.3 % of the respondents had given yes response whereas 75.7 have given No response on the availability of fishing equipment in the district. In A.T.J. K district out of 80 respondents 31.25% of the respondents had given yes response whereas 68.75% have given No response on the availability of fishing equipment in the district. Household head`s access to the credit services: In the study area out of 150 sample respondent, 41.33% of them have an access to the credit services for enhancing their fishing activities where as 58.67% of them had not access to the credit services for enhancing their fishing activities in the study area. In Nagele Arsi District out of 70 sampled respondents, 41.43 % of the respondents have got access to the credit services for enhancing their fishing activities where as 58.57% of them have not obtain access to credit services for enhancing their fishing activities in the district. In A.T.J.K district out of 80 respondents, 41.25% of the respondents have got access to the credit services whereas 58.75% of them had not obtained credit for enhancing their fishing activities in the district. Household head`s membership in the primary fishery cooperative (Yes/No Answer): In the study area, Out of 150 sample respondent, 48.66% of them have said yes whereas 41.34% of them have given No response whether they were a member of primary fishery cooperatives or not in the study area as a whole. In Nagele Arsi district out of 70 sampled respondents, 45.71% of them have said yes whereas 54.29% of them have given No response whether they were a member of primary fishery cooperatives or not in this district. In A.T.J.K district out of 40 respondents, 51.25% of them have said yes whereas 48.75% of them have given No response whether they were a member of primary fishery cooperatives or not in this district. Household size: The average family size of the sample respondents was found to be 7 person in the study area. The average male member in the sampled household was around 4 person. Both In Arsi Nagele and A.T.J.K District it was 4 person, in A.T, J.K district the average male member in the sample household was also around 4 person. The significance value of the t-test shows acceptance of hypothesis that the average number of male in household is equal across the districts. So the average number of male in household is not significantly different across the study districts (Table 7).
| Variables | Arsi Nagele | A.T.J.K | Overall | p-value |
|---|---|---|---|---|
| (N=70) | (N=80) | (N=150) | ||
| Mean (SD) | mean (SD) | Mean (SD) | ||
| Female in household | 3.1(1.6) | 3.3(1.8) | 3.2(1.5) | 0.912 |
| Male in household | 4.4 (1.4) | 3.6(1.5) | 4(1.3) | 0.047 |
| Total household size | 7.5 (2.4) | 6.9(2.7) | 7.2(2.3) | 0.357 |
| Female B/n 15-64 years | 1.6(1.1) | 1.4( 1.8) | 1.5(1.6) | 0.743 |
| Male B/n 15-64 years | 1.8(1.3) | 1.3(1.7) | 1.55(1.7) | 0.537 |
| household size B/n 15-64 | 3.4(1.7) | 2.7(1.9) | 3.05(1.8) | 0.235 |
Table text extracted from the original PDF; superscript letters are shown inline. The original table image is below.
View original table image
Education of household head: Education equips individuals
with the necessary knowledge of how to make living decision. Literate individuals are very ambitious to get information and use it. As agriculture is a dynamic occupation the conservation practices and agricultural production technologies are always coming up with better knowledge. The average year of formal schooling of total sample respondent is grade 3.The average year of formal schooling is grade 3 and grade 4 in Nagele Arsi and A.T.JK districts respectively. The mean difference of the groups is statistically significant at 1 % of probability level. It shows that, on average sample respondents has significance mean difference across all districts at 1 % of probability level.
Fishing Experience of Household head:
In the study area, the average fishing experience of the respondents were found to be 9 years, while that of Arsi Nagele and A.T.J. K district were 8 and 9 years respectively. It showed that the average difference between the all groups is significant at 1% significance level. This showed that the average fishing experience of the respondents in all districts is not equal (see table 8).
| Variables | Nagele | A.T.J.K | Overall | p-value |
|---|---|---|---|---|
| (N=70) | (N=80) | (N= 150) | ||
| Mean (SD) | Mean (SD) | Mean (SD) | ||
| Household head education level | 3.0(2.3) | 3.8(3.1) | 3.4(1.9) | 0.003 |
| Household head Fishing experience | 8.0 (6.3) | 9.2(7.8) | 8.6(7.4) | 0.000 |
| Household head`s Farm size | 0.6(0.4) | 0.5(0.8) | 0.55(1.0) | 0.001 |
| Fish caught by kg per day | 45(21.1) | 68(24.8) | 56.5 (29.6) | 0.751 |
Table text extracted from the original PDF; superscript letters are shown inline. The original table image is below.
View original table image
Frequency of extension contact per year:
The result of the study indicated that the average frequency of extension contact per year for the total sample on the fishing activity was 4 times. The average frequency of extension contact per year on the fishing activities is 4 and 3 time in Arsi Nagele, and A.T.J. K districts respectively. The mean difference of the groups is statistically significant at 5% of probability level. It shows that, on average sample respondents has significance mean difference across all districts at 5 percent of probability level.
Farm Size: On average total sample respondents have 0.5 ha of farm size for farm production in the study area. The average farm size of respondents is 0.6 ha and 0.5ha in Arsi Nagele and A.T.J.K districts respectively. The mean difference between all groups was found to be significant at 1% probability level. This shows that the average land holding of sample households across both districts is not equal.
Price of fish per kg in 2019 G.C by ETB:
The average fish price per kg in 2019/20 production year for the total sample respondents was 26 ETB in the study area. In Arsi Nagele District it was 21 ETB and in A.T.J.K it was district 30.5 ETB. The significance value of the t-test shows rejection of hypothesis that the average fish price per kg is equal across the districts. So the average fish price per kg of household head is significantly different across the study districts at 5 percent of significant level (Table 8).
Income from fish per month in 2019 G.C (ETB):
The average monthly income of the total sampled respondents in 2019/20 production year was 2604.1ETB in the study area. In Arsi Nagele District it was 2500 ETB, in A.T.J.K district it was 2708 ETB respectively. The mean difference between all groups was found to be significant at 5% probability level. This shows that the average monthly income from fish of sample households across all districts is not equal.
Fish Value chain analysis
The selection of potential value chain could be considered from market potential, economic and social value and enabling environment. The market potential is proving the competitiveness of the intervening business from the perspectives of growth potential into industry, existences of unmet demand, potential for value adding, involvement of number of peoples, comparative advantage, and presence of leading firms and sustainability of the market. Similarly, the economic and social perspective represents the target of an intervention into a designed business. The target indicates whether the interventions are to the priority challenges of a society to enhance their livelihood. From the target perspective, potential for employment generation, potential for income generation, potential for poverty reduction, potential to scale up, potential for outreach (cover larger area) and low risk from the major. The enabling environment is the existing favourable condition that supports the implementation of the interventions. These includes government/and donor involvement, favourable business environment, institutional mandates, environmental suitability, government strategies and social acceptances (Valuable) form the major. Fish value chains include all inputs and services that enable fish production through harvesting from water bodies, processing and marketing of outputs, to the creation of added value products through consumption of fish and fish products. Value chains also include the institutional and governance arrangements that enable these systems to function. The study on fish value chains has identified the core functions, actors, market channels, constraints and existing opportunities.
Main Functions and actors in the Value chain of fishing activities in the study area
The main functions in the fish value chain in the central rift valley area includes: input supply, production, processing, marketing and consumption of fish and fish products, thus different activities were performed by the different actors. The fish value chain passes through 5 key functions to reach the final consumer in general. However, these key functions are not mandatorily undertaken at a point of time and node but at different time. Moreover, the whole fish and fish products supplied to the final consumers is not mandatory passes through these functions.
Actors and their role in fish value chain
There are several actors in fish value chains in the study area who engaged in various activities from fishing up to consuming. These actors have defined roles specific to the activities they perform and/or services they provide within the chains. According to KIT et al. (2006), the direct actors are those involved in commercial activities in the chain (producers, traders, processors and consumers) and indirect actors are those that provide financial or non-financial support services such as input suppliers, credit agencies, business service providers, government, NGOs, researchers and extension agents. In the case of this study area fisheries sector, an attempt had been made to analyze the current fish production and marketing channels and key actors involved in these chains and other relevant issues. Based on their roles and responsibilities the actors participating in this chain are discussed as follows.
Primary actors: The primary actors in fish value chain in this study area were input supplier, individual fish producers', fish producer cooperatives, fish processor, fish and fish product marketers and consumers. Each of these actors adds value in the process of changing product title. Some functions or roles are performed by more than one actor and some actors perform more than one role.
Fishery Input supplier: At this stage of the value chain, there are many actors who are involved directly or indirectly in fish input supply in the study area. Currently, individual fishing equipment trader at different town, district and zonal Office of Livestock and fishery development agency, Batu fish and other aquatic life research center, Sebeta fish research center, government and NGO's such as world vision Ethiopia and fish for all are the main fish input supplier. The World Vision Ethiopia and Batu fish and other aquatic life research center is also supporting the fishermen on the lake and reservoir in giving the training and funding for provision of training and fishing equipment purchasing. All these actors are responsible to supply fish seeds and fishing equipment which are essential inputs at the production stage. There are also fishing input supplier from Batu town and Addis Ababa city.
Fish producers/Fishermen: Fishermen are people who earn their living by exploiting fish resources. Individual fish producers are the first link and major actors who perform the work of fish production and supply to the market in this study area's fish value chain. Their major functions in this value chain are mainly processing of fish at preliminary stage such as: putting the fishing net in to the lake, loading the caught fish on the fishing boat, fish harvesting, washing, cleaning, gutting, filleting and transport to their next customer. Their mode of transportation is using head load, hand load "Bajaj, lorry, car and motor cycle.
Fish production overview:
In the study area there are four commercial fish species such as: Nile Tillapia, Common carp, and African Cat fish. The most productive and preferred species of fish in the study area is Nile tilapia fish species because of its availability and more sweet and can be easily filleted and gutted than the other species in the study area. The fishing equipment that the producers used were: gillnets, beachsiene, long line, hook line, locally made boat (Yabaloo) which is made of local materials, filleting and gutting blades were the main fish production equipment in the study area. The majority of the sample producers used the fishing equipment which was previously offered by support provider (supporting agents such as NGO, Farm Africa and Batu fish and other aquatic life research center). The equipment's are timber made boat and fishing net. From Langano Lake, as the survey result indicated us the fishermen are responsible to supply 8,580 kg of fish to the Arsi Nagele, Batu and Addis Ababa market in 2019/2020 production year monthly.
Fishing Frequency
In the Langano Lake from the total of target respondents the average fishing day's frequencies per week of individual fish producer were 4 days per week with the minimum and maximum of (table 9). Fish Production, selling and Consumption overview: Fish production in the study area takes place all year round. However, the peak period for fish harvesting is between January and June. Based on the survey result the daily average fish production of an individual fish producer from this lake was 5.92kg/person and the average monthly volume of production was10, 200kg (8580 kg of whole fish and 1620 kg of filleted). Accordingly, from the total volume of fish produced monthly in the study area 19.5% were used by fishermen for home consumption, 5.5% were lost in different ways and the remaining 75% was supplied to the market through different market channels. Fish processors: Individual fish processors are the second link and major actors who perform the work of harvested fish washing, cleaning, gutting, filleting and packing after harvesting. They can perform washing, sorting and plastic packing.
| Water bodies | Production Days/week | Frequency | %age | Min | Max | Mean |
|---|---|---|---|---|---|---|
| Langano lake | 2 | 28 | 18.68 | 2 | 6 | 4 |
| 3 | 29 | 19.33 | ||||
| 4 | 34 | 22.66 | ||||
| 5 | 30 | 20 | ||||
| 6 | 29 | 19.33 | ||||
| Total | 150 | 100 |
Table text extracted from the original PDF; superscript letters are shown inline. The original table image is below.
View original table image
Individual Fish and fish product consumers: Consumers are those who purchase the fish and other fish products from different sources of fish supplier for individual and home consumption purpose. They consume fish as a substitute protein food. Especially at Christian fasting season the preference of consumer to fish is highly increases. They prefer fresh, dried and filleted fish for consumption. They particularly buy from the fishermen, fishery cooperatives. Those who live near the lake and reservoir and passengers who travel from Hawasa to Addis Ababa also buy from the fishermen themselves at different landing site.
Fish marketers: This actor consists Local collectors, wholesale rs and retailers landing site, wholesalers, fish shops, retailers, restaurants and hotels at the markets often in small quantities.
Local Fish Collectors: These are traders in assembly markets who collect fish from individual fisher at their production/landing site area and fishery cooperative for the purpose of reselling. As indicated from this study, they use their financial resources and their local knowledge to handle and transport their fish to their customer area. They play an important role in fish value chain in linking producer with traders and responsible for trading of fish and fish products from production area to wholesaler, retailers and consumer markets in the study areas. The other function of these actors is doing for time and place utility. Their role is buying and assembling, transporting and selling to the next actors in this value chain.
Wholesalers:
In case of this study area most of fish whole sellers are averagely found 3 km far from the selected lake and reservoir in the selected districts and village and they are who buys whole fish, gutted, and filleted fish from the fishermen, local collector and fish producer cooperatives. They are the main assembly centers for fish in their respective surrounding areas and play an important role in linking fish producer with the other actors in the chain and doing for value addition as time and place utility. They were involved in collecting a large volume of fish from their supplier and supply to fish retailers, fish products traders. They also, supply fish to traders who came from Addis Ababa, and restaurants and hotels at Batu, Nagele Arsi. They can transport to where their customer is located. Their mode of transportation is mainly using Lorry, Bajaj, motor cycle and car to collect from their supplier and passenger car and minibus to transport to Batu, Arsi Nagele and Addis Ababa town. They have better storage facility, transport and communication access than other actors in the chain.
Retailers: They are key actors in this value chain who link between producers and consumers. Mostly they buy from wholesalers and sell to consumers. As indicated from this survey their role in this study area is that; they clean and stores, prepare packages, provides fish and their products directly to the final consumer and sometimes they supply to restaurant and hotels at Batu, Nagele Arsi and Addis Ababa town when there is shortage of fish supply. Consumers usually buy the product from retailers as they offer according to requirement and their purchasing power.
Fishery Cooperatives: Fishery cooperatives are one of the fish value chain actors in this study area and have a great role in this value chain. They are the second fish collector from fish producer. Their role in this fish value chain includes buying of fish from the individual producer at their store house and selling for their customer such as for wholesaler and direct consumer. Most of the fishery cooperatives have an opportunity to sell their fish to Hawasa to Addis Ababa voyagers at their shop since they are at the side of the main road.
Restaurants and hotels:
The restaurants and hotels are where the consumers consume value added fish. Once they buy fresh fish from wholesalers; they store in refrigeration, prepare by roasting and pickling (addition of spice and vegetable) and called "Asa batikilt","Asa Tibsi"Asa dulet, Asa soup, Asa lablab, raw fresh Asa by adding spice and liqour and "Asa Kotelete" to satisfy their customer. They are more responsible for time, place and form utility for their customer. In rare case when there was shortage of supply of fish from their regular customer (whole seller) they collect fish from retailers. Since they do more value addition on their fish and incur additional costs during processing and preparation they gain more profit margin.
Supporting actors: are those who provide supportive services for fish producers on the selected lake and reservoir including supplying fish seed, fishing net like beach Fish processing and post-harvest handling: Fish which is produced in the study area was supplied to the market either as gutted, whole fish or filleted fish. As the survey result indicated there were no further fish processing activity undertaken but mostly the fish producer accomplish only the preliminary fish processing activity such as: washing, filleting, gutting, cleaning and sorting and very few of them add some processing and preservation activity such as plastic packing and storage facility. Once the fish is caught they do only for preliminary processing (i.e. washing, gutting, cleaning) and taken directly to the market for selling without any further processing and value addition. The situation therefore impact on the next actors in the chain to find ways of preventing the fish from going bad because there was no preservation for their fish. Therefore; the cumulative result of this study shows they do only for preliminary fish processing.
Fish Market performance along the chain actors
Marketing performance of fish market was analysed by estimating the marketing margin, by taking into consideration associated marketing costs for key marketing channels. The total marketing margin is the difference between what the consumers pays and what the producer/fishermen receives for his fish, in other words it is the difference between retail price and farm price. A wide margin means usually high prices to consumers and low prices to producers (Mendoza, 1995). Performance of the market is reflection of the impact of structure and conduct on product price, costs and the volume and quality of output (Cramers and Jensen, 1982). Market performance can be evaluated by analysing costs and margins of marketing agents in different channels.
Marketing costs refers to those costs, which are incurred to perform various marketing activities in the shipment of goods from producers to consumers. Marketing cost includes: Handling cost (packing and unpacking, loading and unloading putting inshore and taken out again), transport cost, product loss (particularly for perishable fruits and vegetable), storage costs, processing cost and capital cost (interest on loan), market fees, commission and unofficial payments (Heltberg and Tarp, 2001).
Estimates of marketing margin are the best tools to analyses performance of market. The cost and price information used to construct marketing cost and margin have been gathered from fish value chain actors such as, producers, collectors, retailers, wholesalers and consumers (Mendoza, 1995).
Fish marketing channel in the study area
From the Figure 3 below, one can know that the main earphones of fish product from the producers were Central wholesalers (52.6%), Fishery cooperatives (21.3%), consumers (16.1%), Hotel and restaurants (7%) and fish processors (3%). Accordingly, the producer-fishery cooperatives-central wholesalers-retailers-consumer channel, (channel 6) carries the larger volume of fish products transacted followed by producercentral wholesalersretailers --consumer channel, (channel 4). The major identified channels of fish and fish products during the survey were explained as follows in Figure 3 below.
Fish gross marketing margin and value share
Promotion margin refers to the difference between prices at different levels in the selling system. The total marketing margin is the difference between what the consumer pays and what farmer receives for his/her products/services or it is the difference between retail price and farmstead price calculating the total gross marketing margin (TGMM) is permanently linked to the ultimate price paid by the end buyer and is stated as percentage (Mendoza, 1995). The above table, Table 11 reviews marketing boundaries preserved by each performer in various fish marketing networks. The whole gross marketing boundary in trawl transaction is peak in networks 8; it books a TGMM of 75.2%. Fishery collectives obtain the highest net marketing boundary that is 37 birr in network VI. Producers portion from the price paid by consumers is highest in channel III, which books 67.5% & followed by channel II which books 66% of the price paid by consumers. The lowest net marketing margin, which accounts 11Birr, is related with fish processor in channel VIII of fish marketing channel in the study area.
| Marketing actors | Fish marketing networks (Birr/Head) | — | — | — | — | — | — | — |
|---|---|---|---|---|---|---|---|---|
| I | II | III | IV | V | VI | VII | VIII | |
| NMMproc | - | - | - | - | - | - | - | 11 |
| NMMcol | - | - | - | - | - | - | 17 | 14 |
| NMMcop | - | - | - | - | - | 37 | - | - |
| NMMws | - | 19 | - | 33 | 31 | 20 | 23 | 27 |
| NMMrt | - | - | - | 34 | - | 25 | - | - |
| NMMrs | - | - | 28 | - | 24 | - | 20 | 24 |
| TGMM (%) | 35 | 34 | 32.5 | 55 | 55.3 | 70.8 | 71.7 | 75.2 |
| Producers margin or share (%) | 65 | 66 | 67.5 | 45 | 45.6 | 29.2 | 28.3 | 24.8 |
Table text extracted from the original PDF; superscript letters are shown inline. The original table image is below.
View original table image
Major Constraints in fish Value chain in the study area
Accordingly major constraints faced by fish production system, based on interview of respondents, FGD and KII, in the study areas were identified and are presented in the following table.
Conclusion and Recommendation
Analysis of fish value chain revealed that the main value chain actors are input providers, fishermen, fish producer organizations, local fish hoarders, venders, retailers, restaurants and hotels and finally consumers. Currently the district and zonal office of agriculture, Batu fishery research center, Bureau of agriculture, micro financial institution, and NGO's such as world vision Ethiopia are the main support provider. The value chain cliques deliver assistance tasks like responsiveness creation, enabling joint approach construction and action and the organization of provision. To promote fish value addition in a sustainable way some policy implications are suggested to be addressed by stakeholders: effort should be made to strengthen fishermen cooperative and encourage collective action of stakeholders to make the fishermen benefited, Supporting the fishermen in providing a continuous awareness creation and training through extension, facility for access of modern input and fishery technologies, encourage the producer to participate in competitive market and consolidation of market extension (connecting fishermen with competitive fish markets, construction advertising dimensions of fishermen, etc.) and; To promote the financial service providers and accordingly extension workers should give attention to encourage them. Hence, it improves their skill to further processing and value addition on their fish. Finally, the future research need to be conducted on production and value addition of fish to identify the existing limitation on market need based fish production, further processing and encouraging them for commercial fishing system by using of modern fishing equipment to make the fish producer more benefited.
Conflict of interest
We have not encountered any conflict of interest regarding this paper.
Acknowledgment
I would like to say, thank you very much to Oromia agricultural research institute for financing this research activity and all workers under Socio economics, Agricultural extension and Finance process and also the Center director for facilitating the fund for this activity. My special thank goes to all fishermen respondents and experts of livestock and fishery development offices of East Showa zone, West Arsi zone and districts and local development agents as well as fishery cooperative at each selected fish harvesting site for their quickening in the execution of the work. finally, I appreciate the fish harvesters, fishing input suppliers, all market actors and consumers for their teamwork and endurance during the investigation.
Figures and tables from the paper
| Districts | — | Sex of household head | — | Total |
|---|---|---|---|---|
| Female | Male | |||
| Nagele Arsi | Count | 17 | 53 | 70 |
| % within Survey district | 24.3 | 75.7 | 100 | |
| A.T.J.K | Count | 19 | 61 | 80 |
| % within Survey district | 23.75 | 76.25 | 100 | |
| Total | Count | 36 | 114 | 150 |
| % within Survey district | 24 | 76 | 100 | |
| % of Total | 24 | 76 | 100 |
Table text extracted from the original PDF; superscript letters are shown inline. The original table image is below.
View original table image
| Districts | — | Household head`s access to the modern transportation services | — | Total |
|---|---|---|---|---|
| Accessed | Not accessed | |||
| Nagele Arsi | Count | 21 | 49 | 70 |
| % within Survey district | 30 | 70 | 100 | |
| A.T.J.K | Count | 29 | 51 | 80 |
| % within Survey district | 36.25 | 63.75 | 100 | |
| Total | Count | 50 | 100 | 150 |
| % within Survey district | 33.33 | 66.67 | 100 | |
| % of Total | 33.33 | 66.67 | 100 |
Table text extracted from the original PDF; superscript letters are shown inline. The original table image is below.
View original table image
| Districts | — | Market access | — | Total |
|---|---|---|---|---|
| Accessed | Not accessed | |||
| Nagele Arsi | Count | 36 | 34 | 70 |
| % within Survey district | 51.42 | 48.58 | 100 | |
| A.T.J.K | Count | 45 | 35 | 80 |
| % within Survey district | 56.25 | 43.75 | 100 | |
| Total | Count | 81 | 69 | 150 |
| % within Survey district | 54 | 46 | 100 | |
| % of total | 54 | 46 | 100 |
Table text extracted from the original PDF; superscript letters are shown inline. The original table image is below.
View original table image
| Districts | — | Availability of fishing equipment | — | Total |
|---|---|---|---|---|
| Yes | No | |||
| Nagele Arsi | Count | 17 | 53 | 70 |
| % within Survey district | 24.3 | 75.7 | 100 | |
| A.T.J.K | Count | 25 | 55 | 80 |
| % within Survey district | 31.25 | 68.75 | 100 | |
| Total | Count | 32 | 118 | 150 |
| % within Survey district | 21.33 | 78.67 | 100 | |
| % of Total | 21.33 | 78.67 | 100 |
Table text extracted from the original PDF; superscript letters are shown inline. The original table image is below.
View original table image
| Districts | — | Access to credit services | — | Total |
|---|---|---|---|---|
| Access | No access | |||
| Nagele Arsi | Count | 29 | 41 | 70 |
| % within Survey district | 41.43 | 58.57 | 100 | |
| A.T.J.K | Count | 33 | 47 | 80 |
| % within Survey district | 41.25 | 58.75 | 100 | |
| Total | Count | 62 | 88 | 150 |
| % within Survey district | 41.33 | 58.67 | 100 | |
| % of Total | 41.33 | 58.67 | 100 |
Table text extracted from the original PDF; superscript letters are shown inline. The original table image is below.
View original table image
| Zone | Districts | — | Fishery cooperative membership of household head | — | Total |
|---|---|---|---|---|---|
| Yes | No | ||||
| West Arsi | Nagele Arsi | Count | 32 | 38 | 70 |
| % within Survey district | 45.71 | 54.29 | 100 | ||
| East Shoa | A.T.J.K | Count | 41 | 39 | 80 |
| % within Survey district | 51.25 | 48.75 | 100 | ||
| Total | Count | 73 | 77 | 150 | |
| % within Survey district | 48.66 | 41.34 | 100 | ||
| % of total | 48.66 | 41.34 | 100 |
Table text extracted from the original PDF; superscript letters are shown inline. The original table image is below.
View original table image
| Water body | Type of fish produced | Average monthly produced | Monthly consumption (%) | Average sale price per kg | — |
|---|---|---|---|---|---|
| Fasting season | Non fasting season | ||||
| Langano lake (n=150) | 8,580 +10, 200 | ||||
| Whole fish | 343.2kg | 35 ETB/kg | 28.5ETB/kg | ||
| Semi processed | 408kg | 100 ETB/k | 70.2ETB/kg | ||
| Total | 751.2kg | 34.5% |
Table text extracted from the original PDF; superscript letters are shown inline. The original table image is below.
View original table image
| Main challenges facing the fishery sector | Frequency | Percentage (%) | Rank |
|---|---|---|---|
| Expansion of illegal fishermen, traders and illegal fishing nets, which leads Overexploitation of fish stock | 55 | 22.91 | 1st |
| Lack of improved fishing technologies and training services on the fishing activities | 43 | 17.91 | 2nd |
| Fishery regulation problem | 39 | 16.25 | 3rd |
| Low price of fish and fish products and weak bargaining power | 35 | 14.59 | 4th |
| water hyacinth and waste disposal problem at Dambal Lake & Koka reservoir | 31 | 12.91 | 5th |
| agricultural expansion and wetland degradation | 20 | 8.33 | 6th |
| climate change, fish disease and low yield of fish species | 17 | 7.08 | 7th |
Table text extracted from the original PDF; superscript letters are shown inline. The original table image is below.
View original table image
References
3 in the original paper- Heltberg R, Tarp F. Agricultural Supply Response and Poverty in Mozambique. Paper presented at the conference on "Growth and Poverty, University of Copenhagen, Copenhagen. 25-26 May. Institute of Economics. From tomato thesis, 2001.
- KIT, FaidaMaLi, IIRR Chain empowerment: Supporting African farmers to develop markets. Royal Tropical Institute, Amsterdam; Faida Market Link, Arusha; and International Institute of Rural Reconstruction, Nairobi, 2006.
- Mendoza G. A Primer on Marketing Channels and Margins. Lyme Rimer Publishers Inc., USA, 1995, 425p.