
Research article · 2019 · Full text
International Journal of Biology SciencesMilk yield and quality of crossbred and indigenous boran cows fed on different levels of energy diets
Volume 1(1) · Pages 48–53 · DOI: 10.33545/26649926.2019.v1.i1a.42 ↗
Research areasAgriculture Sustainability and Environmental ImpactRuminant Nutrition and Digestive Physiology
Abstract
Author-writtenDifferent levels of energy feed supplemented and assessed for nutrient intake, milk yield, quality, and weight changes of cross-bred (Holstein Frisian× Boran) and indigenous Boran dairy cows. The experimental cows are with an average body weight of 439.55±10.41 kg and milk yield of 8.07±0.61 liter/ day; 250±1.71kg, and 2.21±0.42 liter/ day for cross-bred and Boran respectively. Treatment diets are T1=1*metabolizable energy (ME), T2=1.25*ME, T3=1.5*ME, and T4=1.75*ME. There was a significant difference (p
Summary
Source-checkedPlain-language reading of the full paper, prepared with AI and checked against the text. Each point links to the authors' own words.
Why it matters
- Low productivity in Ethiopia's livestock sector is driven by animal diseases, low genetic potential, and shortages of quality and quantity of feed. View evidence ↗
- A lack of specific data on the nutrient requirements of indigenous Sub-Saharan African livestock breeds hinders the creation of accurate feeding practices to improve productivity. View evidence ↗
- In tropical regions, crossbred dairy cows generally exhibit higher productivity than indigenous purebred cows. View evidence ↗
The question
- The study aimed to investigate how different levels of energy diets affect the milk yield, milk quality, and body weight changes of indigenous Boran and crossbred dairy cows in Ethiopia. View evidence ↗
What they did
- Four treatment diets were tested based on maintenance energy requirements (MER): T1 (1× MER), T2 (1.25× MER), T3 (1.50× MER), and T4 (1.75× MER). View evidence ↗
- The study lasted 104 days, consisting of a 14-day adaptation period followed by 90 days of data collection. View evidence ↗
- Data on dry matter intake, milk yield, composition, and weight change were analyzed using a two-way ANOVA and the General Linear Model (GLM) procedure in SPSS. View evidence ↗
What they found
- For crossbred cows, increasing energy intake to 1.50× and 1.75× MER increased milk yield by 11% and 26%, respectively, compared to the maintenance level (T1). View evidence ↗
- Indigenous Boran cows showed a 20% and 24% increase in milk yield when fed 1.5× and 1.75× MER compared to those on the maintenance diet (T1). View evidence ↗
- Despite changes in milk yield, there were no significant differences in milk composition (fat, protein, lactose, and solids-non-fat) across the different energy treatments. View evidence ↗
- Cows fed the maintenance diet (T1) experienced significantly higher body weight loss than other groups, while those on T2 showed no significant weight change. View evidence ↗
- Significant weight loss occurred in T1, T3, and T4 for both breeds, with the most severe loss in T1: -30.80 kg for crossbreds and -11.11 kg for Boran cows. View evidence ↗
What it means
- The authors conclude that supplementing diets to 1.5× and 1.75× maintenance energy levels effectively increases milk yield for both crossbred and indigenous Boran cows. View evidence ↗
Figures & tables
From the original paper Table 1
 Table 2
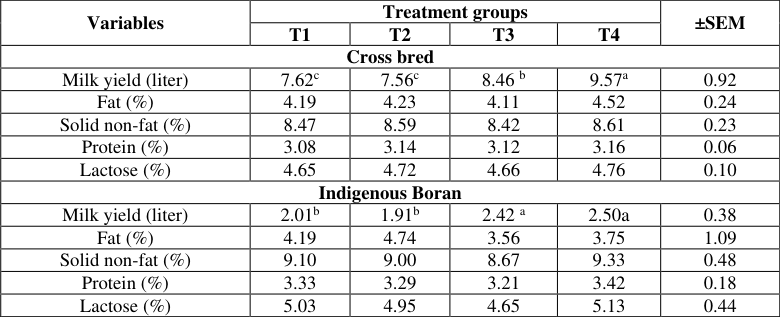 Table 3
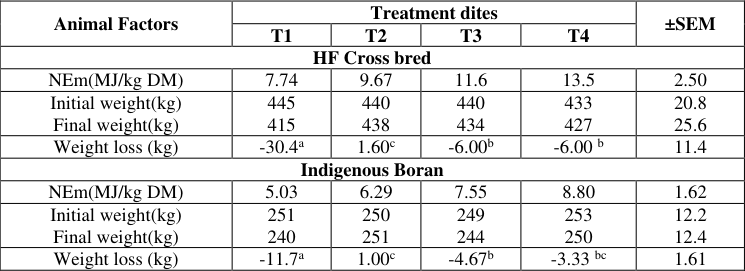 Table 4
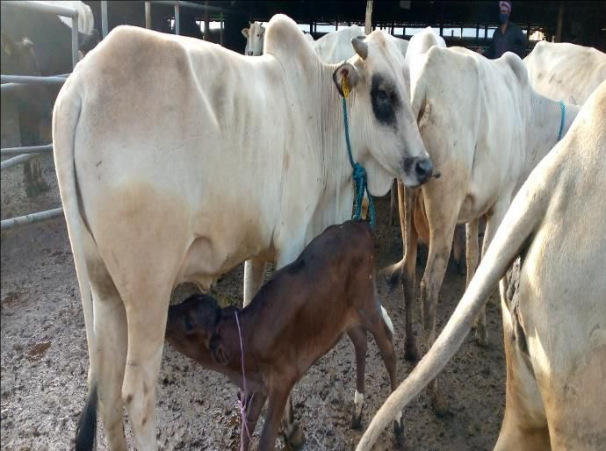 Figure 1
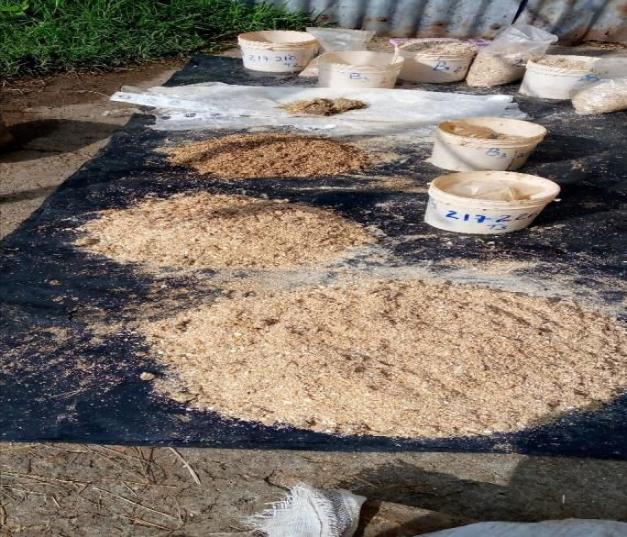 Figure 2
Introduction
Ethiopia has the largest livestock population in Africa and the livestock subsectors make substantial contributions to the livelihoods of farmers and livestock keepers as well as the national economy of the country. 97.4 percent of the total cattle population in the country are local breeds, and the remaining are hybrid and exotic breeds that accounted for 2.3 percent and 0.31 percent, respectively CSA (2021). Crossbred dairy cows are more productive than indigenous purebred cows in the tropics McDowell (1985) [11] . The average lactation period for indigenous dairy cows at the country level is estimated at seven months. Moreover, the average milk yield per cow per day is 1.48 liters and, 15.04 million milking cows produce 4.69 billion liters of milk per year CSA (2021). However, the potential of the livestock sector has not been fully exploited and the contributions achieved so far have been much below the potential of the animals' EIAR (2017). The prevailing low productivity level of the livestock sectors is due to feed shortage in terms of quantity and quality, the low genetic potential of animals, and the prevalence of animal diseases FAO (2018) [6] . Among these constraints, inadequate and low-quality feed resources are a limiting factor to the development of dairy production in all dairy production systems Belay et al. (2011) [4] . The major problem in livestock feeding systems in the country is the quality of most harvested and conserved feedstuffs when fed alone is unable to offer even the maintenance requirements of livestock. In general, poor nutrition is the major inhibitor of the country's livestock sector development and is expressed; in slow growth rate, low production, and reproduction performance and poorly fed animals give a low output of meat and milk Adugna (2007) [21] . Besides, the feeding standards for cattle, are followed by the National Research Council NRC (1985, 1996, and 2001). The lack of information on the nutrient need of indigenous livestock breeds in Sub-Saharan Africa is one of the challenges limiting ration formulation principles and accuracy in feeding practices to improve animal productivity and enhance the overall performance of the sector Thornton (2010). The nutrient needs of tropical animals are probably different from temperate countries because, there were genetic makeup differences, mature body size, growth rate, quality of feeds, climatic conditions, and differences in the efficiency of nutrient use of the animals ' Paul et al. (2004) [19] . In dairy production nutrient requirements are fixed and nutrients supplied above these requirements are partitioned among different functions such as growth or milk production NRC, (2001). Therefore, the objective of this study was to investigate milk yield, quality, and weight change, of crossbred and indigenous Boran dairy cows fed on different levels of energy diets in Ethiopia.
Materials and methods
Materials and methods
Study Area
The study was conducted at the Holeta Agricultural research center dairy farm. Holeta Agricultural Research Centre is located 25 km west of Addis Ababa at 38.5°E longitude and 9.8°N latitude, and an elevation of 2,400 meters above sea level. Holeta is situated in the central highlands of Ethiopia. The average annual rainfall is approximately 1,200 mm and the annual average temperature is 18 °C, and the average monthly relative humidity is 60% Demeke et al. (2004).
Animal Management
Twenty mid-lactating crossbred 50:50 (Holstein Frisian× Boran) dairy cows with an average body weight of 439.55±10.41 kg, milk yield of 8.07±0.61 liter/ day, and parity 3, 4, and 5, and also twelve indigenous Boran lactating cows with an average body weight of 250±1.71 kg and milk yield of 2.21±0.42 liter/ day were used. They were housed in an individual free-stall barn. The study was carried out for a total of 104 days; 14 days of adaptation to the experimental feed and 90 days of data collection on an actual experiment. All cows were dewormed before the start of the experiment. Experimental feed was offered at 8:00 AM and 3:00 PM, they had ad libitum access to water all the time. Milking was done at 5:00 AM and 3: 30 PM in the afternoon.
Feed Preparation and Feeding
The study feed ingredients were composed of native grass hay, cotton seed cake, wheat bran, cracked maize grain, and sugar cane molasses. Maize grain was purchased from Holeta city; wheat bran, molasses, and cotton seed cake from nearby oil processing and flour milling factories (Adama). The treatment diets were offered in a separate feeding trough twice a day at 8:00 AM and 3:00 PM. The treatment diets were formulated based on NRC, (2001). The experimental diets were, T 1 (=1 × maintenance energy requirement (MER));-, T 2 (=1.25 × MER), T3 (=1.50 × MER), and, T4(= 1.75 × MER).
Experimental Design
The experimental design was a randomized complete block design (RCBD) with four treatments and five replications. Blocking was done based on their initial body weight. Twenty Holstein Friesian (HF) crossbred dairy cows were blocked into five, and indigenous Boran cows were blocked into three blocks (a limited number of cows in the study area). Each of the four treatment diets was randomly assigned to each animal in each block.
Data Collection
Feed offered and refusals were recorded daily throughout the experimental period. Feed intake was calculated as the difference between the quantity of feed offered and feed refused from each animal per day. Milk yield for indigenous Boran cows was calculated as the difference in calves' weight gained before and after suckling and, crossbred dairy cows were milked by using a milking machine twice a day at 5:00 AM and 10:00 PM.
Analysis of Feed and Milk Samples
Before commencing the study, feed samples were analyzed for chemical composition. The DM content was determined by overnight drying the sample at 105oC according to the standard methods of the Association of Official Analytical Chemists (AOAC, 1990) [2] . Ash content was determined by igniting the sample in a muffles furnace at 550 0C for 3 h (AOAC, 1990) [2] . Total nitrogen (N) content was determined using the Micro Kjeldahl method, and the crude protein (CP) content was N* 6.25. Acid detergent fiber (ADF), and neutral detergent fiber (NDF) content were determined according to Van Soest and Robertson (1985) [17] , by using Fibertec TM 2010 and DAISY incubator. Milk samples were taken during the last 12 days of the study period and analyzed for total solids (TS), protein, fat, lactose MUN and solids-non-fat (SNF) content by a Milk Oscan Tester (LactoStar® Item No.3510; Funke Gerber; Berlin, Germany), using the methods described by AOAC (1990) [2] .
Statistical Analysis
A two-way ANOVA test was used to calculate the significance of animals fed on low or high energy levels. Data on DM intake, milk yield, milk composition, and average weight change was analyzed using the General Linear model (GLM) procedure of the statistical analysis for social science (SPSS). Duncan Multiple Range test was used for comparison of mean differences between treatments. The model used for data analysis was Yijkl = μ + Mj + Tk + Eijkl (nutrient intake, milk yield, milk composition, and weight change) Where; μ = overall mean; Mj = milk yield; Tk = treatment effect; Eijkl = random error Results will be presented as least square means with their standard errors of mean SEM.
Results
Results
Feed Chemical Composition
The chemical composition of the study feed ingredients was presented in table1. The dry matter (DM) content of native grass hay and wheat bran was higher as compared to other feeds and lower for sugar cane molasses. However, the crude protein (CP) content was highest for cotton seed cake (CSC), 24.39%, and the lowest for sugar cane molasses 3%. Higher neutral detergent fiber (NDF), acid detergent fiber (ADF), and total ash content were observed in native grass hay and the least was in molasses. In-vitro organic matter digestibility (IVOMD), is higher for molasses and lower for native grass hay.
| Treatments | DM% | Ash% | CP% | NDF% | ADF% | IVOMD | MEMJ/kg DM |
|---|---|---|---|---|---|---|---|
| NGH | 90.0 | 8.95 | 5.43 | 72.0 | 42.1 | 44.6 | 7.40 |
| CSC | 89.2 | 7.54 | 24.4 | 37.2 | 16.7 | 52.6 | 9.70 |
| WB | 90.2 | 4.66 | 15.1 | 42.9 | 12.0 | 68.9 | 8.69 |
| CMG | 88.7 | 4.23 | 7.40 | 16.6 | 3.55 | 73.6 | 10.1 |
| Molasses | 65.0 | 3.10 | 3.00 | 3.70 | 2.30 | 90.4 | 16.5 |
| ±SD | 11.0 | 2.45 | 8.71 | 26.2 | 16.1 | 20.4 | 3.50 |
Table text extracted from the original PDF; superscript letters are shown inline. The original table image is below.
View original table image
Dry Matter and Nutrient Intakes
The mean daily dry matter (DM) and energy intake of lactating crossbred and indigenous Boran dairy cows are presented in table 2. The treatment dites were comprised of cotton seed cake, wheat bran, cracked maize grain, liquid sugar cane molasses, and native grass hay. There was no significant difference in total dry matter intake but, a higher difference was observed in nutrient intake (energy intake). The result showed that the dietary energy and crude protein percentage increased as changing the proportion of ingredients in the experimental diets. The energy (Mcal/day) and crude protein (g/kg DM) intake were higher for T4, followed by T3, and T2, and, lower in treatment 1. The lowest energy intake was in treatment 1 (7,74MJ/kg DM and 5.30MJ/kg DM) for both cross-bred and indigenous Boran dairy cows. The highest energy intake was observed in treatment 4 (13.54MJ/kg DM and 8.80MJ/kg DM). However, the fiber (NDF and ADF) intake was higher in T1 and lower in T2, T3, and T4 respectively.
| Variables | Treatments | — | — | — | Mean±SD |
|---|---|---|---|---|---|
| T1 | T2 | T3 | T4 | ||
| Crossbred (50%) | |||||
| Energy Mcal/d | 7.74d | 9.67c | 11.6b | 13.5a | 0.00 |
| DMI kg/day | 7.00 | 7.70 | 7.70 | 7.70 | 0.35 |
| CPI g/kgDM | 0.41 | 0.51 | 0.61 | 0.72 | 0.13 |
Table text extracted from the original PDF; superscript letters are shown inline. The original table image is below.
View original table image
Milk Yield and Milk Quality
Milk yield and milk composition of cross-bred and indigenous Boran dairy cows were presented in table 3. There was a significant difference (P<0.05) in milk yield among the different treatment groups. Cross-bred cows fed on diets of 1.75* ME and 1.50* ME produced significantly higher milk yield, 26%, and 11% respectively than cross-bred dairy cows kept on a diet containing maintenance energy levels (T1). Similarly, indigenous Boran cows kept on diets containing 1.75* ME, and 1.5*MER produced 24% and 20% higher milk yields than Boran cows kept on lower energy levels (T1). Moreover, cows fed on 1.25* ME treatment dites were has no changes in milk yield compared to cows fed on T1. Even though there was variation in milk yield, no significant difference (P>0.05) was observed in milk composition (protein, fat, solid not fat, and lactose) at all treatment diets. Treatment 4 groups of cows produced higher milk of 9.57 liter/day for crossbred and 2.5 liter /day for indigenous Boran dairy cows.
| Variables | Treatment groups | — | — | — | ±SEM |
|---|---|---|---|---|---|
| T1 | T2 | T3 | T4 | ||
| Cross bred | |||||
| Milk yield (liter) | 7.62c | 7.56c | 8.46 b | 9.57a | 0.92 |
| Fat (%) | 4.19 | 4.23 | 4.11 | 4.52 | 0.24 |
| Solid non-fat (%) | 8.47 | 8.59 | 8.42 | 8.61 | 0.23 |
| Protein (%) | 3.08 | 3.14 | 3.12 | 3.16 | 0.06 |
| Lactose (%) | 4.65 | 4.72 | 4.66 | 4.76 | 0.10 |
| Indigenous Boran | |||||
| Milk yield (liter) | 2.01b | 1.91b | 2.42 a | 2.50a | 0.38 |
| Fat (%) | 4.19 | 4.74 | 3.56 | 3.75 | 1.09 |
| Solid non-fat (%) | 9.10 | 9.00 | 8.67 | 9.33 | 0.48 |
| Protein (%) | 3.33 | 3.29 | 3.21 | 3.42 | 0.18 |
| Lactose (%) | 5.03 | 4.95 | 4.65 | 5.13 | 0.44 |
Table text extracted from the original PDF; superscript letters are shown inline. The original table image is below.
View original table image
Body weight Change
The overall mean body weight change for both cross-bred and indigenous dairy cows was presented in table 4. The average initial live weights of cross-bred and indigenous Boran dairy cows were 439.55±10.41 and 250.75±1.75 kg respectively. Moreover, the average final body weight was 429±and 246±kg respectively. There is no significant difference in the initial body weight of experimental dairy cows in both groups. Nevertheless, significant variation was observed in the final body weight of dairy cows fed in different treatment groups. The data showed that cows fed on T1 had significantly (p<0.5) higher body weight loss compared to the other treatment groups and, there was no significant difference in body weight changes in T2 for both groups.
| Animal Factors | Treatment dites | — | — | — | ±SEM |
|---|---|---|---|---|---|
| T1 | T2 | T3 | T4 | ||
| HF Cross bred | |||||
| NEm(MJ/kg DM) | 7.74 | 9.67 | 11.6 | 13.5 | 2.50 |
| Initial weight(kg) Final weight(kg) | 445 415 | 440 438 | 440 434 | 433 427 | 20.8 25.6 |
| Weight loss (kg) | -30.4a | 1.60c | -6.00b | -6.00 b | 11.4 |
| Indigenous Boran | |||||
| NEm(MJ/kg DM) | 5.03 | 6.29 | 7.55 | 8.80 | 1.62 |
| Initial weight(kg) Final weight(kg) | 251 240 | 250 251 | 249 244 | 253 250 | 12.2 12.4 |
| Weight loss (kg) | -11.7a | 1.00c | -4.67b | -3.33 bc | 1.61 |
Table text extracted from the original PDF; superscript letters are shown inline. The original table image is below.
View original table image
Discussion
Discussion
Dry Matter and Nutrient Intake
The mean dry matter intake of experimental cows was presented in table 2. There was no significant difference (P>0.05) in dry material intake in all treatments. However, there were significant differences in energy intake ranges from 7.74 -13.50 Mcal/day for crossbred dairy cows, and 5.30-8.80Mcal/day for indigenous Boran dairy cows. The highest daily dry matter intake was observed in cows fed on the highest energy feed (T4), followed by T3, T2 and the lowest was in T1. The lowest DMI was observed in T1 (4.61kg/day) cows supplemented in the low level of energy feeds than in cows fed on the higher level of energy diet supplementations (T2, T3, and T4), this result is in line with the findings of Geleta and Demissu, (2020). Cows fed on T1 had the highest NDF intake than those cows maintained on T2, T3, and T4. The lowest neutral detergent fiber (NDF) intake recorded in cows supplemented with T4 might be attributed to the lowest fiber intake (grass hay) recorded in cows fed on T4 which in turn is associated with the high neutral detergent fiber (NDF) content of natural Rhodes grass hay (Radia et al. 2013) [9] . The low dry matter intake (DMI) recorded in cows supplemented with T1 might be attributed to the higher neutral detergent fiber (NDF) content of Rhodes grass hay and the lower proportion of energy feed that in turn negatively associated with intake (Arelovich et al. 2008) [8] . In T2, T3, and T4 the energy intake might enhance the efficiency of rumen microorganisms' fiber degradability and, digestibility thereby improving feed intake (McDonald et al, 2002). In general, animals on feeds with better energy and protein content have better intake than those fed on solely grass diets (Steinshamn, 2010) [20] . The low DM intake was recorded in cows supplemented with grass and cotton seed cake (T1).
Milk Yield and Composition
In this study, daily milk yield was increased with increasing the level of energy and protein supplementation. This result in agreement with Steinshamn, (2010) [20] . Adebabay et al. (2010) [10] indicated that supplemented cows produced significantly more milk than those grazed on natural pasture alone. According to Melku et al, (2017) [12] , the average daily milk yield for indigenous Boran dairy cows was 2.8±1 liters per day in mid-lactation was higher than our study. In this study daily milk yield of crossbred dairy cows was 8.07±0.5 liter/day was higher than the finding (7.3±0.1 liter /day) Demeke et al, (2004) for cross-bred dairy cows. But lower than (9.75-10.7s liter milk/day) supplementation with different proportions of breweries dried grain and maize bran mixtures on cross bred dairy cows Tesfaye et al, (2015). However, the milk yield for the Boran breed (2.21±0.9 liter/day) was lower than the result (3.4±0.2liter/day) observed by Demeke et al, (2004); Geleta and Demissu (2020). Generally, the indigenous breed of cows is considered low milk producer than crossbred (Tadesse and Dessie, 2003). Similar results were also reported by Rehrahie and Getu (2010) [13] , who indicated that crossbred cows fed on urea treated wheat straw-supplemented diet have significantly higher milk yield than non-supplemented animals of crossbred cows. Cows supplemented with lower energy content (T1) produced a considerable amount of milk at the expense of higher average body weight loss (-31kg). Therefore, when energy intake increased at the mid-stage of lactation, is expected to result in further increases in milk yield, but, when energy intake was reduced the cow mobilizes her body fat. Cows on lower energy intake (T1) dietary treatments in the present study were to lose body weight during the experimental period. Cows were still losing body weight at an increased energy level, but with a generally declining trend. This could probably be associated with the mobilization of body tissue to milk yield during the feeding trial. In the current study, there was no variation observed in milk composition (milk protein, milk fat, and total solid) among the different levels of energy intake. In this study, milk fat and milk protein of Boran cows were lower than the review finding of Mohammed (2017) but, milk lactose was higher than his finding.
Body Weight Change
The daily mean initial live weight and periodic weight changes of crossbred dairy cows fed on different levels of energy diets are presented in table 3. The result shown on mean daily live weight loss was significantly (P<0.05) higher among treatments. There was significant weight loss was observed in crossbred dairy cows fed on T1 (-30.80 kg), T3 (-6 kg), and T4 (-6 kg). Likewise, in Boran dairy cows there was significant weight loss in T1 (-11.11kg), T3 (-4.67kg), and T4 (-3.33kg). It agrees with the idea of SNV, (2017) [18] . If a cow receives less energy, it reduces its reserves of body fat and it starts to lose weight. Even so, in both (indigenous Boran and HF crossbred) experimental dairy cows there was no body weight loss in T2. The presence of noticeable differences in energy intake among the dietary treatment diets brings a significant effect on the weight change of the cows, which may be due to the utilization of nutrients consumed for milk production. During the early lactation (60-90 days after calving) all cows lost body weight, with a declining trend with an advance in lactation. A high amount of body weight loss of 120 g/day was reported by Getu (2006) for lactating crossbred cows. The efficiency of the mobilization of retained energy (weight loss) was assumed 80% of NEm (NASEM, 2016), and the retention of energy (weight gain) was assumed 68% of NEm (Freely, 2019).
Conclusions
Results showed that Holstein Frisian cross-bred and indigenous Boran dairy cows fed on native grass hay and supplemented with different levels of energy feeds have an effect on feed intake, milk yield, and weight changes of the experimental cows. This indicates that a remarkable improvement was achieved in milk yield by increasing the energy level of intake. The body weight loss was decreased as the energy intake of the cows increased from 1*MR to 1.5*MR and 1.75*MR except for 1.25*ME. This might be due to the T2 (1.25*ME) groups of cows producing lower milk yield and lower weight loss as compared to the remaining two treatment groups (T3 and T4). An average daily milk yield was increased for T3 and T4. From the study results, it can be concluded that diets containing 1.5*ME and 1.75 * ME increased milk yield by 11 %and 26% for cross-bred dairy cows and by 20% and 24% for indigenous Boran cows.
Acknowledgement
AcknowledgementsThis research work was funded as a whole or part of the United States Agency for International Development (USAID) Bureau for Food Security under Agreement # AID-OAA-L-15-00003 as part of Feed the Future Innovation Lab for Livestock Systems and EQUIP. The authors acknowledge Southern Agricultural Research Institute, Holleta Agricultural Research Center, and EIAR. The authors very much appreciate Holeta research center nutrition and dairy laboratory workers for the excellent technical support in gas production and chemical analyses. Disclaimer This research work was funded as a whole or part of the United States Agency for International Development (USAID) Bureau for Food Security under Agreement # AID-OAA-L-15-00003 as part of Feed the Future Innovation Lab for Livestock Systems. Additional funding was received from Bill & Melinda Gates Foundation. Any opinions, findings, conclusions, or recommendations expressed here are those of the authors alone.
Figures and tables from the paper
References
21 in the original paper- Haile BK, Joshi W, Ayalew A, Tegegne, Singh A. Estimates of genetic parameters for Boran, Friesian, and crosses of Friesian and Jersey with the Boran cattle in the tropical highlands of Ethiopia: milk production traits and cow weight. J. Anim. Breed. Genet. 2004;121:16317.
- AOAC. Official Methods of Analysis of AOAC International. 15 th ed. Assoc. Off. Anal. Chem., Arlington. (Book), 1990.
- CSA. Agricultural sample survey. Federal Democratic Republic of Ethiopia Central Statistical Agency. Private Peasant Holdings. Statistical Bulletin 570, Addis Ababa, Ethiopia, 2021.
- Belay D, Yisehak K, Geert P. Analysis of constraints facing urban dairy farmers and gender responsibility in animal management in Jimma Town. Af J Basic Appl Sci Belay, D., Yisehak, K. and Janssens, G.P. 2011;3:313-318.
- EIAR. Livestock Research Strategies; Feeds and Nutrition, Rangelands and Animal Health (2016 -2030). Addis Ababa, Ethiopia. 2017, p 6-20.
- FAO. Ethiopia: Report on feed inventory and feed balance, 2018. Rome, Italy. 160 pages. Licence: CC BY-NC-SA 3.0 IG, 2018.
- Freetly HC, Nienaber JA, Brandl TB. Partitioning of energy during lactation of primiparous beef cows. J. Anim. Sci. 2006;84:2157-2162.
- Arelovich HM, Abney CS, Vizcarra JA, Galyean ML. Effects of Dietary Neutral Detergent Fiber on Intakes of Dry Matter and Net Energy by Dairy and Beef Cattle: Analysis of Published Data. The Professional Animal Scientist. 2008;24:375-383.
- Radia H, Firew T, Zelalem Y, Zeleke M. Feed Intake Milk Yield and Milk Composition of Fogera Cows Supplemented with Different Feeds. 2013;3(2):41-45.
- Adebabay K. Characterization of Milk Production Systems, Marketing and On-Farm Evaluation of the Effect of Feed Supplementation on Milk Yield and Composition of local cows at Bure district. M.Sc. Thesis. Bahir Dar University, Ethiopia, 2009, p. 3-8.
- McDowell. Crossbreeding in tropical areas with emphasis on milk, health and fitness, Journal of Dairy Science. 1985;68:2418-243.
- Melku M, Kefyalew A, Solomon G. Milk Production Performances of Local and Crossbred Dairy Cows in West Gojam Zone, Amhara Region, Ethiopia. Journal of Applied Animal Science. 2017;10(1):35-46.
- Rehrahie M, Getu K. Effect of feeding urea treated wheat straw-based diet on biological performances and economic benefits of lactating Boran-Friesian crossbred dairy cows. Ethiopian Institute of Agricultural Research (EIAR), Holetta Research Center, P.O.Box. 2003. Addis Ababa, Ethiopia, 2010.
- NRC. Nutrient Requirements of Dairy Cattle. 1989. 6th revised edition. Washington D.C: National Academy Press, 2001.
- NRC. Nutrient Requirements of Sheep. 6 th rev. ed. National Academy Press, Washington, DC, USA, 1985.
- NRC. Nutrient requirements of beef cattle. 7th Rev. ed. National Academic Press, Washington, DC, 1996.
- Van Soest PJ, Robertson JB, Lewis BA. Methods of dietary fiber, neutral detergent fiber and non-starch polysaccharides in relation to animal nutrition. J Dairy Sci. 1991;74(10):3583-3597.
- SNV. Dairy Cattle Feeding and Nutrition management. Training Package for Dairy Extension Workers Part I training manual and Part II guiding manual, 2017.
- Paul SS, Mandal AB, Mandal GP, Kannan A, Pathak NN. Deriving Nutrient Requirements of Lactating Indian Cattle under Tropical Condition. Asian-Aust. Journal of Animal science. 2004;17(6):769-776.
- Steinshamn Havard. Effect of forage legumes on feed intake, milk production and milk quality -a review. Animal Science Papers and Reports. 2010;28(3):195-206.
- Adugna T. Feed Resources for Producing Export Quality Meat and Livestock in Ethiopia Examples from Selected Woredas in Oromia and SNNP Regional States. 2007;97:156.72.15.