
Research article · 2022 · Full text
International Journal of Biology SciencesDiversity and longitudinal dynamics of benthic macro-invertebrate populations in the shallow zone of the Chari River at Sarh (Chad, Central Africa)
Volume 4(2) · Pages 235–243 · DOI: 10.33545/26649926.2022.v4.i2d.125 ↗
Research areasFreshwater macroinvertebrate diversity and ecologyAquatic Invertebrate Ecology and BehaviorAquatic Ecosystems and Biodiversity
Abstract
Author-writtenThe biology of Chadian freshwater aquatic environments is little known and works on benthic macroinvertebrates dates back to at least the 1980s thanks to the work of the office for scientific and technical research overseas (ORSTOM). This study was carried out in the Chari River, Bahr Kôh Department (Moyen Chari) over a distance of 52 km on the edge of the town of Sarh in order to assess the family diversity of macroinvertebrates. Sampling was carried out in shallow environments with a weak current. A haze net constituted of a 1 m long sleeve and a collector with a circular opening of 30 cm diameter and a mesh size of 500 µm was used following the multi-habitat approach according to the Barbourt method adapted by Stark. Sampling was carried out on a monthly basis during the flood period from August to November 2020, which corresponds to the period of maximum lateral expansion of the Chari, and during the low-water period from February to May 2021, which corresponds to the period when the water level of the Chari reached its lowest point. The fauna surveyed is composed of 10464 individuals belonging to 98 families, 17 orders and 7 classes. Insects are the most represented and constitute 76.53% of the total richness of the macrofauna collected, followed by molluscs composed of 13.26%, including 9.18% of gastropods. Annelids, Crustacea and Chelicerata were the groups with the lowest number of individuals (of the population). Chironomidae and Dytiscidae had the highest total family richness, while Thiaridae was the most abundant family. The Kruskal-wallis test was applied to explain the good spatiotemporal diversity of the stands. Depending on the season, low diversity was observed at the end of low water and during high water. The high taxonomic richness of the entomofauna, dominated by pollutants, at stations where human activities are taking place indicates a state of disturbance linked to pollution. While the spatial distribution of total abundance was dominated by Molluscs (Thiaridae, Corbiculidae) in the downstream stations is explained by the mineralisation and enrichment in organic matter of these stations.
Summary
Source-checkedPlain-language reading of the full paper, prepared with AI and checked against the text. Each point links to the authors' own words.
Why it matters
- Benthic macroinvertebrates are essential tools for monitoring water quality and identifying environmental disturbances that physical-chemical methods might miss. View evidence ↗
- There is a lack of current data regarding the structure of benthic macroinvertebrate populations in Chad, despite increasing human-driven pressures on the environment. View evidence ↗
- The Chari River catchment is subject to direct wastewater discharges from various industrial units, including slaughterhouses and textile companies. View evidence ↗
The question
- The study aimed to assess the taxonomic diversity and longitudinal distribution of benthic macroinvertebrates in the Middle Chari River at Sarh. View evidence ↗
What they did
- Researchers selected 12 stations along a 52 km longitudinal gradient of the Chari River in the Bahr Kôh Department. View evidence ↗
- Organisms were collected using a haze net with a 1 m sleeve, a 30 cm diameter opening, and a 500 µm mesh size, following a multi-habitat approach. View evidence ↗
- Data analysis was performed using PAST software, employing the Shannon index for diversity, the Piélou Equitability index, and Simpson's dominance index. View evidence ↗
What they found
- The study identified 10,464 individuals belonging to 98 families, 17 orders, and 7 classes. View evidence ↗
- Insects were the most dominant group, accounting for 76.53% of the total taxonomic richness with 75 families. View evidence ↗
- The Thiaridae family was the most abundant with 4,622 individuals (44.2%), followed by Corbiculidae with 1,356 individuals (13.0%). View evidence ↗
- The Shannon diversity index peaked at 4.95 bits in November (end of rainy season) and dropped to 0.65 bits in May (end of dry season). View evidence ↗
- Taxa constancy varied, with 22.45% being constant, 21.43% incidental, 17.35% accidental, and 38.77% considered rare. View evidence ↗
What it means
- The authors conclude that the dominance of Diptera and Coleoptera in areas of human activity indicates environmental disturbance caused by pollution. View evidence ↗
Visual summary
1 visualsIllustrations explain the paper; they do not show study data.
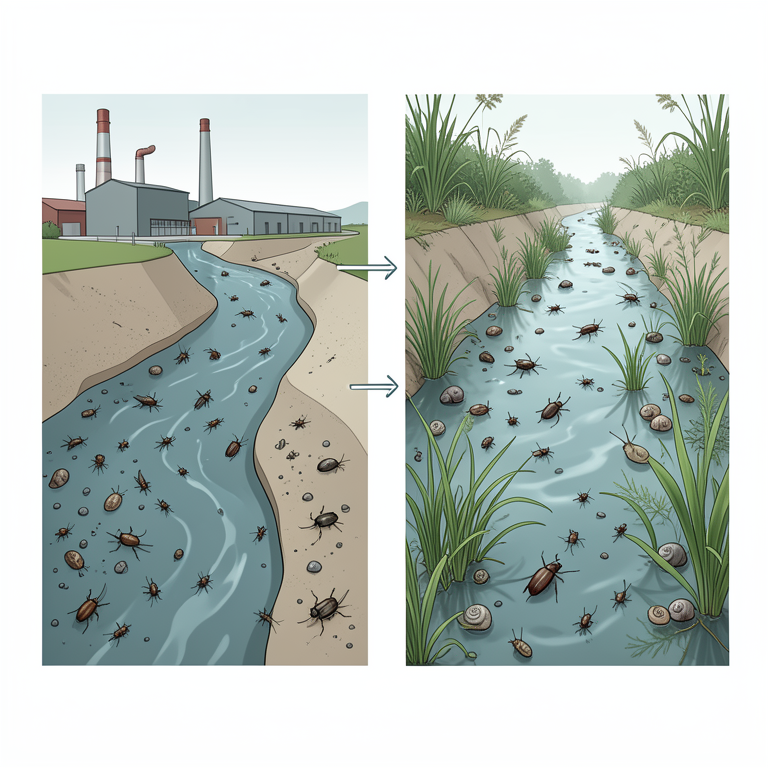
Impact of Anthropogenic Pressure on River Fauna
AI-generated conceptual illustration (Benthic macro-invertebrates (Diptera, Coleoptera, and molluscs) in the Chari River). It explains the idea and does not show study data.
View source evidence ↗Figures & tables
From the original paper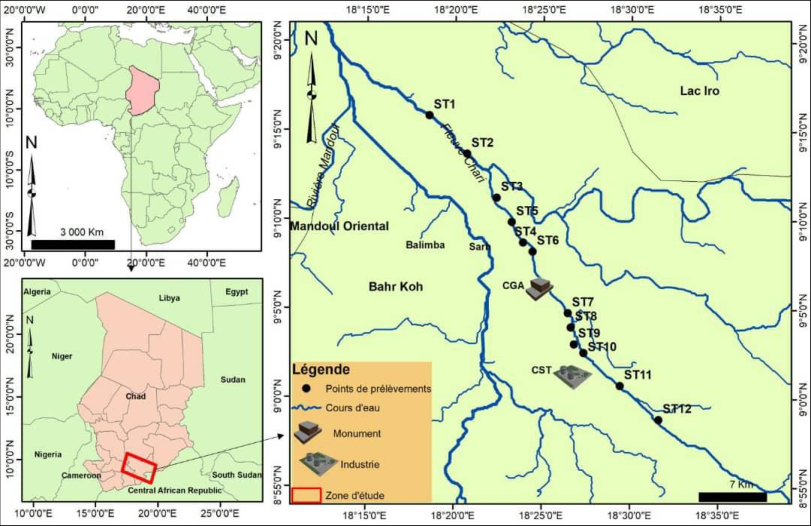 Figure 1
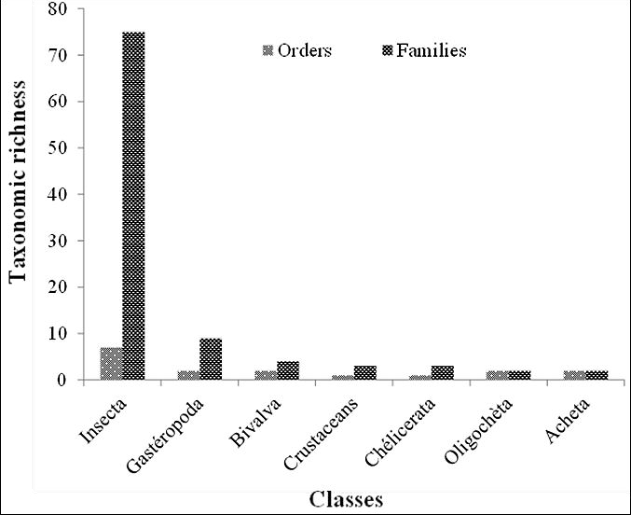 Figure 2
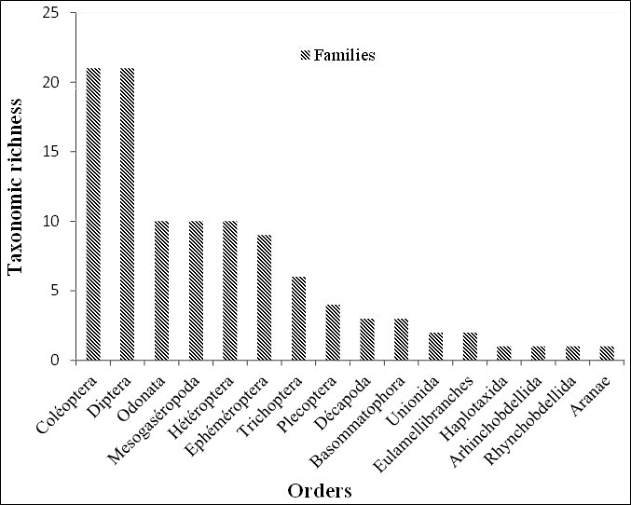 Figure 3
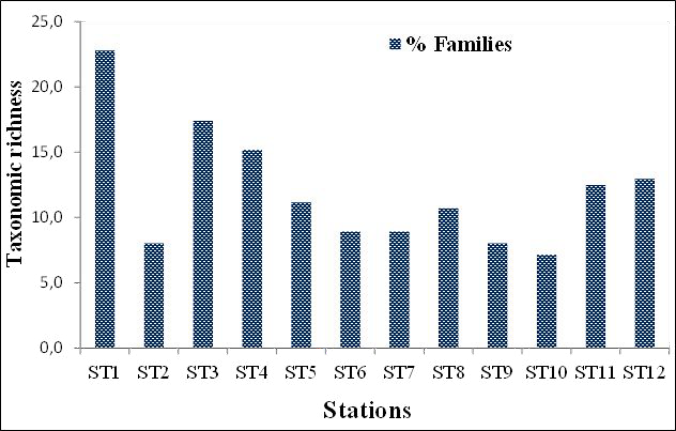 Figure 4
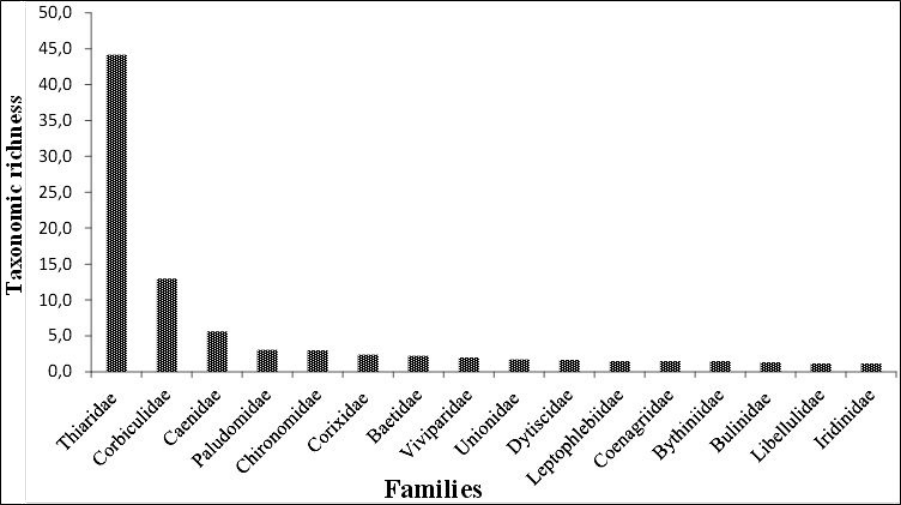 Figure 5
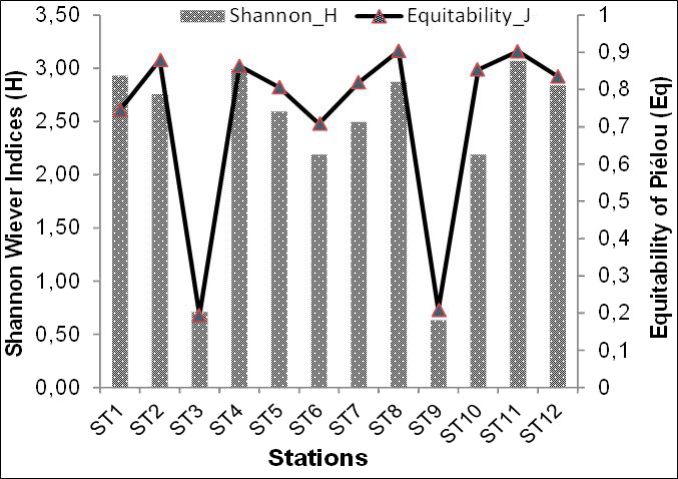 Figure 6
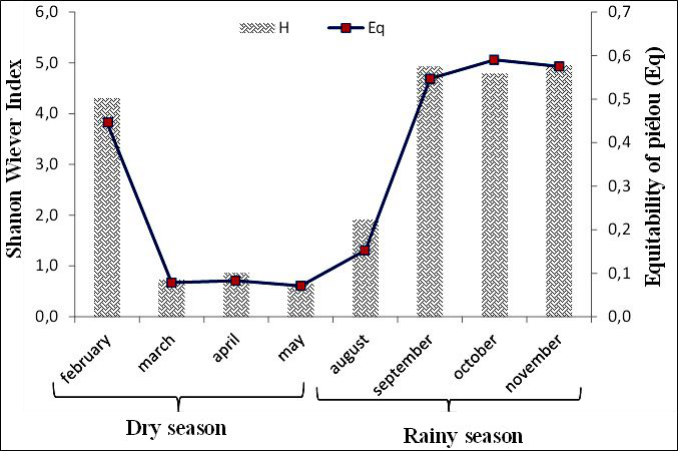 Figure 7
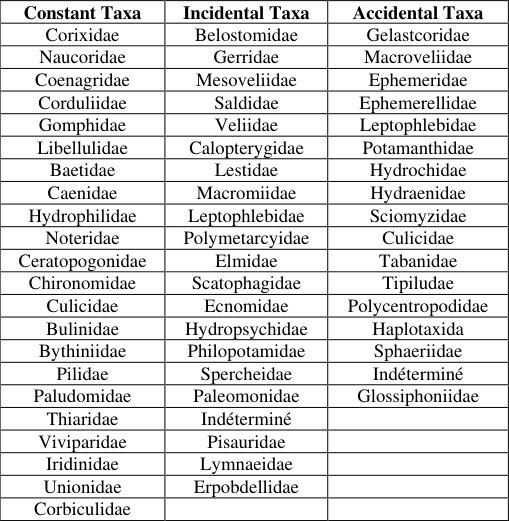 Table 1
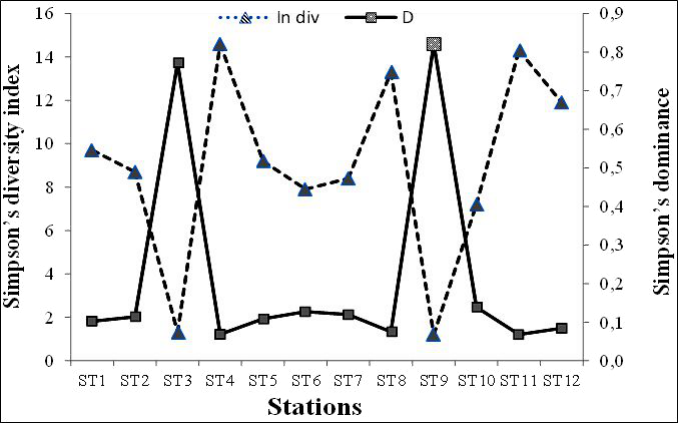 Figure 8
Introduction
Macroinvertebrates are animal organisms that are visible to the naked eye, have no backbone and live more or less on the bottom of rivers and lakes. They consist mainly of insects, molluscs, crustaceans and worms [1] . Macroinvertebrates also help to identify past disturbances of an environment and the toxic effects of these disturbances, which are generally inaccessible by physical-chemical methods [2] . They are the most used to assess water quality and monitor hydrosystems [3] . Freshwater ecosystems, made up of complex and fragile balances between living communities and their habitats, are both a reflection of the health of natural environments and the subject of major issues for human societies: health, economic, heritage, tourism and cultural issues [4] . Rivers are among the most complex and dynamic ecosystems [5] . They are highly diversified and play a crucial role in the conservation of biodiversity [6] . However, aquatic ecosystems are threatened by human activities with increasing pressures [7,8,9] . Anthropogenic activities include direct and indirect discharges of urban and industrial wastes into riverbeds, irresponsible irrigation of fields, deforestation, overgrazing and construction of hydroelectric dams on rivers and emission of greenhouse gases [10,11] . The anthropogenic effects on river ecosystems are such that biodiversity in general and the structure of aquatic In vertebrates in particular is destabilised [58,33] . Deforestation could cause the disappearance of more than a million species of vertebrates, invertebrates and many other living beings by 2050 [12] . In Chad, the limited research on aquatic macrofauna is ageing [13,14,15,16,17,18,19,20,21,22,23,24,25,26,27,28,29,30] . There is also very little data on the structure of benthic macroinvertebrate populations in Chad in a context of increasing and excessive anthropic pressure. Most of this work has been carried out on Lake Chad and the benthic fauna collected is represented by three groups of macroinvertebrates such as worms, molluscs and insects, which have been the subject of intensive studies over several years. The Chari is the main tributary of Lake Chad, whose water inflow represents about 92% of the total inflow of the lake basin [31] . It is characterised by a low slope, often deep bed and permanent flow, or almost. The floodplains give rise to rich ecosystems supporting biodiversity and key economic activities such as fishing, livestock and flood recession agriculture or market gardening as well as the establishment of small industrial units such as the Chad Sugar Company (CST), the Chad-Cotton New Company (SN), the New Chad Textile Society (NSTT) and the Sarh slaughterhouse all along the Chari River. The wastewater from these industrial units is discharged directly into the Chari River catchment. The general objective of this study is to assess the longitudinal distribution of benthic macroinvertebrates in the Chari River in the Middle Chari (Sarh) with a particular focus on its taxonomic diversity. More specifically, it aims to 1. Identify macroinvertebrates down to family rank. 2. Determine their spatial distribution along the town of Sarh.
Material and Method 2.1 Study environment
The Chari River is a permanent watercourse and the most important, 1200 km long, of which 800 km are in Chad. It rises in the KAGAS massif in the Central African Republic at an altitude of 500 to 600 m. At the entrance to Chad, the Chari is made up of three Central African rivers: the Bamingui (356 km long), the Gribingui (418 km) and the Bangora (355 km), which cover an area of about 80,000 km 2 to form the Chari River watershed. It accounts for 90% of the water inflow that crosses a large part of the Sudano-Sahelian strip to flow into Lake Chad [31] . With a length of about 52 km, the middle course of the Chari River in the study area extends between 09°15'49.66'' and 09°2'31.88'' North Latitude and between 018°18'32.38'' and 018°27'21.77'' East Longitude. This river is under the influence of a tropical climate characterised by two seasons, a long dry season from November to May and a short rainy season lasting only 5 months from June to October in the Sudanian zone. Temperatures are relatively high with a monthly average minimum (January) of around 25.3 °C and maximums of 31.7 °C (April) [32] . Petrographically, the bedrock of the Middle Chari is made up of ferralitic and ferruginous cuirassed soils. The extreme south, which is well irrigated (rainfall of 600 to 1,200 mm), is covered with dense vegetation of mesophilic, deciduous forest, with leguminous and combretaceae plants, dominated by: Isoberlinia doka, Prosopis africana, Anogeissus leiocarpus, Burkea africana, Butyrospermum parkii [33] . Anthropogenic activities in the catchment area of the study zone are essentially made up of mini-industries (slaughterhouses, CST, NSTT, etc.), market gardening and subsistence farming activities. Hospital wastewater discharge and sand collection on the riverbed are also practiced in the study area.
To assess the impact of these activities on the existing ecosystems, twelve (12) stations were selected along a longitudinal gradient of the Chari River. The choice of stations was based on the presence or absence of anthropogenic activities, the diversity of habitats (clay, claysilt, sand, plant debris), and the accessibility and collaboration of the riparian population.
The following figure shows the location of the benthic macroinvertebrate sampling sites in the Chari River.
Method 2.2.1 Sampling of macroinvertebrates
Sampling was carried out on a monthly basis during the flood period from August to November, which corresponds to the period of maximum lateral expansion of the Chari, and during the low-water period from February to May, which corresponds to the period when the water level of the Chari is at its lowest level.
The study was carried out in shallow areas with a weak current on various mineral habitats (sand, clay) and/or under vegetation (floating macrophytes, bank heliophytes). A haze net consisting of a 1 m long sleeve and a collector with a circular opening of 30 cm diameter and a mesh size of 500 µm was used following the multi-habitat approach according to the method of [34] , adapted by [35] .
At each station of about 100 m, a total of 20 net shots were given in micro-habitats (substrate/velocity). The net was dragged over the sediment for a distance of 50 cm from downstream to upstream.
Floating solids and roots of surface and bank macrophytes were collected for organism sampling. The collected organisms were collected in jars containing 90% alcohol and clearly labelled for each sampling site. Before each collection, the net is completely cleaned to avoid mixing the samples.
Sorting and identification
After cleaning the samples, the organisms were sorted under a Nikon binocular loupe and with stainless steel forceps. During this operation, the invertebrates were separated according to their morphological appearance and grouped by class and order. Taxonomic determination was carried out up to family and genus or species level under the binocular loupe and with the help of available identification keys such as [36,37,38,39,10,41,42] .
Data analysis and processing 2.3.1 Stand analysis
The taxonomic richness corresponds to the number of taxa present in each sample. This S-index can be used to analyse the taxonomic structure of the stand. The richness was determined per station. The percentage of occurrence (C) is used to obtain the constancy of a species in a given environment. It is the ratio expressed as a percentage between the numbers of samples (p) in which the species i appear and the total number of samples (P) of the biocenosis unit considered [43] . It is obtained according to the formula:
The value of C makes it possible to distinguish three groups of species [43] :
The abundance of macroinvertebrates was determined at each station. It corresponds to the number of individuals (N) of a species or taxonomic group in a given sample. Relative abundance (Nr) is the percentage ratio of individuals number of a species of a station to the total number of individuals of all species at all stations.
Diversity analysis
These are mathematical formulae or graphical representations that provide information on the structure of the stand and allow a quick assessment of the stand [44] . The PAST software was used. The Shannon index is the most useful index that best expresses stand diversity. It has the advantage that it is not dependent on any prior assumptions about species diversity or the distribution of species and individuals [45] .
It is an index that takes into account the relative abundance of each species and the species richness [46] .
Where: Pi=Ni/N, where Ni is the number representing the species of i and N = the total number of individuals; S is the number of species and Pi the proportion of the itch species (i varying from 1 to S). This index has as unit the "bit", its value depends on the number of species present, their relative proportions and the logarithmic base. Equitability (Eq) [47] was developed to account for the relative abundance of each taxon, the regularity of the distribution of taxa or equi-partition and the quality of organisation of the stand. Indeed, the more balanced a stand is (no largely dominant taxon), the more stable it is. Conversely, any outbreak of a species is a sign of imbalance due to a natural or anthropogenic cause.
Equitability (E) is the ratio between the effective diversity (H') of the community and its maximum diversity (log2S) [48] . It reflects the quality of the organisation of a stand [49] .
It is obtained according to the formula: Eq= H'/log2 (S) where H' is the Shannon index and S is the species richness. It varies between 0 and 1. Eq is 0 when a single species dominates and 1 when all species have the same dominance.
The dominance index of [47] measures the dominance effect rather than the richness of a group of species. The distribution of family wealth at the station level is quite variable (Figure 3). Wealth ranged from 16 to 51 families. The lowest richness was observed at station ST10 (7.1%) in the upstream part of the Chari and the highest richness was noted at station ST1 (22.8%) downstream. This explains the dominance of the downstream stations in terms of macroinvertebrate numbers.
Temporal variation of the Shannon index and Piélou equitability
The temporal variations of the Shannon index, illustrated in Figure 7, were represented by its highest value (4.95 bits) at the end of the rainy season (November) and its lowest value (0.65 bits) at the end of the dry season (May).
As for the Piélou Equitability, the index ranged from 0.15 in August to 0.59 in October. This shows that there is a significant difference between these stations and the others (p<0.05).
Constancy of taxa
The percentage of occurrence calculated from the presenceabsence matrix made it possible to determine the frequency of families in the Chari River section (Table 2). Thus, 22.45% of taxa were constant during the sampling campaign, 21.43% of taxa were incidental and 17.35% were accidental. The remaining taxa (38.77%) whose frequency was below 15% were considered rare in the Middle Chari.
Discussion
The study of benthic macroinvertebrates collected in the Chari River in the Barh-Koh (or Sarh) Department revealed 10464 individuals, divided into 98 families, 7 orders and 7 classes. This faunal composition of the benthic macrofauna appears to be more diverse than that found in the Oued Khoumane River in Morocco [3] and the Nga River in Cameroon [50] . On the other hand, it seems close to the results of work carried out [51] in the watercourses of the Moukalaba Doudou National Park in south-west Gabon, the urban and peri-urban watercourses of Douala in Cameroon [52] and the Niger River in Niamey [53] , which reveals that the family richness of the watercourses of Chad corresponds perfectly to the richness of the macroinvertebrates of African freshwater [54] . The macrofauna of the Middle Chari is mainly made up of insects. It is dominated by Diptera and Coleoptera. These insects are found in stations where human activities are taking place, indicating a state of disturbance linked to pollution [9] . This assertion is explained by the low presence of Heteroptera, Ephemeroptera and Trichoptera, which are pollution-sensitive insects whose presence indicates good water quality [55,9,34] . The taxonomic richness of the malacological fauna was less representative than that of the insects, but it almost matches the richness of the Molluscs inventoried in the aquatic environments of African freshwater [34] . The distribution and proliferation of these Molluscs in continental waters is based on the type of vegetation, the calcium content, the nature of the substrate and the speed of the water current [42] . The total richness of the Gastropod families is represented by the Pilidae while that of the Bivalves is made up of the Unionidae. This result corroborates that obtained in the Alibori River in Benin [6] . The spatial distribution of the total abundance of Molluscs in the Middle Chari is dominated by the Mesogasteropods, of which the Thiaridae occupy the first place, followed by the Eulamellibranchs dominated by the Corbiculiidae. This colonisation of the Molluscs was observed in the stations downstream of the river. This can be explained by the mineralization and enrichment in organic matter of the stations downstream due to agricultural and market gardening activities and the discharge of wastewater from the slaughterhouse. This observation highlights the importance of the existence of aquatic plants on which these molluscs feed in these stations [56] . The temporal variation in the abundance of families evolves dynamically with rainfall and flooding, which accelerates the productivity of aquatic ecosystems and a denser vegetation cover of habitats. This contributes to the multiplication and development of benthic macroinvertebrate larvae [56,49] . The results of the diversity indices show that values of the Shannon index are higher than 3 bits in most of the stations reflecting a good diversity of benthic macroinvertebrates in these stations except at ST3 and ST9 where Thiaridae and Corbiculiidae dominate respectively. While the Piélou Equitability values were close to (E<1) in most of the stations, supporting the Shannon index results obtained above [45] . Simpson's diversity index showed that the values are lower than 0.1 in all stations but they were close to 1 in stations ST3 and ST9. This result reinforces the statements of Shannon [47] .
Figures and tables from the paper
| Constant Taxa | Incidental Taxa | Accidental Taxa |
|---|---|---|
| Corixidae | Belostomidae | Gelastcoridae |
| Naucoridae | Gerridae | Macroveliidae |
| Coenagridae | Mesoveliidae | Ephemeridae |
| Corduliidae | Saldidae | Ephemerellidae |
| Gomphidae | Veliidae | Leptophlebidae |
| Libellulidae | Calopterygidae | Potamanthidae |
| Baetidae | Lestidae | Hydrochidae |
| Caenidae | Macromiidae | Hydraenidae |
| Hydrophilidae | Leptophlebidae | Sciomyzidae |
| Noteridae | Polymetarcyidae | Culicidae |
| Ceratopogonidae | Elmidae | Tabanidae |
| Chironomidae | Scatophagidae | Tipiludae |
| Culicidae | Ecnomidae | Polycentropodidae |
| Bulinidae | Hydropsychidae | Haplotaxida |
| Bythiniidae | Philopotamidae | Sphaeriidae |
| Pilidae | Spercheidae | Indéterminé |
| Paludomidae | Paleomonidae | Glossiphoniidae |
| Thiaridae | Indéterminé | |
| Viviparidae | Pisauridae | |
| Iridinidae | Lymnaeidae | |
| Unionidae | Erpobdellidae | |
| Corbiculidae |
Table text extracted from the original PDF; superscript letters are shown inline. The original table image is below.
View original table image
References
40 in the original paper- Stewart AD, Morrow EH, Rice WR. Assessing putative interlocus sexual conflict in Drosophila melanogaster using experimental evolution. Proc. Biol. Sci. 2005;272(1576):2029-2035.
- Ben Moussa A, Chahlaoui A, Rour E, et al. Diversité taxonomique et structure du macrofaune benthique des eaux superficielles de l'oued khoumane. Moulay idriss Zerhoun, Maroc. J Mater. Environ. Sci. 2014;5(1):183198.
- Dynesius M, Nilson C. Fragmentation and Flow Regulation of River Systems in the Northeast Third of the World. Science. 1994;266:753-762.
- Agblonon THM, Adandedjan D, Chikou A, et al. Inventaire et caractéristiques faunistiques des macroinvertébrés de la rivière Alibori dans le bassin cotonnier du Bénin (Afrique de l'Ouest). IJIAS. 2017;21:433-448.
- Zabi GS, Le Loeuf P. Revue des connaissances sur la faune benthique des milieux margino-littoraux d'Afrique de l'ouest. Deuxième partie : peuplements et biotopes Revue Hydrobiologie Tropicale. 1993;26(1):19-51.
- Dokulil M, Chen W, Cai Q. Anthropogenic impacts to large lakes in China: the Tai Hu, example. Aquatic Ecosystem Health and Management. 2000;3:81-94.
- Koji E, Noah Ewoti OV, Onana FM, et al. Influence of Anthropogenic Pollution on the Abundance Dynamics of Some Freshwater Invertebrates in the Coastal Area of Cameroon. Journal of Environmental Protection. 2017;8:810-829.
- Carmouze JP, Déjoux C, Durand JR, et al. Grandes zones écologiques du lac Tchad. Cahier ORSTOM sér. Hydrobiol. 1972;6(2):103-169.
- Déjoux C. Contribution à l'étude des insectes aquatiques du Tchad. Catalogue des Chironomidae, Chaoboridae, Odonates, Trichoptères, Hémiptères, Ephéméroptères. Cah. ORSTOM, sér. Hydrobiologie. 1968;2(2):51-78.
- Déjoux C. Contribution à l'étude des premiers états des Chironomides du Tchad (2 e note), description de Tanypus fuscus et Tanypus Zacustris. Bulletin du Musée national d'Histoire naturelle, 2 e série. 1969;41(5):1152-1163.
- Déjoux C. Contribution à l'étude des premiers états des Chironomides du Tchad (3 e note), description comparée des nymphes de Nilodorus brevipalpis, N. brevibucca et N. fractilobus. Bull. Mus. nation. Hist. nat. Paris. 1970;42(1):175-184.
- Déjoux C. Recherches sur le cycle de développement de Chironomus pulcher. Canad. Entomol. 1971;103:465470.
- Déjoux C. Contribution à l'étude des premiers états des Chironomides du Tchad (6e note), description de Tanytarsus (Rheotanytarsus) Ceratophyllin sp. Cah. OR5TOM, série Hydrobiologie. 1973;7(2)65-75.
- Déjoux C, Lauzanne L, Lévêque C. Evolution qualitative et quantitative de la faune benthique dans la partie est du lac Tchad. Cah. ORSTOM, série Hydrobiologie. 1969;3(1):3-58.
- Déjoux C, Lauzanne L, Lévêque C. Nature des fonds et répartition des organismes benthiques dans la région de Bol (archipel est du lac Tchad). Cahier. ORSTOM, série Hydrobiologie. 1971;5(3-4):213-223.
- Dupont B, Lévêque C. Biomasse en Mollusques et nature des fonds dans la zone est du lac Tchad. Cahier ORSTOM série Hydrobiologie. 1969;2:113-126.
- Lauzanne L. Inventaire préliminaire des Oligochètes du lac Tchad. Cahier ORSTOM, série. Hydrobiologie. 1968;2(2):83-110.
- Lévêque C. Répartition quantitative des Mollusques du lac Tchad en avril 1968 et mars/avril 1970 (données de base). ORSTOM, Fort Lamy; c1970. p. 14.
- Lévêque C. Mollusques benthiques du lac Tchad: écologie, étude des peuplements et estimation des biomasses. Cah. ORSTOM, série. Hydrobiologie. 1972;6(1):3-45.
- Lévêque C. Dynamique des peuplements, biologie et estimation de la production des mollusques benthiques du lac Tchad. Cahier ORSTOM, série. Hydrobiologie. 1973;7(2):117-147.
- Lévêque C. Etude systématique et biométrique des Lamellibranches Unionidés et Mutelidés du bassin tchadien. Cahier ORSTOM, série. Hydrobiologie. 1974;8(2):105-117.
- Lévêque C. Mollusques des herbiers à Ceratophyllum du lac Tchad. Biomasses et variations saisonnières de la densité. cah. ORSTOM, sér. Hydrobiologie. 1975;9(1):25-31.
- Lévêque C, Gaborit M. Utilisation de l'analyse factorielledes correspondances pour l'étude des peuplements en Mollusques benthiques du lac Tchad. Cahier ORSTOM série Hydrobiologie. 1972;6(1): 4766.
- Billon B, Guiscafre J, Herbaud J, et al. Le bassin du fleuve Chari. Monographies Hydrologiques ORSTOM. 1974;2:340.
- Barbour MT, Gerritsen J, Snyder BD, Stribling JB. Rapid bioassessment protocols for use in stream and wadeable rivers: periphyton, benthic macroinvertebrates and fisherie 2nd edition, US. Environmental Protection Agency, office of water, Washington, DC, EPA. 1999;841:99-002, 664.
- Lévêque C. Répartition quantitative des Mollusques du lac Tchad en avril 1968 et mars/avril 1970 (données de base). ORSTOM, Fort Lamy; c1970. p. 14.
- Lévêque C. Mollusques benthiques du lac Tchad : écologie, étude des peuplements et estimation des biomasses. Cah. ORSTOM, série. Hydrobiologie. 1972;6(1):3-45.
- Lévêque C. Dynamique des peuplements, biologie et estimation de la production des mollusques benthiques du lac Tchad. Cahier ORSTOM, série. Hydrobiologie. 1973;7(2):117-147.
- Lévêque C. Etude systématique et biométrique des Lamellibranches Unionidés et Mutelidés du bassin tchadien. Cahier ORSTOM, série. Hydrobiologie. 1974;8(2):105-117.
- Lévêque C. Mollusques des herbiers à Ceratophyllum du lac Tchad. Biomasses et variations saisonnières de la densité. cah. ORSTOM, sér. Hydrobiologie. 1975;9(1):25-31.
- Mazzola A, Mirto S, La Rosa T, et al. Fishfarming effects on benthic community structure incoastal sediments: analysis of meiofaunal recovery. Journal of Marine Science. 2000;57:1454-1461.
- Daget J, Durand JR, Étude du peuplement de poissons d'un milieu saumâtre tropical poïkilohalin : la baie de Cocody en Côte d'ivoire. Cahier. ORSTOM, sérier Hydrobiologie II. 1968;2:91-111.
- Simpson EH. Measurement of diversity. Nature. 1949;163:688-688.
- Piélou EC. Shannon's formula as a measure of specific diversity: its use and mesure. American Nature. 1969;100:463-465.
- Foto MS, Zebaze TSH, Nyamsi TNL, et al. Macroinvertébrés Benthiques du cours d'eau Nga. Essai de Caractérisation d'un Référentiel par des Analyses Biologiques. European Journal of Scientific Research. 2010;43(1):96-106.
- Zabi GS, Le Loeuf P. Revue des connaissances sur la faune benthique des milieux margino-littoraux d'Afrique de l'ouest. Deuxième partie : peuplements et biotopes Revue Hydrobiologie Tropicale. 1993;26(1):19-51.
- Alhou B, Micha JC, Dodo A, et Awaiss A. Etude de la qualité physicochimique et biologique des eaux du fleuve Niger à Niamey. International Journal of Biological and Chemical Sciences. 2009;3:240-254.
- Diomandé D, Gourène G, Sankaré Y, Et Zabi SG. Synopsis de la classification des larves et des nymphes de Diptères Chironomidae des écosystèmes dulçaquicoles de l'Afrique de l'Ouest. Clés de détermination des sous-familles, des tribus et des genres. Archives Scientifiques du Centre de Recherches Océanologiques d'Abidjan. 2000;17:1-31.
- Carvalho S, Barata M, Pereira F, et al. Distribution patterns of macrobenthic species in relation to organic enrichment within aquaculture earthern ponds. Marine Polluion Bulletin. 2006;52:1573-1584.
- Mazzola A, Mirto S, La Rosa T, et al. Fishfarming effects on benthic community structure incoastal sediments: analysis of meiofaunal recovery. Journal of Marine Science. 2000;57:1454-1461.