
Research article · 2023 · Full text
International Journal of Statistics and Applied MathematicsDesign of multiple deferred state sampling inspection plan for variables
Volume 8(1) · Pages 124–129 · DOI: 10.22271/maths.2023.v8.i1b.936 ↗
Research areasAdvanced Statistical Process Monitoring
Abstract
Author-writtenThe statistical product control, also termed as, acceptance sampling, extensively used in enterprises to reach a decision on ruling of lots of manufactured products, is a definite plan that states the sampling rules to be used and the standards for acceptance or dismissal of lots submitted for inspection. In acceptance sampling, the largely used practice to minimize the testing time and cost of inspection of manufactured units is the variable sampling inspection plan, in which the sentencing of a lot of individual items is based on metrical data. One of the special purpose sampling plans, multiple deferred state sampling plan for attributes reviews the quality of current lot as well as forthcoming lots for settlement of a lot. This paper proposes a technique for designing a multiple deferred state sampling plan for variables with the quality characteristics of product following normal distribution. The optimized parameters of the proposed plan are assessed by utilizing two points on the operating characteristic (OC) curve for specific requirement to ensure upon the producer and consumer conservation, when the standard deviation is known and unknown.
Summary
Source-checkedPlain-language reading of the full paper, prepared with AI and checked against the text. Each point links to the authors' own words.
Why it matters
- Acceptance sampling is a standard industrial practice used to decide whether to accept or reject lots of manufactured products based on specific sampling rules. View evidence ↗
- Variable sampling inspection plans are used to reduce inspection costs and time by basing decisions on metrical data rather than simple attributes. View evidence ↗
- Variable plans are more efficient than attribute plans because they provide more information and can achieve similar protection levels with smaller sample sizes. View evidence ↗
The question
- The authors identified a gap in existing literature regarding the design of multiple deferred state sampling (MDSS) plans for variables that follow a normal distribution. View evidence ↗
- The aim of the study is to design a variable MDSS inspection plan for products with normally distributed quality characteristics, following the framework of Wortham and Baker. View evidence ↗
What they did
- The proposed plan is defined by four parameters: sample size (n), the number of future lots for conditional acceptance (m), an unconditional acceptance constant (ka), and a conditional acceptance constant (kr). View evidence ↗
- Optimal parameters are determined using a search procedure based on two points of the operating characteristic (OC) curve: the acceptable quality level (AQL) and the limiting quality level (LQL). View evidence ↗
- The authors developed procedures to find plan parameters at specific risk levels and conducted a comparative study to evaluate efficiency. View evidence ↗
- The study constructed parameter tables for both known and unknown standard deviation (sigma) scenarios, using m values of 1, 2, and 3, with risks set at α=0.05 and β=0.10. View evidence ↗
What they found
- The proposed MDSS plan provides nearly the same level of protection for producers and consumers as single sampling and multiple dependent state plans, but requires smaller sample sizes. View evidence ↗
- The variable MDSS plan is more efficient than single sampling (SSP), double sampling (DSP), and multiple dependent state (MDS) plans in terms of the Average Sample Number (ASN). View evidence ↗
- For AQL=0.01 and LQL=0.04 with known sigma, the MDSS plan requires an ASN of 5, compared to 26 for single sampling, 21.4 for double sampling, and 16 for multiple dependent state sampling. View evidence ↗
- For AQL=0.01 and LQL=0.04 with unknown sigma, the MDSS plan requires an ASN of 16, compared to 78 for single sampling, 62.5 for double sampling, and 51 for multiple dependent state sampling. View evidence ↗
- Increasing the value of m (the number of future lots considered) makes the MDSS plan's operating characteristic curve closer to the ideal curve. View evidence ↗
What it means
- The authors conclude that the proposed MDSS plan for variables is effective for products with normally distributed quality characteristics because it reduces the average sample number. View evidence ↗
- The authors state that their plan maintains the same level of producer and consumer protection as existing plans while utilizing smaller sample sizes. View evidence ↗
Visual summary
3 visualsIllustrations explain the paper; charts are replotted from the paper's own table values.
MDSS Decision Logic
AI-generated conceptual illustration (Industrial manufactured metal components in shipping crates). It explains the idea and does not show study data.
View source evidence ↗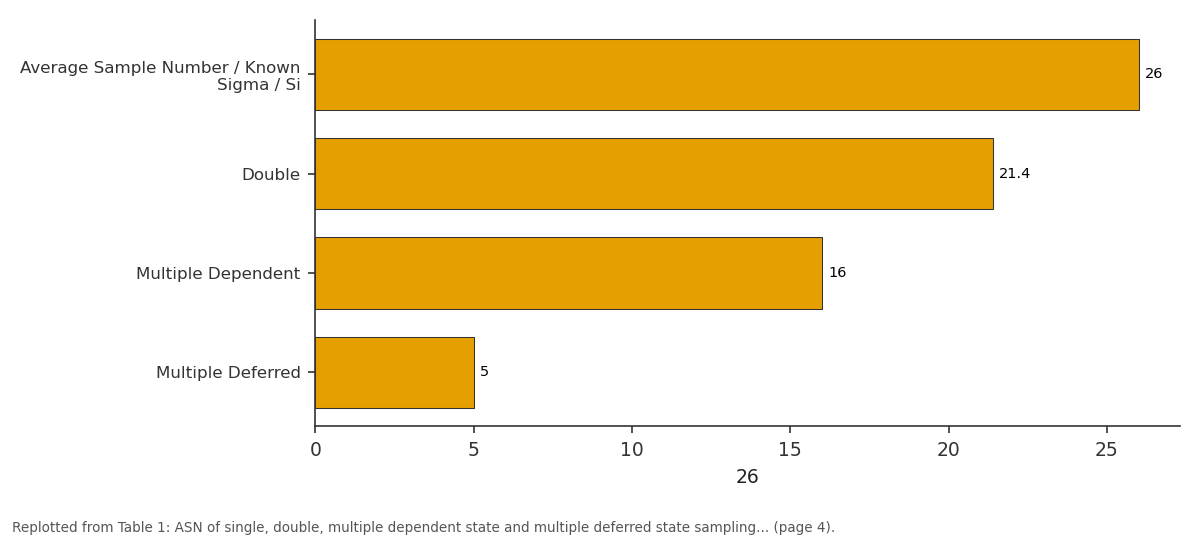
26: Average Sample Number /... vs Double vs Multiple Dependent vs Multiple Deferred
Replotted from Table 1 (page 4) of the original paper. Every bar is the paper's own table value.
View source evidence ↗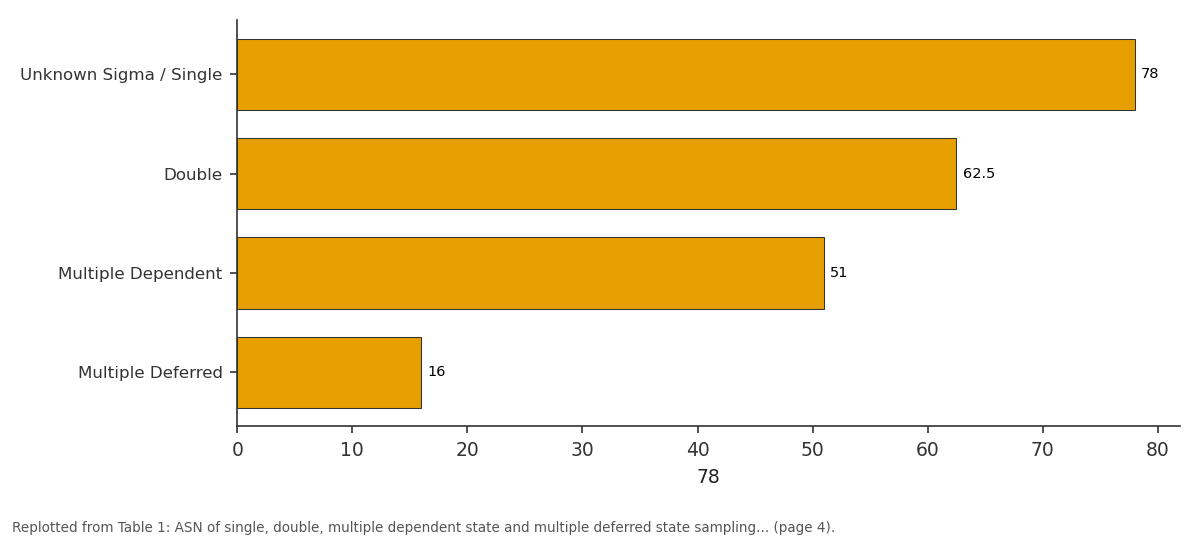
78: Unknown Sigma / Single vs Double vs Multiple Dependent vs Multiple Deferred
Replotted from Table 1 (page 4) of the original paper. Every bar is the paper's own table value.
View source evidence ↗Figures & tables
From the original paper Table 1
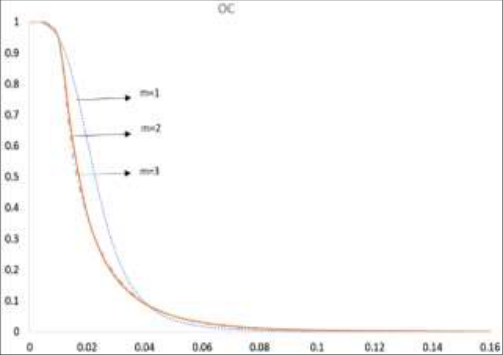 Figure 1
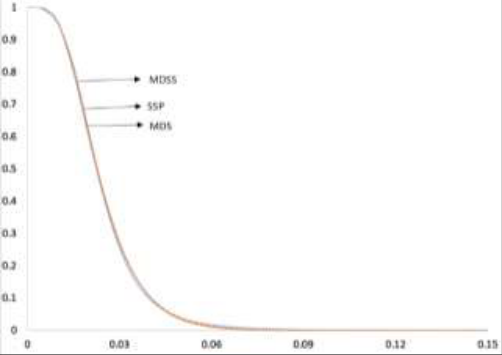 Figure 2
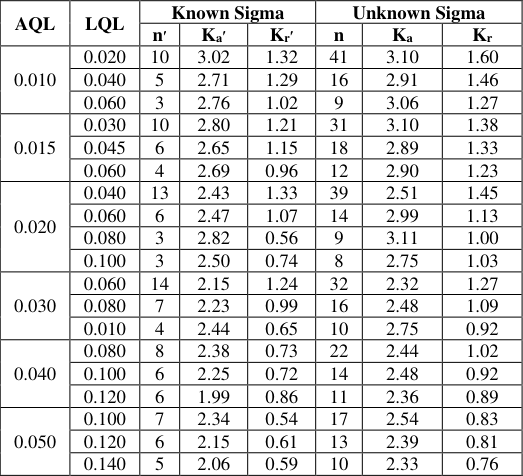 Table 2
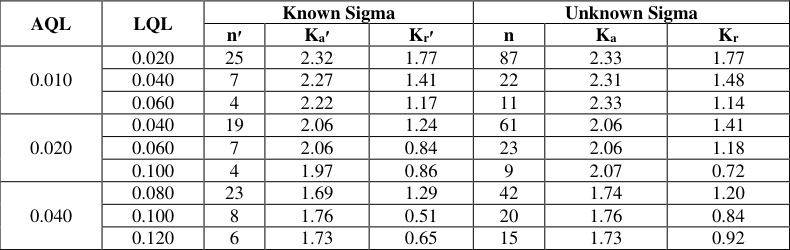 Table 3
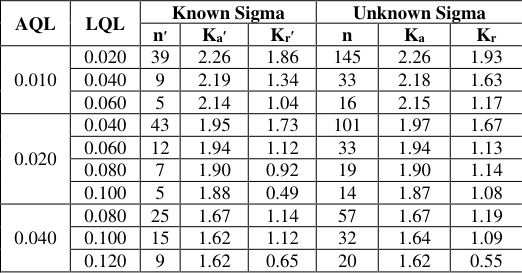 Table 4
Introduction
At present circumstances, the quality of manufactured materials or services plays significant role in attracting the attention of a customer. The quality of finished goods are ensured either by a 100% inspection or by a sampling inspection. When the items/units in submitted lots are destructive in nature or inspection procedure is costly or time consuming, a sampling inspection is typically employed. The decision on acceptance or non -acceptance of submitted lots are made, usually based on relevant sampling inspection procedures called sampling plans. In sampling inspection plans either attribute or variable quality characteristics can be tested. In sampling inspection by variables, samples are drawn from the lots submitted for inspection and the measurement on requisite quality characteristics of products are recorded. These measurements are compared with pre-fixed specification limits, to get to a decision on acceptance, rejection, or resampling. The sampling inspection plans by variables are more efficient, since they provide more information regarding sampled units and moreover the same operating characteristic (OC) curve as that of attribute sampling plans can be obtained with a comparatively smaller sample sizes (Montgomery, Bowker and Goode) [6,1] . In literature, the variable sampling inspection plans has been designed by many researchers. A few of them are Schilling [10] , Lieberman and Resnikoff [11] , Owen [4,5] , Hamaker [13] , Bravo and Wetherill [17] , Baillie [7] . The conditional sampling inspection plans is one of the special purpose sampling plans, which utilizes the knowledge from the neighbouring lots together with the present lots to get to a decision on accepting or discarding the lot. Dependent state and chain sampling plans uses the information from past lots along with the ongoing lots to attain a decision, whereas the deferred state sampling inspection plans uses the knowledge from upcoming lots as well as the current lot for judgement. Wortham and Baker in 1976 [3] extended the idea of fixed deferred state sampling plan to a multiple deferred state sampling plan for attributes.
Wortham and Baker proposed the multiple deferred state sampling plans which are applicable when the lots are submitted serially in the order of their production, the sample size from lots are assumed to be fixed and the inspection is by attributes with fraction defective from a binomial distribution. Soundararajan and Vijayaraghavan [25] Govindaraju and Subramani [14] , developed multiple deferred state sampling plans for attributes with fixed parameters, following the operating procedures and characteristics developed by Wortham and Baker. Further, the plan was investigated by Vaerst [18] in 1982 to make it on a par with the chain sampling plan (ChSP-1). Vaerst has modified the operating procedures and characteristic function of the existing multiple deferred state sampling plan and the research works that has been carried out regarding in the literature are: Soundararajan and Vijayaraghavan [25] , Subramani and Haridoss [15] , Balamurali and Kalyanasundaram [19] , Senthilkumar, Lokanayaki and Esha Raffie [9] , Balamurali, Jeyadurga and Usha [21,22,23] , Latha and Palanisamy [16] , Srinivasa Rao, Rosaiah and Ramesh Naidu [12] . While examining the literature, no attempts have been made in designing a multiple deferred state sampling inspection plans for variables using normal distribution under the assumption of Wortham and Baker. This paper proposes the designing of a multiple deferred state sampling (MDSS) inspection plan for variables, whose quality characteristics following normal distribution, with the operating procedures and characteristics according as Wortham and Baker. The procedures for obtaining the proposed plan parameters at specific risks are also developed. A comparative study has been carried out.
Variable Multiple Deferred State Sampling (MDSS) Plan 2.1 Basic Assumptions for Implementation of Proposed Plan
The basic assumptions for execution of proposed plan are as follows:
1. The production is steady so that the results of current lots and future lots are highly indicative of a continuing process. 2. Lots are submitted substantially in the order of production. 3. The operating characteristics (OC) curves are determined for inspection by variables with stable quality between lots. 4. The characteristics under consideration follows normal distribution.
Operating Procedures
Assume that the quality characteristics under study be normally distributed with mean µ and unknown standard deviation σ, and with an upper specification limit, U, specified. , S 2 is an unbiased estimate of σ 2 .
3. The current lot is accepted for 𝑣 ≥ 𝑘 𝑎 . , the current lot is discarded for 𝑣 < 𝑘 𝑟 . The decision on current lot is delayed up to subsequent 𝑚 lots for 𝑘 𝑟 ≤ 𝑣 < 𝑘 𝑎 and the lot is accepted if all the 𝑚 lots are accepted. Reject the lot on non-acceptance of any of the 𝑚 lots.
Thus the proposed variable MDSS inspection plan is described by four parameters, namely, 𝑛the sample size; 𝑚 the number of upcoming lots for conditional acceptance; 𝑘 𝑎 the unconditional acceptance constant; 𝑘 𝑟the conditional acceptance constant.
The optimum parametric values of the proposed plan are achieved by selecting two points on operating characteristic curve, namely, (𝐴𝑄𝐿, 1 -𝛼) and (𝐿𝑄𝐿, 𝛽) employing a search procedure; where 𝐴𝑄𝐿 (𝑜𝑟 𝑝1) is the acceptable quality level, and 𝐿𝑄𝐿 (𝑜𝑟 𝑝2) is the limiting quality level respectively associated with the producer's risk, 𝛼 and the consumer's risk, 𝛽.
Whenever the lower specification limit, L is stated the proposed variable MDS plan operates as same as above, apart from step 2. The corresponding statistic in step 2 will be changed as
Operating Characteristic function
The prominent aid for judging the performance of a variable sampling plan is operating characteristic (OC) function, a function of incoming lot quality, p. It gives the lot acceptance probability P a (p). The OC curve is drawn by plotting P a (p) against p. For a preassigned upper specification limit, U the proportion non-conforming is expressed as,
Where Φ(. ) is the cumulative distribution function of standard normal random variable. Thus the fraction nonconforming p and unknown mean µ are related through (1).
The operating characteristic function of unknown sigma variable MDSS plan is attained through asymptotic normality of 𝑥̅ ± 𝑘 𝑎 𝑆.
According to Duncan (1986) [2] , 𝑥̅ ± 𝑘 𝑎 𝑆 is asymptotically normally distributed with mean 𝜇 ± 𝑘 𝑎 𝜎 and variance
i.e., 𝑥̅ + 𝑘 𝑎 𝑆 ~ 𝑁 (𝜇 + 𝑘 𝑎 𝜎,
Following Wortham and Baker (1976), the operating characteristic function of the proposed variable MDSS inspection plan is as follows:
Where 𝑃{𝑣 ≥ 𝑘 𝑎 |𝑝} is the unconditional probability of accepting a lot based on current sample and 𝑃{𝑘 𝑟 ≤ 𝑣 < 𝑘 𝑎 |𝑝} is the conditional probability that the decision on current lot will be deferred until the decision of 𝑚 future lots.
The probabilities in RHS of (2) can be rewritten as
Where, 𝑤 1 = ( Where 𝑃 𝑎 (𝑝 1 ) and 𝑃 𝑎 (𝑝 2 ) are respectively the probability of acceptance of lot at AQL and LQL and is given in equations ( 6) and ( 7) respectively.
Variable MDSS Plan for Known Standard Deviation 3.1 Operating Procedure
Suppose that the quality characteristic of interest be normally distributed with mean µ and standard deviation σ. Let U be the specific upper specification limit. The proposed variable MDS sampling inspection plan performs as follows:
1. Take a random sample of n ׳ items, say (X 1, X 2 …X n ׳ ), from each lot set forth for inspection. 3. If 𝑣 ≥ 𝑘 𝑎 ′ , the current lot is accepted, if 𝑣 < 𝑘 𝑟 ′ , the current lot is not accepted. If 𝑘 𝑟 ′ ≤ 𝑣 < 𝑘 𝑟 ′ , the decision on the current lot is deferred until observing subsequent 𝑚 ′ lots and the lot is accepted if the subsequent 𝑚 ′ lots are all accepted. Reject the lot on non-acceptance of any of the 𝑚 ′ lots.
Thus the proposed variable MDSS inspection plan is defined by four parameters(𝑛,׳ ,׳𝑚 𝑘 𝑎 ′ , 𝑘 𝑟 ′ ). A two point approach on OC curve, employing a search procedure is utilized to get the optimum plan parameters.
Operating Characteristic Function
For a specific upper specification limit U, the proportion nonconforming is expressed as,
Where Φ(.) is the cumulative distribution function of standard normal random variable.
The OC function of proposed variable MDSS plan for known standard deviation is given by:
The lot acceptance probability can be rewritten as
Where 𝑦 1 = (𝑍 𝑝 -𝑘 𝑎 ′ )√𝑛 ′ (12)
Designing of Known Sigma Variable MDSS Plan
For given AQL and LQL values the plan parameters are enumerated by guaranteeing requisite conservation for producer and consumer. That is the required parameters shall simultaneously satisfy
Where, 𝑦 11 = the value of 𝑦 1 at p = AQL (or p 1 ), 𝑦 21 = the value of 𝑦 2 at p = AQL 𝑦 12 = the value of 𝑦 1 at p = LQL (or p 2 ), 𝑦 22 = the value of 𝑦 2 at p = LQL As in the case of unknown sigma plan, the plan variables for this case are obtained as follows.
For pre-assigned values of 𝑚 ′ , (𝐴𝑄𝐿, 1 -𝛼) and (𝐿𝑄𝐿, 𝛽)
Where 𝑃 𝑎 (𝑝 1 ) and 𝑃 𝑎 (𝑝 2 ) are respectively the probability of acceptance of lot at AQL and LQL and is given in equations ( 14) and ( 15) respectively. Tables are constructed for unknown and known sigma variable MDSS plan at 𝑚 )׳𝑚( =1, 2 and 3 indexed by various AQL and LQL values with associated risks, α=0.05 and β=0.10
In particular, when 𝑚 = 0 (𝑜𝑟 ׳𝑚 = 0) the proposed variable MDSS plan becomes usual variable sampling plan with parameters 𝑛 and 𝑘 𝑟 (or ׳𝑛 and 𝑘 𝑟 ′ ). Also when 𝑘 𝑎 = 𝑘 𝑟 (𝑜𝑟 𝑘 𝑎 ′ = 𝑘 𝑟 ′ ), the proposed plan reduces to conventional variable single sampling plan with parameters 𝑛 and 𝑘 𝑎 (or ׳𝑛 and 𝑘 𝑎 ′ ).
Comparative Study
This part investigates the efficiency of recommended MDSS plans for variables. The proposed plan is compared to variable single sampling plan (SSP) and double sampling plan for variables (DSP) of Sommers (1981) [8] and multiple dependent state (MDS) sampling plan for variables developed by Balamurali et al. [20] and is perceived to be more efficient concerning smaller sample sizes together with producer and consumer conservation. The acceptance sampling plans are said to be analogous if they provide nearly alike OC curves.
Hence OC curves has been drawn for the referred variable sampling plans. Besides tables are prepared and are presented for easy comparison of the average sample numbers.
In particular, for specified values of 𝐴𝑄𝐿 = 1%, 𝛼 = 5%, 𝐿𝑄𝐿 = 4% 𝑎𝑛𝑑 𝛽 = 10%, one can notice that The performance of the proposed MDS sampling variable plans are measured by drawing the OC curves for the plan at different 𝑚 ′ values. It can be observed that the MDS plan having large value of 𝑚 ′ appears to be nearer to ideal OC curve. The value of 𝑚 ′ is chosen by considering sample size and its OC curve. Now one can realize that for the same (𝐴𝑄𝐿, 1 -𝛼) and (𝐿𝑄𝐿, 𝛽), the optimum parameters of single sampling plan for variables (seen in Sommers,1981) and variable multiple dependent state sampling plan (MDS)(from Balamurali. et al., 2007) are:
𝑛 ′ = 16, 𝑘 𝑎 ′ = 2.12, 𝑘 𝑟 ′ = 1.72; when 𝑚 ′ = 1;
In this instance, it is noticed that the proposed variable MDSS plan (𝑛 ′ = 5, 𝑘 𝑎 ′ = 2.71, 𝑘 𝑟 ′ = 1.29; when 𝑚 ′ = 1) is having comparably smaller sample size than single variable sampling plan and multiple dependent state variable sampling plan. Also the OC curves for variable MDSS plan (at 𝑚 ′ = 1), single sampling plan for variables (SSP) and multiple dependent state (MDS) sampling plans are drawn for comparison. It is clear from the OC curve that the proposed MDSS plan for variables provides almost same protection to producer and consumer as that of variable single sampling plan and multiple dependent state sampling plan for variables, with a comparatively small sample size. Thereafter, we compare the ASN (Average Sample Number) of the proposed variable MDSS plan with variable single sampling plan (SSP), variable double sampling plan (DSP), and variable multiple dependent state (MDS) sampling plan. Generally a sampling plan having smaller ASN would be preferred. Table :1 have been constructed for comparing the ASN of the proposed variable MDSS plan when 𝑚 ′ = 1 (or m=1), variable SSP and DSP (Sommers, 1981) and variable MDS plan (Balamurali. Et al., 2007). It is observed that variable MDSS plan is efficient than SSP, DSP and MDS sampling plans for variables concerning ASN.
An Illustrative Example
The application of proposed Variable MDSS plan is illustrated using the following example. Suppose that the manufacturer demands the probability of accepting the product should be exceeding 95%, if the fraction nonconforming is less than 0.01. On the contrary, the consumer requisite the probability of accepting the product should not be more than 90%, if the fraction non-conforming is larger than 0.04. Hence for this case, when sigma is unknown and at m=2, the optimum plan parameters can be found from the
Figures and tables from the paper
| AQL | LQL | Average Sample Number | — | — | — | — | — | — | — |
|---|---|---|---|---|---|---|---|---|---|
| Known Sigma | Unknown Sigma | ||||||||
| Single | Double | Multiple Dependent | Multiple Deferred | Single | Double | Multiple Dependent | Multiple Deferred | ||
| 0.01 | 0.04 | 26 | 21.4 | 16 | 5 | 78 | 62.5 | 51 | 16 |
| 0.015 | 0.06 | 23 | 18.6 | 14 | 4 | 61 | 48.3 | 40 | 12 |
| 0.02 | 0.08 | 21 | 16.9 | 13 | 3 | 50 | 39.6 | 33 | 9 |
| 0.03 | 0.12 | 18 | 14.2 | 11 | 4 | 37 | 29.6 | 24 | 9 |
| 0.05 | 0.20 | 14 | 10.9 | 9 | 4 | 23 | 18.6 | 16 | 7 |
Table text extracted from the original PDF; superscript letters are shown inline. The original table image is below.
View original table image
| AQL | LQL | Known Sigma | — | — | Unknown Sigma | — | — |
|---|---|---|---|---|---|---|---|
| n׳ | Ka׳ | Kr׳ | n | Ka | Kr | ||
| 0.010 | 0.020 | 10 | 3.02 | 1.32 | 41 | 3.10 | 1.60 |
| 0.040 | 5 | 2.71 | 1.29 | 16 | 2.91 | 1.46 | |
| 0.060 | 3 | 2.76 | 1.02 | 9 | 3.06 | 1.27 | |
| 0.015 | 0.030 | 10 | 2.80 | 1.21 | 31 | 3.10 | 1.38 |
| 0.045 | 6 | 2.65 | 1.15 | 18 | 2.89 | 1.33 | |
| 0.060 | 4 | 2.69 | 0.96 | 12 | 2.90 | 1.23 | |
| 0.020 | 0.040 | 13 | 2.43 | 1.33 | 39 | 2.51 | 1.45 |
| 0.060 | 6 | 2.47 | 1.07 | 14 | 2.99 | 1.13 | |
| 0.080 | 3 | 2.82 | 0.56 | 9 | 3.11 | 1.00 | |
| 0.100 | 3 | 2.50 | 0.74 | 8 | 2.75 | 1.03 | |
| 0.030 | 0.060 | 14 | 2.15 | 1.24 | 32 | 2.32 | 1.27 |
| 0.080 | 7 | 2.23 | 0.99 | 16 | 2.48 | 1.09 | |
| 0.010 | 4 | 2.44 | 0.65 | 10 | 2.75 | 0.92 | |
| 0.040 | 0.080 | 8 | 2.38 | 0.73 | 22 | 2.44 | 1.02 |
| 0.100 | 6 | 2.25 | 0.72 | 14 | 2.48 | 0.92 | |
| 0.120 | 6 | 1.99 | 0.86 | 11 | 2.36 | 0.89 | |
| 0.050 | 0.100 | 7 | 2.34 | 0.54 | 17 | 2.54 | 0.83 |
| 0.120 | 6 | 2.15 | 0.61 | 13 | 2.39 | 0.81 | |
| 0.140 | 5 | 2.06 | 0.59 | 10 | 2.33 | 0.76 |
Table text extracted from the original PDF; superscript letters are shown inline. The original table image is below.
View original table image
| AQL | LQL | Known Sigma | — | — | Unknown Sigma | — | — |
|---|---|---|---|---|---|---|---|
| n׳ | Ka׳ | Kr׳ | n | Ka | Kr | ||
| 0.010 | 0.020 | 25 | 2.32 | 1.77 | 87 | 2.33 | 1.77 |
| 0.040 | 7 | 2.27 | 1.41 | 22 | 2.31 | 1.48 | |
| 0.060 | 4 | 2.22 | 1.17 | 11 | 2.33 | 1.14 | |
| 0.020 | 0.040 | 19 | 2.06 | 1.24 | 61 | 2.06 | 1.41 |
| 0.060 | 7 | 2.06 | 0.84 | 23 | 2.06 | 1.18 | |
| 0.100 | 4 | 1.97 | 0.86 | 9 | 2.07 | 0.72 | |
| 0.040 | 0.080 | 23 | 1.69 | 1.29 | 42 | 1.74 | 1.20 |
| 0.100 | 8 | 1.76 | 0.51 | 20 | 1.76 | 0.84 | |
| 0.120 | 6 | 1.73 | 0.65 | 15 | 1.73 | 0.92 |
Table text extracted from the original PDF; superscript letters are shown inline. The original table image is below.
View original table image
| AQL | LQL | Known Sigma | — | — | Unknown Sigma | — | — |
|---|---|---|---|---|---|---|---|
| n׳ | Ka׳ | Kr׳ | n | Ka | Kr | ||
| 0.010 | 0.020 | 39 | 2.26 | 1.86 | 145 | 2.26 | 1.93 |
| 0.040 | 9 | 2.19 | 1.34 | 33 | 2.18 | 1.63 | |
| 0.060 | 5 | 2.14 | 1.04 | 16 | 2.15 | 1.17 | |
| 0.020 | 0.040 | 43 | 1.95 | 1.73 | 101 | 1.97 | 1.67 |
| 0.060 | 12 | 1.94 | 1.12 | 33 | 1.94 | 1.13 | |
| 0.080 | 7 | 1.90 | 0.92 | 19 | 1.90 | 1.14 | |
| 0.100 | 5 | 1.88 | 0.49 | 14 | 1.87 | 1.08 | |
| 0.040 | 0.080 | 25 | 1.67 | 1.14 | 57 | 1.67 | 1.19 |
| 0.100 | 15 | 1.62 | 1.12 | 32 | 1.64 | 1.09 | |
| 0.120 | 9 | 1.62 | 0.65 | 20 | 1.62 | 0.55 |
Table text extracted from the original PDF; superscript letters are shown inline. The original table image is below.
View original table image
References
19 in the original paper- Wortham W, Baker RC. Multiple Deferred State Sampling Inspection, The International Journal of Production Research. 1976;14(6):719-731.
- Owen DB. One-sided variables sampling plans, Industrial Quality Control. 1966;22:450-456.
- Owen DB. Variables Sampling Plans based on Normal Distribution, Technometrics. 1967;9(3):417-423.
- Baillie DH. Double Sampling Plans for Inspection by Variables When the Process Standard Deviation is Unknown, International Journal of Quality and Reliability Management. 1992;9(5):59-70.
- Dan Sommers J. Double Variables Sampling Plans, Journal of Quality Technology. 1981;13(1):25-30.
- Senthilkumar D, Lokanayaki K, Esha Raffie B. Construction and selection of Multiple Deferred State (MDS-1) Variables Sampling Plans Involving Minimum Sum of Risks, International Journal of Innovative Research in Science, Engineering and Technology. 2014;3:7.
- Lieberman GJ. Resnikoff. Sampling Plans for Inspection by Variables, Journal of American Statistical Association. 1955;50(270):457-516.
- Srinivasa Rao G, Rosaiah K, Ramesh Naidu CH. Design of multiple deferred state sampling plans for exponentiated half-logistic distribution, cogent mathematics and statistics. 2020;7(1):1857915.
- Hamaker HC. Acceptance Sampling for Percent Defective by Variables and by Attributes, Journal of Quality Technology. 1979;11(3):139-148.
- Govindaraju K, Subramani K. Selection of Multiple Deferred (Dependent) State sampling plan for given acceptable quality level and limiting quality level involving Minimum Risks, Journal of Applied Statistics. 1993;20:3.
- Latha M, Palanisamy A. Selection of Multiple Deferred Sampling (0, 1) Plan with zero inflated Poisson distribution based on quality region, International Journal of Statistics and Applied Mathematics. 2019;4(2):10-15, ISSN: 2456-1452
- Bravo PC, Wetherill GB. The Matching Sampling Plans and the Design of Double Sampling Plans, Journal of the Royal Statistical Society A (General). 1980;143(1):49-67.
- Vaerst R. A Procedure to construct Multiple Deferred State Sampling Plan, Methods of Operations Research. 1982;37:477-485.
- Balamurali S, Kalyanasundaram M. Determination of Conditional Double Sampling Scheme, Journal of Applied Statistics. 1999;26(8):893-902.
- Balamurali S, Jun CH. Multiple Dependent State Sampling plans for lot acceptance based on measurement data. European Journal of Operational Research. 2007;180(3):1221-1230.
- Balamurali S, Jeyadurga P, Usha M. Designing of bayesian multiple deferred state sampling plan based on gamma-Poisson distribution, American Journal of Mathematical and Management Sciences. 2016;35(1):7790.
- Balamurali S, Jeyadurga P, Usha M. Designing of multiple deferred state sampling plans for generalized Inverted Exponential Distribution, Sequential Analysis. 2017;36(1):76-86.
- Soundararajan V, Vijayaraghavan R. On Designing Multiple Deferred State Sampling (MDS-1(0, 2)) Plans Involving Minimum Risks, Journal of Applied Statistics. 1989;16(1):87-94.
- Soundararajan V, Vijayaraghavan R. Construction and Selection of Multiple Deferred State Sampling Plan, Journal of Applied Statistics. 1990;17(3):397-409.
Cited by 7
From OpenAlex, OpenCitations and reference lists read by Scinovex
- Designing of multiple dependent state sampling plan for Exponentiated Frechet Distribution ↗
Gadde Srinivasa Rao, Sd. Jilani, Peter Josephat Kirigiti · Research in Statistics · 2025
An approach for making decisions regarding the lot being inspected is acceptance sampling. A decision regarding the entire lot under inspection is made based on a representative sample. The majority of current strategies take consumer risk into account while ignoring producer loss. In order to satisfy both parties, this study will take into account the risks posed by both producers…
❝ 1PDF - Optimal construction of multiple deferred state sampling schemes under process variability conditions ↗
Eduardo Mendes · International journal of applied research · 2026
Acceptance sampling constitutes a fundamental tool in statistical quality control for deciding lot disposition based on sample information. The multiple deferred state sampling (MDSS) plan extends conventional single sampling by incorporating quality information from successive lots into the current lot decision. This research presents an optimal construction methodology for the variable MDSS plan under varying process variability conditions when the
- Performance assessment of deferred state variable sampling strategies for industrial quality management ↗
Kim Soo-jin · International Journal of Research in Finance and Management · 2026
Quality management in industrial production requires efficient inspection mechanisms that balance the cost of sampling against the risk of incorrect lot disposition. The multiple deferred state sampling (MDSS) plan for variables offers a promising framework for reducing inspection effort by leveraging quality information from consecutive lots. This research evaluated the performance of the variable MDSS plan against six established sampling
- A comparative framework for multiple deferred state acceptance sampling with measurable quality characteristics ↗
Emre Yılmaz, Ayşe Kaya · Asian Journal of Management and Commerce · 2026
Acceptance sampling by variables offers superior inspection efficiency compared to attribute-based approaches when the quality characteristic is measurable on a continuous scale. Among the conditional sampling procedures, the multiple deferred state sampling (MDSS) plan has emerged as an attractive alternative owing to its ability to reduce required sample sizes by utilizing information from adjacent lots. Despite this potential, comprehensive comparisons
- Using machine learning to optimize cylinder block availability in a cast iron manufacturing plant ↗
Jyoti ., Bhawana . · International Journal of Cloud Computing and Database Management · 2025
A chamber block in a cast iron facility has been under consideration for accessibility and efficiency in the ongoing development. The current paper aims to improve structure accessibility by advancing information aspects of the chamber block in the cast iron plant. Project Iron Plant primarily consists of five subsystems that are connected in series. Each subsystem's repair and disappointment rates
- Ergodic and time-dependent behavior of the steel manufacture plants constrained cost reliability ↗
Ritu Rani, Bhawana . · International Journal of Advanced Academic Studies · 2024
One of the most widely used and effective optimization techniques in literature to address real-world optimization is the nature-inspired algorithm. Here, PSO is expanded to address cost constraints. The problem of steel manufacture plants reliability optimization. PSO is used to determine the quantity of redundant components in the plant and the optimal reliability of steel manufacture plants given cost constraints.
- Construction of acceptance sampling plans for the quartile ranked set sampling using Laplace distribution ↗
PK Deveka, K Saranya · Journal of Mathematical Problems Equations and Statistics · 2023
The ranked set sampling method has been made more inclusive in this paper. In order to estimate the quartile ranked set sampling of the Laplace distribution, the generalized ranked set sampling technique is used. Two key factors are taken into account for the new course of action: the data are selected using the Quartile Ranked Set inspecting plan from a
❝ 0Found by Scinovex