
Research article · 2022 · Full text
International Journal of Horticulture and Food ScienceStudy of stability of many genotypes of rosella under the influence of humic acids in two location
Volume 4(2) · Pages 199–202 · DOI: 10.33545/26631067.2022.v4.i2c.125 ↗
Research areasPlant Growth Enhancement TechniquesAgriculture and Biological StudiesAgricultural Productivity and Crop Improvement
Abstract
Author-writtenA field experiment was conducted in two locations, the first in Al-Mahaweel district (25 km north of Babil Governorate) and the second in Al-Saniyah district (15 km north of Al-Qadisiyah governorate) during the summer season 2021 with the aim of knowing the A field experiment was conducted in two locations, the first in Al-Mahaweel district (25 km north of Babil Governorate) and the second in Al-Saniyah district (15 km north of Al-Qadisiyah governorate) during the summer season 2021 with the aim of knowing the extent of the stability of genotypes of Gujarat under the influence of ground addition and foliar spraying of Humic. A factorial experiment was applied according to Randomized Complete Blocks Design (R.C.B.D). The study included three factors, the first factor included three genotypes of Rosella (red, white and lined) and the second factor was the addition of humic acid spraying at three levels (0, 5, 10) ml. L-1 And the third factor was the addition of ground humic acid in three concentrations (0, 5, 10) ml. L-1. It was divided into 18 environments (each site included 9 environments). The following characteristics were studied (total yield of sepals, number of nuts. plant-1, Number of seeds. nut-1, dry weight of sepals gm. plant-1, yield of seeds g. plant-1, weight of 1000 seeds) The results of the aggregate statistical analysis and genetic stability analysis showed that the mean of the squares of the genotypes (G) was significantly higher than the probability level (1%). For most of the traits under study, except for the number of seeds, nut-1, the results were not significant, and the regression coefficient was greater than the correct one for the planned genotype and for all traits, and this indicates that the planned cultivar responds to good environmental conditions.
Summary
Source-checkedPlain-language reading of the full paper, prepared with AI and checked against the text. Each point links to the authors' own words.
Why it matters
- Rosella (Hibiscus sabdariffa L.) is a medicinally significant plant, particularly valued for the glycoside Hibiscin found in its sepals. View evidence ↗
- Beyond medicine, Rosella is used industrially for natural food colorants and in the production of jams and candy, while its seeds provide significant oil (20-25%) and protein (30-35%). View evidence ↗
- Organic materials are used in agriculture to improve soil physical and chemical properties and encourage microorganisms, which increases nutrient availability for plants. View evidence ↗
The question
- The study aimed to determine the stability of different Rosella genotypes when treated with ground-applied and foliar-sprayed humic acid. View evidence ↗
What they did
- The field experiment took place during the summer of 2021 at two sites: Al-Mahaweel district in Babil Governorate and Al-Saniyah district in Al-Qadisiyah governorate. View evidence ↗
- The research used a factorial design with three factors: three genotypes (red, white, and lined), three levels of foliar humic acid spray (0, 5, 10 ml L-1), and three concentrations of ground humic acid (0, 5, 10 ml L-1). View evidence ↗
- The researchers measured six traits: total sepal yield, number of nuts per plant, number of seeds per nut, dry weight of sepals per plant, seed yield per plant, and the weight of 1000 seeds. View evidence ↗
- Stability analysis was performed using the Eberhart and Russel (1966) method to predict which cultivars are suitable across various environmental conditions. View evidence ↗
What they found
- The planned genotype showed a regression coefficient greater than one for all traits, meaning it responds positively to favorable environmental conditions. View evidence ↗
- Because the mean square deviation from the regression (S²di) was not significantly different from zero for any genotype across all traits, all tested genotypes are considered stable across different agricultural environments. View evidence ↗
What it means
- The authors conclude that the data on these genotypes can guide breeding programs to develop new Rosella varieties with high performance across diverse Iraqi environments. View evidence ↗
Visual summary
3 visualsIllustrations explain the paper; charts are replotted from the paper's own table values.
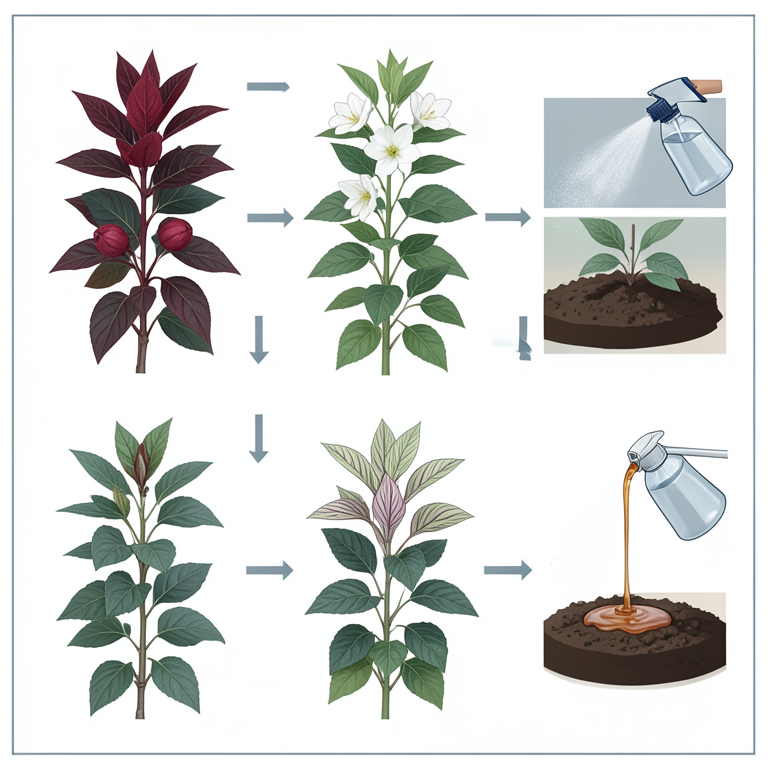
Experimental Factor Layout
AI-generated conceptual illustration (Roselle plants (Hibiscus sabdariffa)). It explains the idea and does not show study data.
View source evidence ↗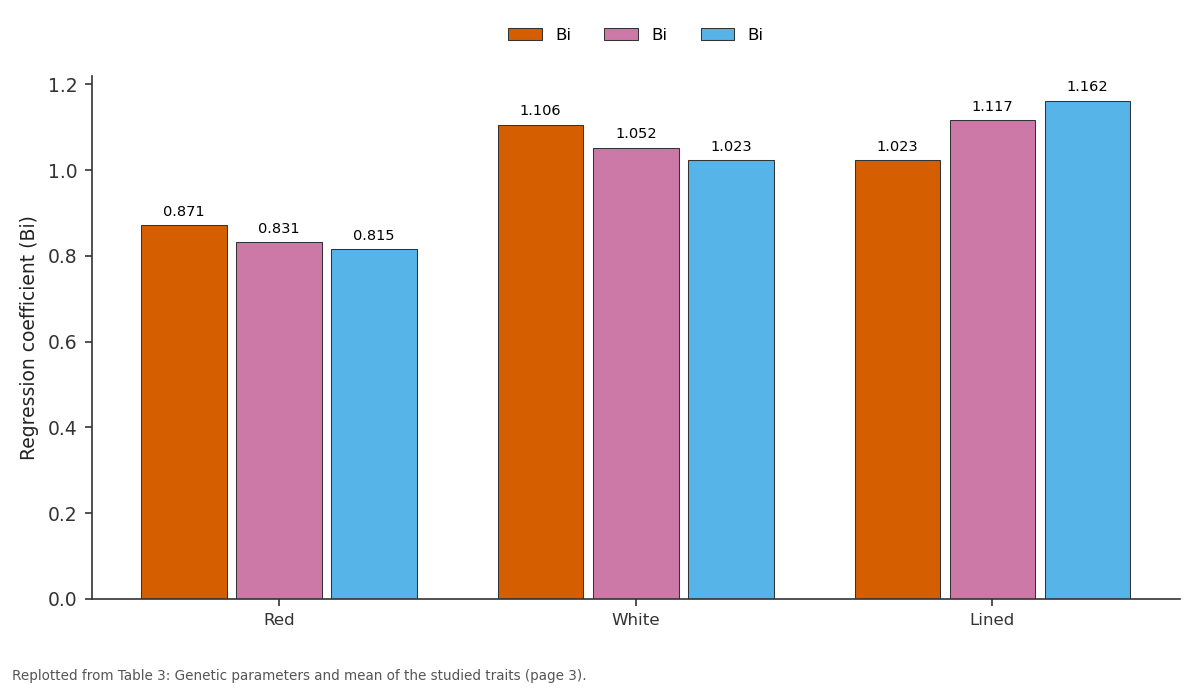
Bi and Bi and more: Red vs White vs Lined
Replotted from Table 3 (page 3) of the original paper. Every bar is the paper's own table value.
View source evidence ↗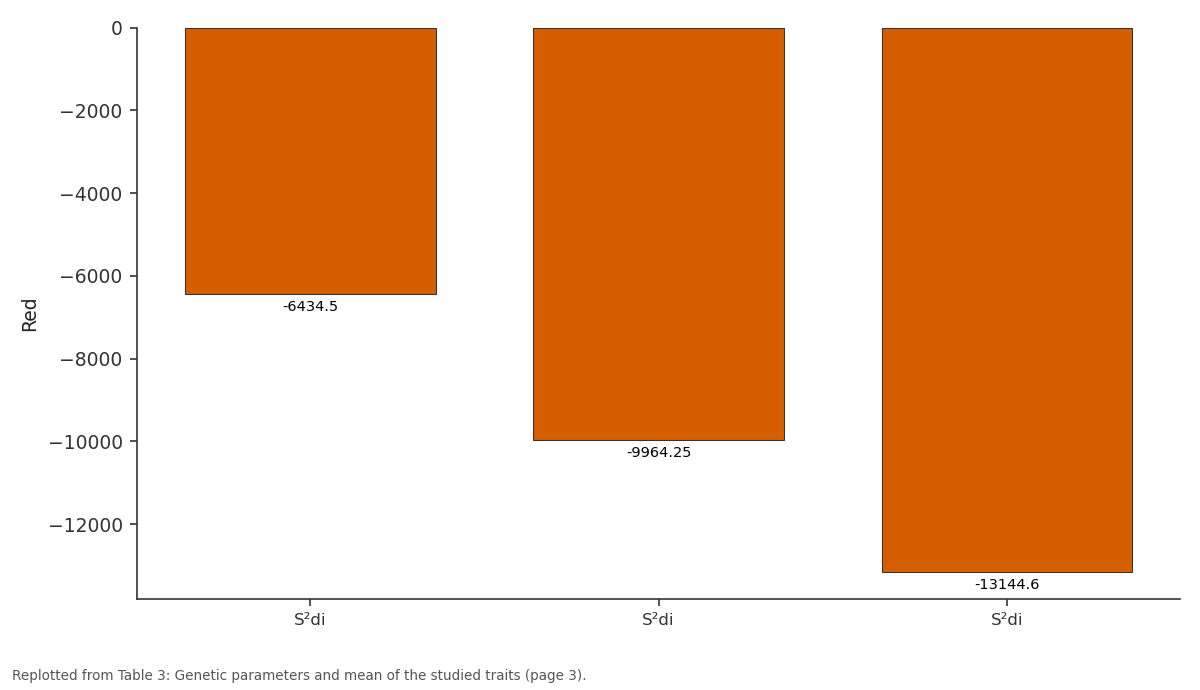
Red: S²di vs S²di vs S²di
Replotted from Table 3 (page 3) of the original paper. Every bar is the paper's own table value.
View source evidence ↗Figures & tables
From the original paper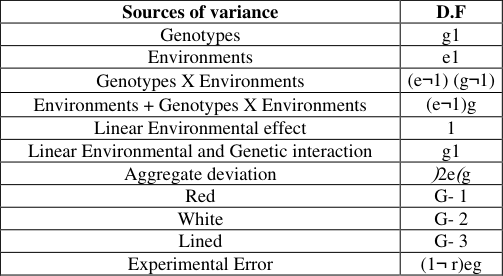 Table 1
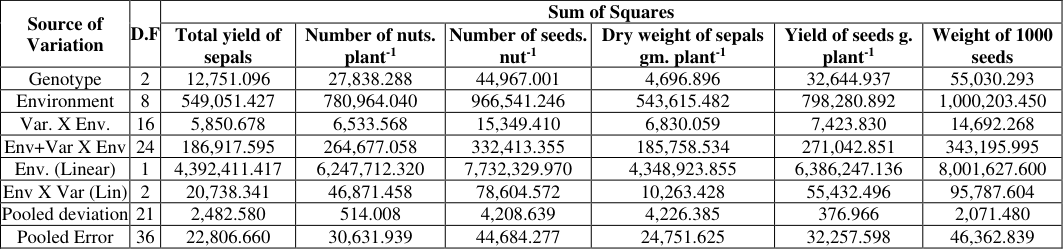 Table 2
 Table 3
 Table 4
Introduction
Hibiscuc sabdariffa L. is a medicinally important plant of the family Malvaceae [1] . The medical importance of Rosella is concentrated in its sepals leaves, which are a source of the glycoside Hibiscin, which is due to the medicinal effect. These leaves are also rich in vitamin C and malic, citric, and tartaric acids. They also contain Protocatehenic acid (PCA), which is an antioxidant compound as well as its effect in treating some cancerous tumors [2] . In addition to the food and industrial use, the Gujarat drink is used as a refreshing drink for the purpose of tempering high temperatures. Its red dyes are used industrially as natural food colorants to gain taste. It is also used in the manufacture of jams, jelly, candy, food preservation, and its seeds contain a high percentage of oil up to 20-25% plus 30-35% protein [3] . The only way to increase production is to expand the unit area through the improvement and development of various production resources, which requires the development of stable and high-yielding varieties and knowledge of genetic fluctuations and dependence on modern technology in crop cultivation and management is the main focus in most breeding programs, and the development of advanced varieties in the quantity and quality of production It is adaptable to local conditions and tolerant of varying environmental conditions, as understanding the environmental and genetic responses is essential to improve the efficiency of its production [4] . Due to the medical importance of this crop, it is necessary to diligent scientific work and by all available scientific means of modern techniques that contribute to increasing productivity in the unit area and laying the foundations to ensure the demand for its cultivation and its propagation by following modern scientific methods, including following agricultural operations in an accurate scientific manner such as fertilization operations by adding Organic materials being the most important modern agricultural processes that lead to an environment free from the risks of pollution associated with the use of chemical fertilizers that pose a direct and indirect threat to soil and human health, in addition to that organic materials help in the readiness of nutrients for absorption by the plant by improving soil qualities Physical and chemical activities and encouraging beneficial microorganisms to work, which in turn leads to the release of nutrients and increase their readiness for absorption, and then the increase of optically manufactured materials and the production of hormones and enzymes, which in turn help to build and accumulate effective medical materials [5] . Based on the foregoing, this study aimed to know the stability of genotypes of Rlosella under the influence of ground addition and foliar spraying of Humic.
Materials and working Methods
A field experiment was conducted in two locations, the first in Al-Mahaweel district (25 km north of Babil Governorate) and the second in Al-Saniyah district (15 km north of Al-Qadisiyah governorate) during the summer season 2021. The experimental land was plowed by two orthogonal plows, then it was smoothed and leveled, and then divided into three sectors, each replicate included 27 experimental units with an area (3x4) m 2 . Triple super phosphate in the form of 160 kg.ha -1 in one batch before planting, then adding 100 kg.ha -1 nitrogen fertilizer in the form of urea added in two batches, the first after thinning and the second before flowering [6] . The seeds were planted in April 15, 2020, where the seeds were planted in a hole in the upper third of the meadow, the distance between one hole and another is 50 cm, alternately on both sides of the meadow, with 3 seeds per hole, at a depth of 3-5 cm, then the field was given Irrigation of cultivation without immersion until germination is completed and when it reaches a height of (10-15) cm, the thinning and patching operations were carried out, after which the plants were watered as needed, with all crop service operations such as weeding, weeding and other control. The study included three factors, the first factor included three genotypes of Gujarat (red, white and lined), the second factor was the addition of spraying humic acid at three levels (0, 5, 10) ml. L -1 , and the third factor was the addition of ground humic acid in three concentrations (0., 5, 10) ml. L -1 . A factorial experiment was applied according to the Complete Randomized Blocks Design (R.C.B.D). The averages were compared according to the Least Significant Desgin (L.S.D) test at a probability level of 0.05 using the statistical program Genstat [7] . The following characteristics were studied (total yield of sepals, number of nuts. plant -1 , Number of seeds. nut -1 , dry weight of sepals gm. plant -1 , yield of seeds g. plant -1 , weight of 1000 seeds).
Genetic analysis stability
The method of Eberhart and Russel (1966) was used to study the stability in order to identify the possibility of predicting the cultivar suitable for all surrounding environmental conditions. The parameters of the stability of genotypes in different environments were estimated, namely:
The average effectiveness of the class for the studied trait. = Y The regression coefficient is evaluated on the basis of the response of the varieties to the surrounding agricultural environments. = Bi Non-linear variance (deviation from regression) and evaluation of the reliability of the items depending on it. =S²di And when the values are:
1-S²di = zero (the species respond to good environments). Bi > 1 2-S²di = zero (cultivars are less responsive to environmental changes and are highly stable). =Bi1 S²di = zero (cultivars grow well in unsuitable environments). Bi < 1 3-S²di > zero (weakens linear prediction). The mean squared cumulative deviation was used to test the significance of the interaction between heredity and environment, and its significant difference from zero was chosen by cumulative error [9] .
Results and Discussion
Table [2] shows the results of the genetic-environmental interaction variance analysis for the studied traits, and it is noted that the mean of the environments squares (E) was significant at the probability level (1%) for all the studied traits, and these high significant differences indicate the presence of matching differences between ground addition and foliar spraying of humic acid. The mean of the squares of the genotypes (G) was significant at the probability level (1%) for most of the traits under study except for the number of seeds. Nut -1 was not significant. It is clear from the moral differences between the genetic structures and their influence on the factors of the study that there is a clear discrepancy between them, which encourages the continuation of the study of their stability and genetic behavior and knowledge of the genetic act that controls the inheritance of these traits and may be due to their genetic differences and the nature of their differences In its origins, the yield of the interaction of genotypes × environments (G × E) was significant at the probability level (1%) for all studied traits. , as it becomes clear that the differences due to the genotypes were much greater than those related to each of the environments and the overlap of all traits, and those related to the environments were almost greater than it is to the interaction of the structures with the environments, which indicates the differential response of those structures that were significant across the test environments, although we We stabilized everyone to make sure it was needed or not, these results agreed with [10,11,12] . The confirmatory parameters shown in Table (3) and (4) were estimated, which are the average effectiveness of the genotypes for different traits in different agricultural environments, and the values of the regression coefficient (Bi) that determines the response of the genotypes, which is measured by a linear regression of the average genotype over the average of the structures in each environment. The mean deviation from the regression for each genotype is (S²di), and the (t) test is used to test the significance of each regression coefficient from the correct one. As for the S²di test, the average square error of each category is used on the aggregate error, and it is noted from the results that the regression coefficient was greater than the correct one for the planned genotype and for all traits, and this indicates that the planned variety responds to good environmental conditions, while the regression coefficient was less than zero for the other varieties in most Attributes and this weakens the linear prediction. It is also noted that there are no significant differences for the mean square deviation from the regression for each composition (S²di) from zero for all genotypes in all studied traits, and this means that all of these genotypes in these traits under study have stability for different agricultural environments, and this is commensurate with what was reached [11] , and these results are in line with the findings of [13,14,15] .
Conclusions
The information about the set of genotypes that were adopted in the study can be used in breeding programs to improve the characteristics of the crop and to develop new varieties with outstanding performance in a wide range of environmental conditions in Iraq.
Figures and tables from the paper
| Sources of variance | D.F |
|---|---|
| Genotypes | g1 |
| Environments | e1 |
| Genotypes X Environments | (e¬1) (g¬1) |
| Environments + Genotypes X Environments | (e¬1)g |
| Linear Environmental effect | 1 |
| Linear Environmental and Genetic interaction | g1 |
| Aggregate deviation | (2e)g |
| Red | G- 1 |
| White | G- 2 |
| Lined | G- 3 |
| Experimental Error | (1¬ r)eg |
Table text extracted from the original PDF; superscript letters are shown inline. The original table image is below.
View original table image
| Source of Variation | D.F | Sum of Squares | — | — | — | — | — |
|---|---|---|---|---|---|---|---|
| Total yield of sepals | Number of nuts. plant-1 | Number of seeds. nut-1 | Dry weight of sepals gm. plant-1 | Yield of seeds g. plant-1 | Weight of 1000 seeds | ||
| Genotype | 2 | 12,751.096 | 27,838.288 | 44,967.001 | 4,696.896 | 32,644.937 | 55,030.293 |
| Environment | 8 | 549,051.427 | 780,964.040 | 966,541.246 | 543,615.482 | 798,280.892 | 1,000,203.450 |
| Var. X Env. | 16 | 5,850.678 | 6,533.568 | 15,349.410 | 6,830.059 | 7,423.830 | 14,692.268 |
| Env+Var X Env | 24 | 186,917.595 | 264,677.058 | 332,413.355 | 185,758.534 | 271,042.851 | 343,195.995 |
| Env. (Linear) | 1 | 4,392,411.417 | 6,247,712.320 | 7,732,329.970 | 4,348,923.855 | 6,386,247.136 | 8,001,627.600 |
| Env X Var (Lin) | 2 | 20,738.341 | 46,871.458 | 78,604.572 | 10,263.428 | 55,432.496 | 95,787.604 |
| Pooled deviation | 21 | 2,482.580 | 514.008 | 4,208.639 | 4,226.385 | 376.966 | 2,071.480 |
| Pooled Error | 36 | 22,806.660 | 30,631.939 | 44,684.277 | 24,751.625 | 32,257.598 | 46,362.839 |
Table text extracted from the original PDF; superscript letters are shown inline. The original table image is below.
View original table image
| Genotypes | Total yield of sepals | — | — | — | Number of nuts. plant-1 | — | — | — | — | Number of seeds. nut-1 | — | — | — |
|---|---|---|---|---|---|---|---|---|---|---|---|---|---|
| Mean | Bi | S²di | sd | Mean | Bi | S²di | Sd | Mean | Bi | S²di | sd | ||
| Red | 270.296 | 0.871 | -6,434.500 | 0.006 | 311.470 | 0.831 | -9,964.251 | 0.001 | 340.935 | 0.815 | -13,144.604 | 0.005 | |
| White | 344.570 | 1.106 | -6,043.929 | 0.007 | 392.824 | 1.052 | -9,934.181 | 0.001 | 427.430 | 1.023 | -12,238.686 | 0.007 | |
| Lined | 318.058 | 1.023 | -2,880.493 | 0.023 | 417.840 | 1.117 | -9,191.4820.003 | -9,191.4820.003 | 481.022 | 1.162 | -6,675.071 | 0.022 | |
| SE = (Bi) | 0.041 | 0.016 | 0.040 |
Table text extracted from the original PDF; superscript letters are shown inline. The original table image is below.
View original table image
| Genotypes | Dry weight of sepals gm. plant-1 | — | — | — | Yield of seeds g. plant-1 | — | — | — | Weight of 1000 seeds | — | — | — |
|---|---|---|---|---|---|---|---|---|---|---|---|---|
| Mean | Bi | S²di | sd | Mean | Bi | S²di | sd | Mean | Bi | S²di | sd | |
| Red | 270.296 | 0.871 | -6,434.500 | 0.006 | 311.470 | 0.831 | -9,964.251 | 0.001 | 340.935 | 0.815 | -13,144.604 | 0.005 |
| White | 344.570 | 1.106 | -6,043.929 | 0.007 | 392.824 | 1.052 | -9,934.181 | 0.001 | 427.430 | 1.023 | -12,238.686 | 0.007 |
| Lined | 318.058 | 1.023 | -2,880.493 | 0.023 | 417.840 | 1.117 | -9,191.4820.003 | -9,191.4820.003 | 481.022 | 1.162 | -6,675.071 | 0.022 |
| SE = (Bi) | 0.041 | 0.016 | 0.040 |
Table text extracted from the original PDF; superscript letters are shown inline. The original table image is below.
View original table image
References
12 in the original paper- Abbas M, Ali AS. Effect of foliar application of NPK on some growth characters of two cultivars of roselle (Hibiscus sabdariffa L.). American Journal of Plant Physiology. 2011;6:220-227.
- Kılıç CS, Aslan S, Kartal M, Coskun M. Fatty acid composition of Hibiscustrionum L. (Malvaceae). Rec. Nat. Prod. 2011;5(1):65-69.
- Louis SJ, Kadams AM, Simon SY, Mohammed SG. Combining ability in Roselle cultivars for agronomic traits in Yola, Nigeria. Greener Journal of Agricultural Sciences. 2013;3(2):145-149.
- Bakry AB, Omar MI, Tarek AEE, Mohamed FE. Performance assessment of some flax (Linum usitatissimum L.) varieties using cluster analysis under sandy soil conditions. Agricultural Sciences. 2014;5:677-686.
- Eberhart SA, Russell WA. Stability parameters for comparing varieties. Crop Sci. 1966;6:36-40.
- Choudhary VK, Ram S, Singh SK, Chakraborty M, Kumar Arun, Ahmad E. Heterosis and inbreeding depression in linseed. Adv. Res. J. Crop Improv. 2016;7(1):171-175. CJAST, 31(4):1-12.
- El-Haleem A, Abd Al-Sadek MS, Abo-Kaied HMH. Genotype x environment interaction and stability analysis for yield and yield components in ten flax genotypes. Annals of Agric. Sci., Moshtohor. 2016;54(3):581-590.
- Yadav PC, Yadav RK, Vishwanath YP, Kumar S. Stability and correlation analysis for yield and its component traits in linseed (Linum usitatissimum L.). Journal of Pharmacogosy and Phytochemistry, 2017, 274-277.
- El-Hosary AA, Sedhom AS, Allam SAH, Abo-Kaied HMH, El-Hosary AAA, Ebied MA. Stability Analysis for some Flax Genotypes and Genotype X Environment interaction. Egypt. J. Plant Breed. 2016;20(4):577-592.
- Alnuaimi JJJ, Hassoon AS, Almyali AAH. Evaluation of the performance of four genotypes of Corn (Zea mays L.) and path coefficient analysis by Bacterial biofertilizers effects. Eco. Env. & Cons. 2019;26(1):262-270.
- Hassoon AS, Alnuaimi JJJ. The Effect of Biofertilization in Fatty Acids Content for Many Flax Varieties. In IOP Conference Series: Earth and Environmental Science. November 2021;910(1):012042. IOP Publishing.
- Hussain MH, Hassoon AS. Measurement of some medical substances in rosella plant (Hibiscus sabdariffa L.) extract using hplc technique under the influence of different treatments. Plant Archives. 2018;18(2):24692476.