
Research article · 2023 · Full text
International Journal of Horticulture and Food ScienceParticipatory tomato (Lycopersicon esculentum Mill) variety selection and evaluation for production in Eastern Amhara regional state
Volume 5(1) · Pages 35–40 · DOI: 10.33545/26631067.2023.v5.i1a.154 ↗
Research areasAgricultural Practices and Plant Genetics
Abstract
Author-writtenA field experiment was conducted at Kobo and Mersa under irrigation with the objectives of evaluating the adaptability and yield potential of different tomato varieties and asses’ farmers’ perception. The experiment was laid out in Randomized Complete Block Design (RCBD) with three replications and used six released tomato varieties. The result showed that there was variation on yield and yield components of tomato varieties. The highest number of fruit clusters per plant (15.7) and marketable yield (45.8 tha-1) was recorded from variety Oval red whereas highest fruit per plant (70.5) and fruit length (5.9 cm) was recorded from variety Mersa. From the six tested tomato varieties Oval red was first ranked by its yield advantage from other tomato varieties and its shape has good market value by farmers’ selection. Variety Mersa was selected by farmer’s due to its disease resistance (powdery mildew) and good market value. Therefore, Oval Red and Mersa tomato varieties were recommended for Mersa and Kobo areas under irrigation.
Summary
Source-checkedPlain-language reading of the full paper, prepared with AI and checked against the text. Each point links to the authors' own words.
Why it matters
- Tomato is one of the most widely consumed vegetables globally, ranking third in production volume and first in processing volume. View evidence ↗
- Tomato productivity in Ethiopia and the Amhara region (5.12 and 8.3 ton ha-1 respectively in 2018/19) is considered very low compared to other countries. View evidence ↗
- Despite high potential for vegetable production in Kobo and Mersa, farmers are limited by a lack of superior tomato varieties. View evidence ↗
The question
- The study aimed to evaluate the yield potential and adaptability of improved tomato varieties while ensuring they are acceptable to farmers through participatory selection. View evidence ↗
What they did
- The research was conducted under irrigation from December to April 2017 at a research field in Kobo and farmers' fields in Mersa. View evidence ↗
- Six open-pollinated tomato varieties were tested: Mersa, Cochoro, Miya, Bishola, Oval red, and ARP Td2. View evidence ↗
- The experiment used a Randomized Complete Block Design (RCBD) with three replications. View evidence ↗
- Researchers measured growth parameters, yield components (such as fruit length and diameter), disease severity, and farmer preferences. View evidence ↗
What they found
- Oval red was the best-performing variety for yield, with a combined mean marketable yield of 45.8 T-ha-1, compared to the lowest yield of 20.5 t ha-1 from variety Mersa. View evidence ↗
- Oval red produced the most fruit clusters per plant (15.7), while variety Mersa produced the fewest (8.1). View evidence ↗
- Variety Mersa had the highest number of fruits per plant (70.5), whereas ARP Td2 had the lowest (16.4). View evidence ↗
- Bishola had the largest fruit equatorial diameter (5.2 cm), while Mersa had the smallest (3 cm). View evidence ↗
- Variety Mersa showed the lowest powdery mildew disease severity (1.7-2.2%), while ARP Td2, Cochoro, and Miya showed the highest severity. View evidence ↗
- Farmers ranked Oval red first for yield, size, and appearance, but ranked Mersa first for disease resistance. View evidence ↗
- Based on pair-wise ranking, Mersa was the most preferred variety overall, followed by Oval Red. View evidence ↗
What it means
- The authors recommend promoting Oval Red and Mersa varieties for commercial irrigated production in Kobo and Mersa due to their yield and disease resistance. View evidence ↗
- The authors suggest that breeders should focus on crossing high-yielding varieties with disease-resistant ones. View evidence ↗
Visual summary
3 visualsIllustrations explain the paper; charts are replotted from the paper's own table values.
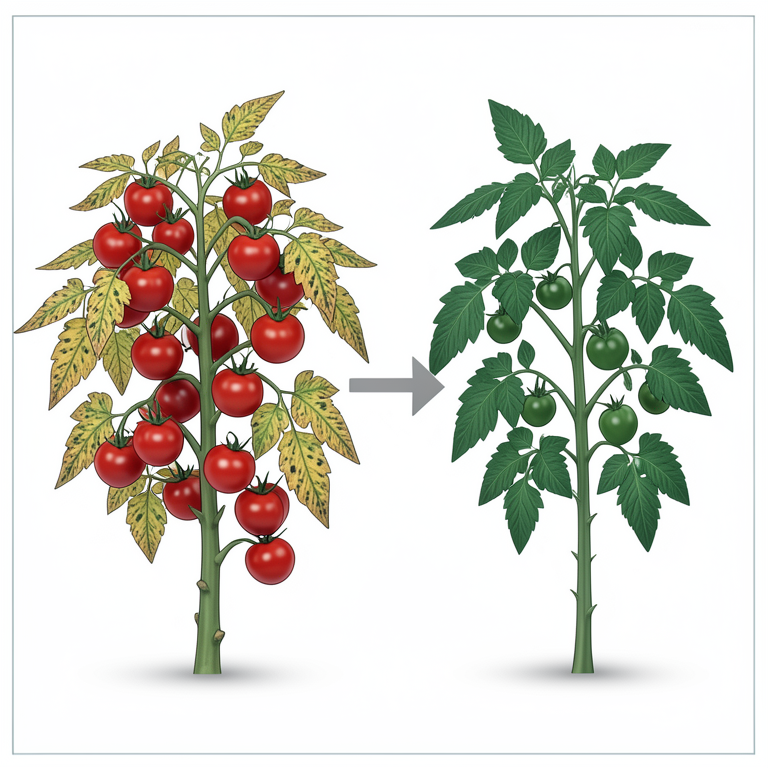
Trade-off between Yield and Resistance
AI-generated conceptual illustration (tomato plants (Lycopersicon esculentum Mill)). It explains the idea and does not show study data.
View source evidence ↗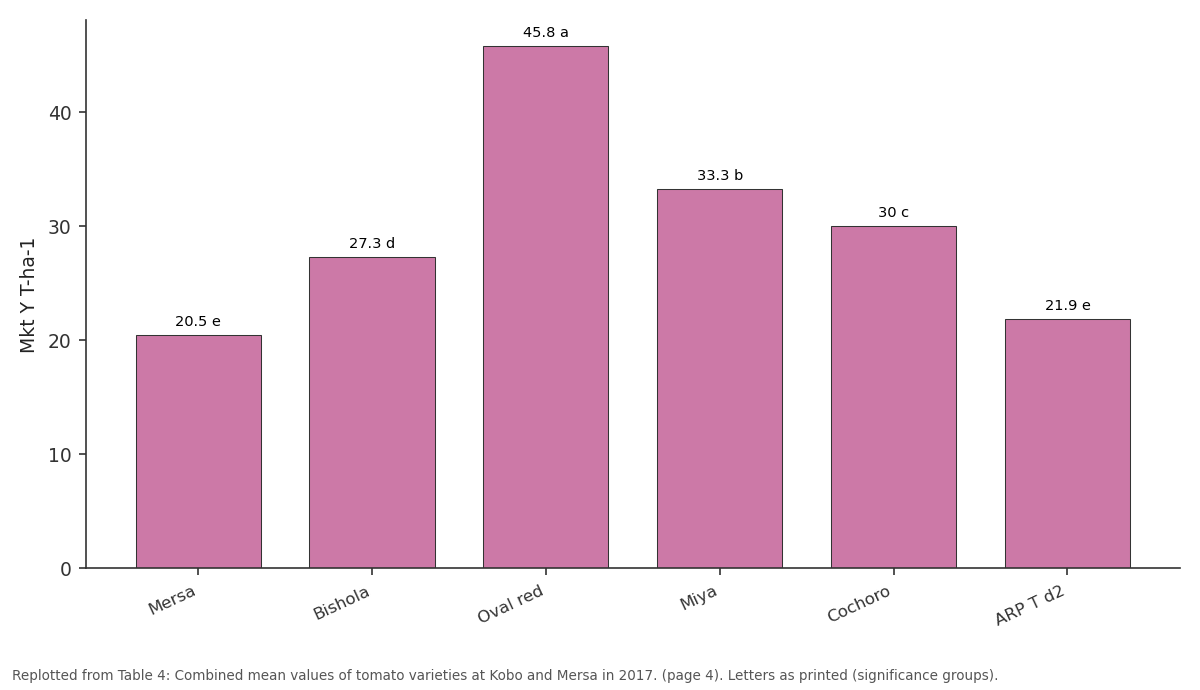
Mkt Y T-ha-1: Mersa vs Bishola vs Oval red vs Miya vs Cochoro
Replotted from Table 4 (page 4) of the original paper. Every bar is the paper's own table value.
View source evidence ↗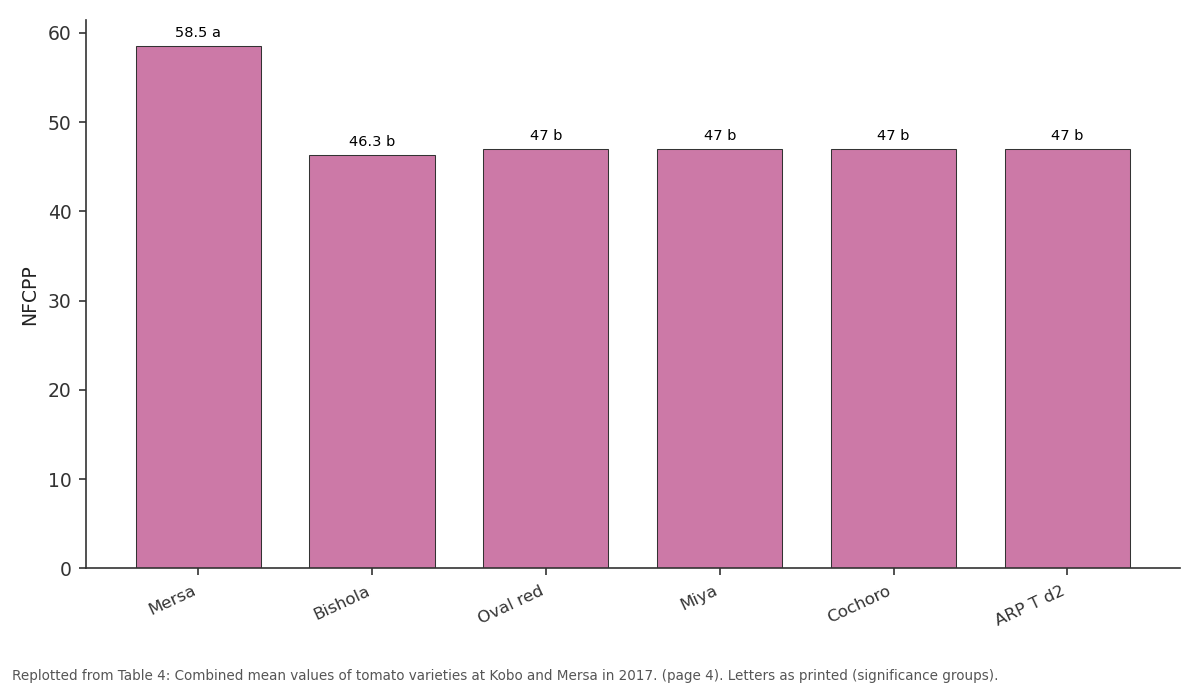
50% FD: Mersa vs Bishola vs Oval red vs Miya vs Cochoro
Replotted from Table 4 (page 4) of the original paper. Every bar is the paper's own table value.
View source evidence ↗Figures & tables
From the original paper Table 1
 Table 2
 Table 3
 Table 4
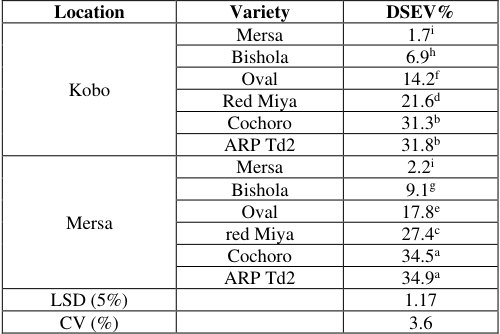 Table 5
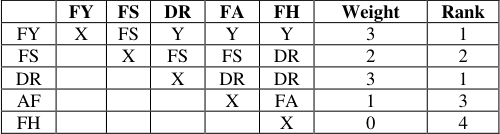 Table 6
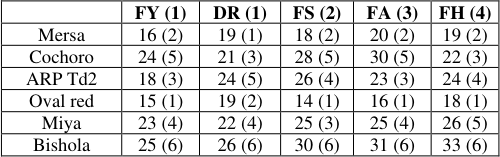 Table 7
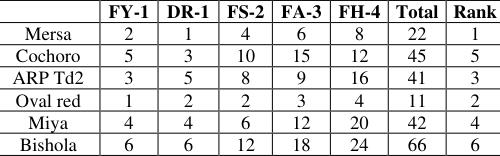 Table 8
Introduction
Tomato (Lycopersicon esculentum Mill.) is one of the most widely consumed vegetable crops in the world. Globally, among horticultural products tomato ranks third for volumes of production after potato and sweet potato and first in terms of processing volumes (FAO 2019) [14] . By virtue of its high yields per hectare and its processing potential, it is one of the strategic commodities prioritized by the government of Ethiopia for agro-industry development in the country (Brasesco et al., 2019) [6] . It is originated in Mexico, and spread throughout the world following the Spanish colonization of the Americas (Wikipedia, 2016) [27] . In Ethiopia, there is no exact information as to when tomato was first introduced; however, the crop is cultivated in different major growing areas of the country. According to (CSA 2019) [7] in the year of 2018/19 of Meher season the total production of tomatoes in Ethiopia was about 23,583.75 tons harvested from 4,322.31 hectares of land and in Amhara region, about 7,422.5 tons from 894.3 hectares of land and its productivity was 5.12 and 8.3 ton ha -1 in Ethiopia and Amhara region respectively, which was very low compared to other countries. It is a nutritionally well-balanced food that contains a substantial amount of vitamin A and vitamin C, thus it plays an important role towards ensuring food security and nutrition. It is generally cultivated in tropical, subtropical, and temperate climates, including Ethiopia's mid and lowland areas (Brasesco et al., 2019) [6] . Tomato is an essential ingredient in the diet of the Ethiopian population and it is consumed in large quantities in many traditional dishes such as soups, sauces, stews, and salads (FAO, 2019) [14] . Tomato has medicinal values and being used for blood purification and curing digestive ailments (Kaushik et al., 2011) [17] . Tomato is produced in the state and private horticultural enterprises, commercial farms, and small farmers scattered in different parts of Ethiopia. It is produced mainly as a source of food and income both under rain-fed as well as irrigated conditions. Tomato is among the most important vegetable crops in Ethiopia. Therefore, developing superior-yielding varieties through appropriate breeding work is required to satisfy ever increasing demand of domestic and export markets for this crop [12] .
Kobo and Mersa areas are naturally suitable for vegetable production due to favorable agro ecology and availability of irrigation water. It is mainly for commercial vegetable production in three rounds per year. Even though the areas have high potential in vegetable production and their economic role is huge, farmers are unlikely to extract the opportunity due to a lack of better tomato varieties and other constraints. Participatory variety selection (PVS) is a breeding approach that brings breeders, social scientists, farmers, and extension personnel together in a field setting in order to prioritize and target traits of importance. It also helps to identify and assess traits that are important to small-scale farmers and is especially successful in assessing "subjective traits" such as taste, aroma, appearance, texture, storage quality, and culinary qualities, which are difficult to measure quantitatively (Bellon 2002) [4] . Understanding farmers' preferences across different agro-ecologies is an important first step for breeding programs who seek to develop acceptable varieties by farmers. The breeding program should work directly with farmers in variety selection, jointly evaluating new varieties along with farmers existing local varieties (Danial et al. 2007) [8] . The production and productivity not only depend on cultural practices and areas of cultivation but on high-yielding varieties, which have good adaptability to the growing areas. Hence, evaluation of tomato varieties is extremely important to see the performance of varieties for their adaptability and agronomic performance like growth and yield traits to identify the potential variety. Therefore, this study was executed to evaluate the adaptability and yield potential of different improved tomato varieties in the study area through participatory variety selection and to ensure their acceptability by farmers.
Materials and Methods
Materials and Methods
Description of Study Areas
The study was conducted at Kobo sub-center research field, and at Mersa on farmers' field from December to April 2017 under irrigation. The testing site at Kobo is located at 12 ° 08'21''N latitude and 39 °38' 21" E longitude with an altitude of 1470 M.A.S.L. The soil type is clay-loam in texture. The long-term (10-year) mean annual rainfall is 668mm with a maximum and minimum temperature of 31°C and 15 °C, respectively (SARC, 2009) [25] . The testing site at Mersa is located at 11 0 40'N latitude and 39 0 39.5'E longitude with an altitude of 1600m.a.s.l. The soil type is clay-loam in texture The long-term (10-year) mean annual rainfall is 848mm with maximum and minimum temperature is 30 °C and 11.6 °C, respectively (EAMSC, 2019) [9] .
Description of Test Varieties
Six open-pollinated tomato varieties (Mersa, Cochoro, Miya, Bishola, Oval red, and ARP Td2,) were used for the study. Variety Mersa was used as a standard check. The varieties were released by Sirinka and Melkasa Agricultural Research Centers (Table 1).
| Variety name | Year of release | Altitude (m) | Rainfall (mm) | Days to maturity | Yield ha-1 (research field) | Breeder/Maintainer |
|---|---|---|---|---|---|---|
| Mersa | 2006 | 800-2000 | 1400 | 100-120 | 27.6 | SARC |
| Cochoro | 2007 | 800-2000 | 1400 | 100-120 | 45 | MARC |
| Miya | 2007 | 500-2000 | 1200 | 82 | 47.1 | MARC |
| Bishola | 2005 | 500-1800 | 1200 | 85-90 | 34 | MARC |
| ARP Td2 | 2012 | 800-2000 | 1400 | 100-120 | 37.2 | MARC |
| Oval red | 2015 | 800-2000 | 1400 | 100-110 | 50 | MARC |
Table text extracted from the original PDF; superscript letters are shown inline. The original table image is below.
View original table image
Experimental Treatments, Design, and Management
Six improved and released tomato varieties collected from Sirinka and Melkasa Agricultural Research Centers were evaluated for their performance at two on stations and four farmers' fields both at Kobo and Mersa. The treatments were laid out in Randomized Complete Block Design (RCBD) with three replications. Treatments were assigned to the experimental plot randomly. The size of the experimental plots was 4 m x 3 cm (12 m 2 ) with a net plot area of 2 m x 2.4 m (4.8 m 2 ). A free space of 1 m and 1.5 m between plots within blocks and between blocks was kept for cultural practices. Seedlings were planted at the spacing of 30 x 100 cm between plants in the row and between rows, respectively, as indicated by Naika (2005) [21] . Seeds were sown in rows of 15 cm spacing on well-prepared raised ground nursery beds having the size of 1 m x 5 m at Kobo trial station. Sown seeds were covered lightly with fine soil and then with 2-3 cm thick grass mulch. Watering was done daily until germination and then with three days interval. Transplanting of seedlings on the experimental field was done at the 3-5 true leave stage when seedlings attained the height of about 15-25 cm. The experimental field was well prepared ahead of seedling transplanting using tractor and human labor. On each experimental plot, 40 seedlings were planted at the spacing of 30 x 100 cm between plants and rows respectively. Watering was done using furrow irrigation at three days intervals. The whole amount of DAP (200 kg ha -1 ) recommended to the area was applied during transplanting while the recommended rate of urea (150 kg ha -1 ) was applied into two equal splits. The first half of urea was applied at the time of planting while the remaining half was applied 21 days after transplanting of seedlings. Experimental plots were kept free from weeds manually and other cultural practices such as disease and insect pest control were performed as per the recommendation for tomato production (EARO, 2004) [11] . The first harvest was started after three months of planting and the final harvest was done after four months of planting. Variety Mersa harvested five times whereas the other varieties harvested three times.
Farmers' selection and participatory evaluation of the varieties
During the experiment, two groups of tomato growers having 21 members (7 women and 14 men) each were selected from the two study areas (Kobo and Mersa) with the help of development agents. Training was given to the farmers to create general awareness about the experiment. In addition to farmers, researchers (breeders, pathologists, and socio-economists) have participated. Group discussions and debates were made to seriously observe and clear contradictory ideas on issues like farmers' preferences, criteria for evaluation, and characteristics of good tomato varieties. Evaluation criteria were set by farmers prior to evaluation as vegetative performance, maturity, number of fruits per plant, fruit size, fruit shape, transportability, market preference, and resistance to disease. According to the participant farmers, good tomato verities should have the following characteristics: vigorous, free from disease, with a higher number of fruits per plant, firm and medium fruit size with oval shape.
Data Collection and Analysis
Data on growth parameters, yield, and yield components consisting of plant height (cm), number of primary branches, days to 50% flowering, number of fruit clusters per plant, marketable fruit yield ha -1 , average fruit length (cm), average fruit equatorial diameter (cm), disease severity score and farmers' preference were recorded.
Plant height: Heights of five randomly selected plants from the ground level to the apex grown in the net plot area using rules were measured at the maturity stage.
Number of primary branches per plant:
The primary branches of five randomly selected plants in the net plot area were counted at the maturity stage.
Days to 50% flowering:
The number of days elapsed from the date of transplanting up to the date when 50% of the plants in plot flowered was recorded and used for analysis.
Number of fruit clusters per plant:
The number of fruit clusters in five randomly selected plants in the plot was counted at 50% flowering.
Fruit length:
The length of five randomly selected fruits at each harvest was measured using a caliper.
Fruit equatorial diameter:
The central diameter of five randomly selected fruits at each harvest was measured using a caliper and the mean values were taken for analysis.
Marketable fruit yield (T-ha -1 ): Fruits free from any visible damages (diseased, insect pest, physiologically and mechanically) were considered as marketable fruit yield. Analysis of variance (ANOVA) was done for the measured variables using SAS version 9.4 statistical software (SAS Institute, 2009) [25] . Means were compared by using the least significance difference (LSD) test at a 5% probability level. The varieties were evaluated by the farmers' criteria and analyzed using pairwise and matrix ranking (Boef and Thijssen, 2007) [5] .
Results and Discussion
Yield and yield components of tomato varieties for the individual locations indicated (Tables 2 and3). In both locations, the varieties significantly differ in all considered parameters, and the highest marketable yield was obtained from the Oval red variety. Variety by location interaction showed non-significant differences in all considered traits except the disease severity which was different across the locations. Combined over the locations, all considered traits were highly significantly affected by the varieties (Table 4). 13.1 6.9 3.5 6.5 5.9 4.4 Where, PH (plant height), NPB (Number of primary branches), 50% FD (50% flowering date), NFCPP (number of fruit clusters per plant), NFPP (number of fruits per plant, FL (fruit length), FED (fruit equatorial diameter), Mkt Y T-ha -1 (marketable yield ton per hectare) and DSEV (disease severity percentage). The combined data over the locations indicated that the highest value of plant height (85.8 cm) was recorded from variety Mersa, whereas the shortest plant height (41.7 cm) from variety ARP Td2 (Table 4). This might be due to different genetic makeup of tomato varieties. This finding was in agreement with other scholars (Khah et [18,15,10,17,19] obtained tomato with plant height in the range of 36.8-126.5 cm. The result indicated a variety of Mersa might need stalking compared to the other tomato varieties. The highest number of primary branches (8.3) was recorded from variety Oval red, however, non-significant difference from variety Bishola, and the least (6.1) was recorded from variety ARP Td2 (Table 4). The difference might be due to genetic differences of the tomato varieties and the environmental conditions of the experimental areas. Many authors (Mohanty and Prusti 2001; Fayaz et al. 2007) [20,15] reported that the number of primary branches per plant between ranged from 3.1 to 12.63. Shushay et al. (2013) [24] reported that the number of branches per plant is an important parameter that indicates the yielding capacity of the tomato variety. The longest day of 50% flowering, from the period between transplanting and flowering (58.5) was recorded from the variety Mersa and the shortest day (46.3) was recorded from the variety Bishola (Table 4). The analysis indicated that except variety Mersa, the other varieties were not statistically different from each other. This result is in agreement with other authors. Abrar et al. (2011) [2] and Falak et al. (2011) [28] indicated that the period from transplanting to flowering of tomato varieties ranged between 40 and 49 days. According to Parvej (2010) [23] , days to 50% flowering is one of the important phonological parameters and determinant factors for the growth and productivity of tomato plants. Moreover, the difference in 50% flowering days can also be attributed to the genetic makeup of genotypes as observed by Abdelmageed et al. (2003) [1] . The highest number of fruit clusters per plant (15.7) was recorded from variety Oval red and followed by varieties Miya (14.9) and Cochoro (11.6) whereas the least (8.1) was recorded from the variety Mersa (Table 4). This might be due to genetic make-up differences of the tomato varieties which were also indicated by the research results of Mohanty et al. (2001) [20] . According to Pandey et al. (2006) [19] , number of fruit clusters per plant is the most important yield attributes in tomato production.
| Variety | PH (cm) | NPB | 50% FD | NFCPP | NFPP | FL (cm) | FED (cm) | Mkt Y T-ha-1 |
|---|---|---|---|---|---|---|---|---|
| Mersa | 85.8a | 6.3b | 58.5a | 8.1c | 70.5a | 5.9a | 3d | 20.5e |
| Bishola | 65.4b | 7.8a | 46.3b | 9.3c | 18.5d | 4.4d | 5.2a | 27.3d |
| Oval red | 59.4c | 8.3a | 47b | 15.7a | 39.9b | 5.5b | 4.4b | 45.8a |
| Miya | 47.9d | 6.8b | 47b | 14.9a | 29.9c | 3.7e | 3.8c | 33.3b |
| Cochoro | 45.7d | 6.2 b | 47b | 11.6b | 18.2d | 4.6c | 4.3b | 30c |
| ARP T d2 | 41.7e | 6.1b | 47b | 9.3c | 16.4d | 4.6c | 4.5b | 21.9e |
| LSD (5%) | 2.4 | 0.8 | 2.1 | 1.6 | 2.5 | 0.2 | 0.3 | 1.9 |
| CV (%) | 3.4 | 10.2 | 3.5 | 11.7 | 6.5 | 3.1 | 5.9 | 5.5 |
Table text extracted from the original PDF; superscript letters are shown inline. The original table image is below.
View original table image
The maximum number of fruits per plant was obtained from the variety Mersa (70.5), while the minimum was recorded from variety ARP Td2 (16.4) (Table 4). Even if the maximum number of fruits per plant was recorded from Mersa variety, the least marketable yield was also obtained from the same variety which might be due to the least fruit equatorial diameter (3 cm) of the variety. Several authors (Eshteshabul et [10,26,2,28] reported that the mean number of fruits per plant lay between 4.46 and 98.30. The higher the number of fruits per cluster the more fruit yield is expected, although fruit size also determines the yield estimation (Pandey, 2006) [19] . The combined mean of maximum fruit length (5.9 cm) was recorded from the variety Mersa; whereas the least (3.7 cm) was recorded from the variety Miya. The result is in line with Meneberu et al. (2011) who reported that the average fruit length of tomatoes is ranging from 3.35 to 5.14 cm and fruit length was an important parameter for variety selection and customer preference. The highest fruit equatorial diameter (5.2 cm) was recorded from the variety Bishola; whereas the lowest (3 cm) was recorded from the variety Mersa (Table 4). Several studies (Kacjanmarsic et [16,10,2,17] showed that the equatorial diameter of tomato fruits lay between 3.2 and 10.67 cm. The size, length, and width of tomato fruits are influenced by the genetic makeup of the varieties (Atherton and Rudich, 1986) [3] . The combined mean of maximum marketable yield (45.8 T-ha -1 ) was recorded from the variety Oval red which emerged as the best-performing variety while the least (20.5 t ha -1 ) was recorded from variety Mersa (Table 4). Marketable fruit yield is the major determinant variable for the selection of a particular tomato variety, as it directly affects commercialization and thus income generation of the farmers (Pandey, 2006) [22] . Meseret et al. (2012) [19] who reported the marketable fruit yield ranging from 7.21-43.8 T-ha -1 in their study. Disease severity percentage was highly significantly (p<0.0001) affected by the varieties and interaction effects of variety and location. The maximum powdery mildew disease severity score was recorded from varieties of ARP Td2 (31.8-34.9%), Cochoro (31.3-34.5%), and Miya (21.6-27.4%) whereas moderate severity was recorded from Oval red (14.2-17.8%) and Bishola (6.9-9.1%) varieties, and the least disease severity percentage (1.7-2.2%) was recorded on variety Mersa (Table 5). Regarding Farmers' perception on the performance of tomato varieties, the majority of participant farmers in the study areas have a good interest in growing tomatoes. The evaluated varieties performed well as compared to the local varieties. The tested varieties showed similar performance in the two study areas. After discussion and debates, farmers ranked the varieties based on their preference (Table 6). Matrix ranking results showed that the overall mean of the ranks for all performance in the study areas indicated that the Oval red variety was first ranked in relation to fruit yield, fruit size, and fruit appearance. Variety Mersa was ranked first in relation to disease resistance. This means farmers have a better preference towards these varieties as compared to others (Table 7). Farmers were also given a chance to compare each variety to the other ones with regards to the values based on identified criteria. Pair-wise ranking was used as a tool to summarize farmers' preference toward the varieties (Boef and Thijssen, 2007) [5] . The result showed that Mersa was the most preferred variety followed by Oval Red, Cochoro, ARP Td2, and Miya (Table 8). Farmers indicated that Oval Red and Mersa were selected due to their higher yield potential and moderately resistance to powdery mildew.
| — | FY-1 | DR-1 | FS-2 | FA-3 | FH-4 | Total | Rank |
|---|---|---|---|---|---|---|---|
| Mersa | 2 | 1 | 4 | 6 | 8 | 22 | 1 |
| Cochoro | 5 | 3 | 10 | 15 | 12 | 45 | 5 |
| ARP Td2 | 3 | 5 | 8 | 9 | 16 | 41 | 3 |
| Oval red | 1 | 2 | 2 | 3 | 4 | 11 | 2 |
| Miya | 4 | 4 | 6 | 12 | 20 | 42 | 4 |
| Bishola | 6 | 6 | 12 | 18 | 24 | 66 | 6 |
Table text extracted from the original PDF; superscript letters are shown inline. The original table image is below.
View original table image
| — | FY (1) | DR (1) | FS (2) | FA (3) | FH (4) |
|---|---|---|---|---|---|
| Mersa | 16 (2) | 19 (1) | 18 (2) | 20 (2) | 19 (2) |
| Cochoro | 24 (5) | 21 (3) | 28 (5) | 30 (5) | 22 (3) |
| ARP Td2 | 18 (3) | 24 (5) | 26 (4) | 23 (3) | 24 (4) |
| Oval red | 15 (1) | 19 (2) | 14 (1) | 16 (1) | 18 (1) |
| Miya | 23 (4) | 22 (4) | 25 (3) | 25 (4) | 26 (5) |
| Bishola | 25 (6) | 26 (6) | 30 (6) | 31 (6) | 33 (6) |
Table text extracted from the original PDF; superscript letters are shown inline. The original table image is below.
View original table image
| — | FY | FS | DR | FA | FH | Weight | Rank |
|---|---|---|---|---|---|---|---|
| FY | X | FS | Y | Y | Y | 3 | 1 |
| FS | X | FS | FS | DR | 2 | 2 | |
| DR | X | DR | DR | 3 | 1 | ||
| AF | X | FA | 1 | 3 | |||
| FH | X | 0 | 4 |
Table text extracted from the original PDF; superscript letters are shown inline. The original table image is below.
View original table image
| Location | Variety | DSEV% |
|---|---|---|
| Kobo | Mersa | 1.7i |
| Bishola | 6.9h | |
| Oval | 14.2f | |
| Red Miya | 21.6d | |
| Cochoro | 31.3b | |
| ARP Td2 | 31.8b | |
| Mersa | Mersa | 2.2i |
| Bishola | 9.1g | |
| Oval | 17.8e | |
| red Miya | 27.4c | |
| Cochoro | 34.5a | |
| ARP Td2 | 34.9a | |
| LSD (5%) | 1.17 | |
| CV (%) | 3.6 |
Table text extracted from the original PDF; superscript letters are shown inline. The original table image is below.
View original table image
Conclusion and Recommendation
The tomato varieties performed differently in growth, yield, and yield components. The marketable fruit yield of the tomato varieties varied from 20.5-45.8 T-ha -1 . However, the maximum yield marketable fruit yield was recorded from Oval Red followed by Miya and Cochoro varieties whereas the least marketable fruit yield was recorded from variety Mersa less disease pressure. This makes very interesting for a breeder to work on crossing of high yielding with diseaseresistant varieties. Therefore, based on yield performance and disease resistance Oval Red and Mersa varies can be further promoted for commercial production under irrigation at Kobo and Mersa areas.
Acknowledgement
AcknowledgementsWe would like to thank Amhara Agricultural Research Institute (AARI) and Sirinka Agricultural Research Center (SARC) for funding this research work.
Figures and tables from the paper
| Variety | PH(cm) | NPB | 50% FD | NFCPP | NFPP | FL(cm) | FED(cm) | Mkt Y T-ha-1 | DSEV% |
|---|---|---|---|---|---|---|---|---|---|
| Mersa | 85.4a | 5.7c | 59.3a | 7.4c | 70.1a | 5.7a | 2.8d | 19.8d | 1.7e |
| Bishola | 64.9b | 7.2ab | 47b | 8.6bc | 18.1d | 4.1c | 5.1a | 26.5c | 6.9d |
| Oval red | 58.9c | 7.7a | 47b | 14.9a | 39.5b | 5.2b | 4.2b | 45a | 14.2c |
| Miya | 47.6d | 6.2bc | 47b | 14.2a | 29.5c | 3.4d | 3.6c | 32.6b | 21.6b |
| Cochoro | 45.3d | 5.6c | 47.3b | 10.8b | 17.8d | 4.3c | 4.2b | 29.3c | 31.3a |
| ARP T d2 | 41.3e | 5.5c | 48b | 8.6bc | 15.9d | 4.3c | 4.3b | 21.1d | 31.8a |
| LSD (5%) | 3.8 | 1.3 | 2.4 | 2.6 | 3.9 | 0.3 | 0.5 | 3.1 | 1.4 |
| CV (%) | 3.6 | 11.7 | 2.7 | 13.1 | 6.9 | 3.5 | 6.5 | 5.9 | 4.4 |
Table text extracted from the original PDF; superscript letters are shown inline. The original table image is below.
View original table image
| Variety | PH(cm) | NPB | 50% FD | NFCPP | NFPP | FL(cm) | FED(cm) | Mkt Y T-ha-1 | DSEV% |
|---|---|---|---|---|---|---|---|---|---|
| Mersa | 86.2a | 6.9c | 57.7a | 8.8c | 70.9a | 6.2a | 3.2d | 21.3d | 2.2e |
| Bishola | 65.8b | 8.4ab | 45.7b | 10bc | 18.9d | 4.7c | 5.4a | 28c | 9.1d |
| Oval red | 59.8c | 8.9a | 47b | 16.4a | 40.3b | 5.8b | 4.6b | 46.5a | 17.8c |
| Miya | 48.4d | 7.4bc | 47b | 15.6a | 30.3c | 3.9d | 3.9c | 34b | 27.4b |
| Cochoro | 46.1d | 6.8c | 46.7b | 12.3b | 18.7d | 4.9c | 4.5b | 30.7c | 34.5a |
| ARP Td2 | 42.1e | 6.7c | 46b | 10bc | 16.8d | 4.9c | 4.7b | 22.6d | 34.9a |
| LSD (5%) | 3.8 | 1.3 | 3.9 | 2.6 | 3.9 | 0.3 | 0.5 | 3.1 | 1.2 |
| CV (%) | 3.6 | 9.8 | 4.4 | 11.5 | 6.7 | 3.1 | 5.9 | 5.6 | 3.1 |
Table text extracted from the original PDF; superscript letters are shown inline. The original table image is below.
View original table image
References
17 in the original paper- Abrar HS, Shams UL, Noor UL, Safdar H. Evaluation of two nutrient solutions for growing tomatoes in a noncirculating hydroponics system. Journal of Agriculture. 2011;27(4):558-567.
- Danial D, Parleviliet J, Almekinders C, Thiele G. Farmers' participation and breeding for durable disease resistance in the Andean region. Euphytica. 2007;153:385-396.
- Eshteshabul M, Jahangir M, Hakim MA, Amanullah ASM, Ahsanullah ASM. An assessment of physicochemical properties of some tomato genotypes and varieties grown at Rangpur. Bangladesh Research Publication Journal. 2010;4(3):135-243.
- Sirba HY, Begna T, Gojam M. Evaluating performance of recently released tomato Lycopersicon esculentum Mill. varieties at highland areas of West Hararghe, Ethiopia. Int J Res Agron. 2022;5(2):18-24.
- Fayaz A, Obedullah K, Sair S. Akhtar H, Sher A. Performance evaluation of tomato cultivars at high altitude. Sarhad Journal of Agriculture. 2007;23(3):581584.
- Kacjanmarsic N, Osvald J, Jakse M. Evaluation of ten cultivars of determinate tomato (Lycopersicon esculentum Mill.) grown under different climatic conditions. Journal of Agricultural Science. 2005;85:321-328.
- Kaushik SK, Tomar DS, Dixit AK. Genetics of fruit yield and it's contributing characteristics in tomato (Solanum lycopersicum). Journal of Agricultural Biotechnology and Sustainable Development. 2011;3(10):321-328.
- Khah EM, Kakava E, Mavromatis A, Chachalis D, Goulas C. Effect of grafting on growth and yield of tomato (Lycopersicon esculentum Mill.) in greenhouse and open field. Journal of Applied Horticulture. 2006;8:3-7.
- Degefa M, Mohammed A, Bantte K. Evaluation of tomato (Lycopersicon esculentum Mill.) genotypes for yield and yield components. African Journal of Plant Science. 2012;6(1):45-49.
- Mohanty BK, Prusti AM. Evaluation of tomato varieties in black soils of western zones of Orissa. Journal of Tropical Agriculture. 2001;39(1):55-56.
- Pandey YR, Pun AB, Upadhyay KP. Participatory varietal evaluation of rainy season tomato under plastic house condition. Nepal Agriculture Research Journal. 2006;7:11-15.
- Parvej MR, Khan MAH, Awal MA. Phenological development and production potentials of tomato under playhouses climate. The Journal of Agricultural Science. 2010;5(1):19-31.
- Chernet S, Belew D, Abay F. Genetic diversity studies for quantitative traits of tomato (Solanum lycopersicum L.) genotypes in Western Tigray, Northern Ethiopia. Journal of Plant Breeding and Crop Science. 2013;6(9):105-113.
- SARC. Sirinka Agricultural Research Center progress report. Sirinka, Ethiopia. SAS-Institute. 2008. SAS 9.4 copyright 2002-2008. Cary, NC: SAS Institute Inc; c2009.
- Turhan A, Ozmen N, Serbeci MS, Seniz V. Effects of grafting on different rootstocks on tomato fruit yield and quality. Horticultural Science. 2011;38(4):142-149.
- Wikipedia. The free encyclopedia; c2016. Available at http://en.wikipedia.org, accessed on 8 August 2016.
- Falak N, Ihsan UL, Syed A, Abdus S, Abdur R. Studies on growth, yield and nutritional composition of different tomato cultivars in Battal valley of district Mansehra, Khyber Pakhtunkhwa, Pakistan. Sarhad Journal of Agriculture. 2011;27(4):570-571.