
Research article · 2022 · Full text
International Journal of Agriculture and Food SciencePhenotypic correlation between morphological and yield related traits of rice (Oryza sativa L.)
Volume 4(2) · Pages 150–154 · DOI: 10.33545/2664844x.2022.v4.i2b.115 ↗
Research areasGenetics and Plant BreedingRice Cultivation and Yield ImprovementGenetic Mapping and Diversity in Plants and Animals
Abstract
Author-writtenRice is known as major staple food crop in India by providing food to more than 70 per cent population. An experiment was carried out in Alpha lattice design with two replications at ICAR-Indian Institute of Rice Research (ICAR-IIRR). An experiment was conducted during kharif season of year 2019 to study correlation and path coefficient analysis in 152 rice germplasm lines were collected. Analysis of variance showed significant differences among genotypes for all the 10 traits studied. Correlation studies revealed that grain yield per plant had positive and significant association plant height at both genotypic and phenotypic levels. Hence, these characters should be given due consideration while applying selection for increasing yield. Results of path analysis indicated that the maximum direct effects for plant height, tiller number per plant, no. of un filled grains per panicle, panicle weight as well as appreciable indirect effects were exerted by days to 50% flowering, effective number of tillers, test weight, towards grain yield per plant. Therefore, selection pressure imposed on these traits would bring improvement in grain yield of rice.
Summary
Source-checkedPlain-language reading of the full paper, prepared with AI and checked against the text. Each point links to the authors' own words.
Why it matters
- Rice is a critical staple food crop globally, with an annual production of 759.6 million tonnes, and it supports over 70% of the population in India. View evidence ↗
- Because rice yield is a complex trait influenced by various direct and indirect components, understanding the association between morphological traits and yield is necessary for improvement. View evidence ↗
- Selecting plants based on specific component characters is often more effective for increasing yield than selecting based on seed yield alone. View evidence ↗
The question
- The study aimed to analyze the correlation and path coefficients of 152 rice germplasm lines during the 2019 kharif season. View evidence ↗
What they did
- The researchers evaluated 152 rice germplasm lines from India and the Philippines using an Alpha lattice design with two replications at the ICAR-IIRR in Hyderabad. View evidence ↗
- Ten traits were measured from five randomly selected competitive plants per replication, including plant height, tiller numbers, grain counts, panicle weight/length, test weight, and yield per plant. View evidence ↗
- Statistical analysis was performed using SAS software, with ANOVA based on the Cochran and Cox model for Alpha lattice designs. View evidence ↗
What they found
- Analysis of variance revealed that there were significant differences among the genotypes for all ten traits studied. View evidence ↗
- At the phenotypic level in 2019, plant height had a positive direct effect of 0.022 on single plant yield. View evidence ↗
- The total number of tillers showed a positive direct effect of 0.045 on single plant yield at the phenotypic level in 2019. View evidence ↗
- The number of unfilled grains showed a positive direct effect of 0.146 on single plant yield at the phenotypic level in 2019. View evidence ↗
- Panicle weight had a positive direct effect of 0.155 on single plant yield at the phenotypic level in 2019. View evidence ↗
- Panicle length had a positive direct effect of 0.046 on single plant yield at the phenotypic level in 2020. View evidence ↗
- Thousand test weight had a negative direct effect of -0.145 on single plant yield at the phenotypic level in 2019. View evidence ↗
What it means
- The authors conclude that plant height, tiller number, unfilled grains per panicle, and panicle weight have high direct effects on grain yield, while days to flowering, effective tillers, and test weight exert appreciable indirect effects. View evidence ↗
- The authors recommend using these specific morphological and yield-related characters to apply selection pressure for improving rice yield. View evidence ↗
Visual summary
2 visualsIllustrations explain the paper; charts are replotted from the paper's own table values.
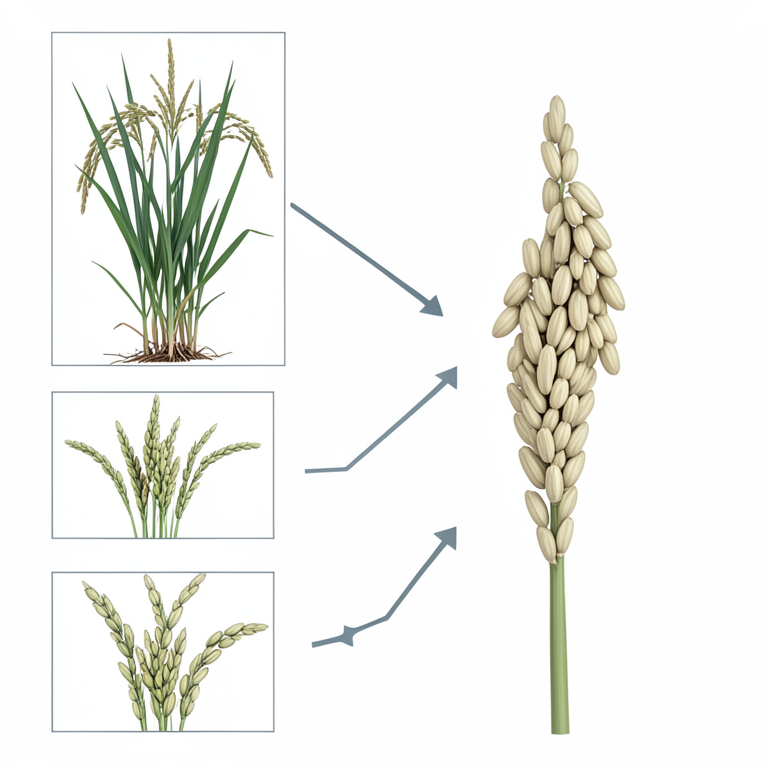
Direct vs Indirect Effects on Rice Yield
AI-generated conceptual illustration (Rice plants (Oryza sativa L.)). It explains the idea and does not show study data.
View source evidence ↗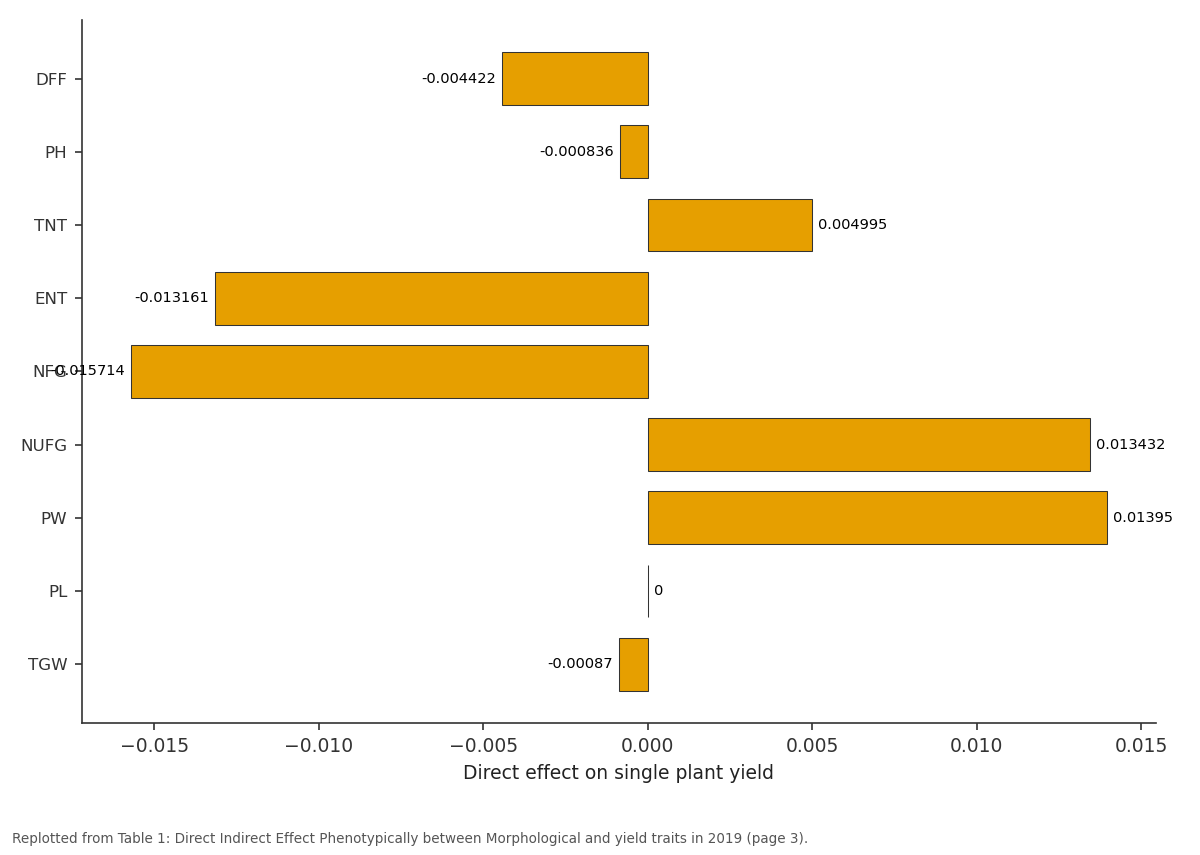
YPP: DFF vs PH vs TNT vs ENT vs NFG
Replotted from Table 1 (page 3) of the original paper. Every bar is the paper's own table value.
View source evidence ↗Figures & tables
From the original paper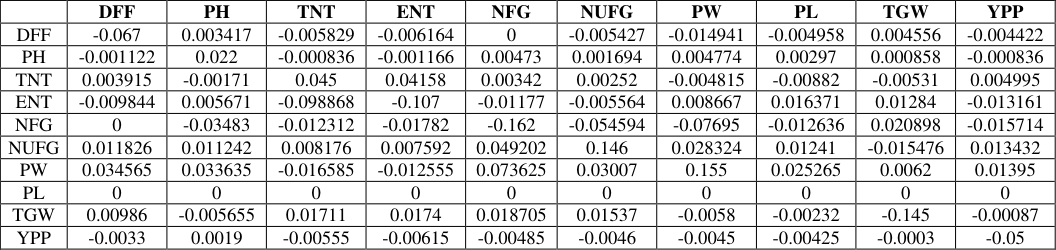 Table 1
Introduction
Rice (Oryza sativa L.) is one of the important staple food crops with an annual production of 759.6 million tonnes (FAOSTAT, 2018) [12] . Rice feeds more than 70 per cent population in India and contributes especially towards the global food security. However, rapidly increasing population has forced us to look for another quantum jump in rice production. Yield, being a complex trait, is composed of several components some of which affect the yield directly, while other affect indirectly. Hence, knowledge of association between Morphological, yield and its components is necessary. Selection directly based on the performance of seed yield, may not be very effective but selection based on its component characters would prove more effective as reported in other plants (Fisher, 1918). Correlation studies would provide estimates of degree of association between seed yield, its various components and also among the components. Although studies on correlation are helpful in determining the components of complex characters like seed yield, these estimates do not provide an exact information about the relative magnitude of direct and indirect influences of each of the component character on seed yield. In this context Wright (1921) [31] proposed estimation of path coefficient analysis as an important tool in partitioning the correlation coefficient into two parts, direct and indirect effects which will be useful in identifying biometrical characters to achieve desirable goal. Therefore, path-coefficient analysis is important to elucidate the intrinsic nature of association of component traits by determining the direct or indirect contribution of these traits to yield.
Materials and Methods
One hundred and fifty two (152) rice germplasm lines collected from all over India and Philippines were evaluated for yield and component traits during Kharif 2019 in Alpha lattice design with two replications at ICAR-Indian Institute of Rice Research (ICAR-IIRR), Rajendranagar, Hyderabad. Thirty days old seedlings were transplanted by adopting a spacing of 15 cm between plants and 20 cm between rows. Recommended agronomic and plant protection measures for raising a healthy nursery and main crop were taken up during the experiment. Replication-wise data on the basis of five randomly taken competitive plants were recorded on following traits: viz., days to fifty per cent flowering (DFF), Total number of tillers per plant (TNT), effective number of tillers (ENT), plant height (PH) (cm), number of filled grains (NFG), number of un filled grains (NUFG), panicle weight (PW) (g), panicle weight (PL) (cm), test weight (TW) (g), and yield per plant (YPP) (g). The mean of five plants for each metric trait was considered for statistical analysis using SAS software. The analysis of variance (ANOVA) was done on the basis of model described by Cochran and Cox (1950) [10] for Alpha lattice design. The genotypic and phenotype variances were calculated as per the formulae proposed by Burton and Devane, 1953 [7] . The replicated data were subjected to statistical analysis. The estimates of covariances were worked out as per Singh and Choudhary (1985) [28] . The estimates of covariances and variances were utilized in computing genotypic and phenotypic path coefficient was worked out as suggested by Wright (1921) [31] .
Path coefficient analysis
The genetic architecture of grain yield is based on the overall net effect produced by various yield components interacting with one another. The association of different component characters among themselves and with yield is quite important for devising an efficient selection criterion for yield. Correlation gives only the relation between two variables, whereas path coefficient analysis allows separation of the direct effect and their indirect effects through other attributes by partitioning the correlations (Wright, 1921) [31] . Based on the data recorded on the genotypes in the present investigation, the phenotypic correlations coefficients were estimated to determine direct and indirect effects of yield and contributing characters. The results for phenotypic path coefficient analysis for yield and its component traits are presented in table.1 For the improvement of crop for higher yield prior to any breeding program, it is commandment to obtain information regarding the inter-relationship of different characters with yield and among themselves, since it facilitates the quicker assessment of high yielding and better performing genotypes in selection programmed. The phenotypic correlation coefficients were estimated among 10 traits of 152 rice germplasm, to find out the association of grain yield and other yield contributing characters (Table 1). [14] reported days to 50% flowering showed direct negative effect. [9] revealed the positive direct effect of plant height, on grain yield. Pankaj et al. (2010) [20] revealed the direct positive effect of plant height at maturity on yield per plant at genotypic level. Ambili and Radhakrishnan (2011) [3] reported high positive direct effect of plant height on grain yield, followed by total no. of tillers, number of productive tillers per plant, Panicle length, panicle weight, no. of filled grains, test weight. The high negative direct effect on yield was recorded for days to flowering. They concluded that yield of rice can be improved by selecting medium tall genotypes having more number of productive tillers per plant, higher straw yield and an optimum duration.
| — | DFF | PH | TNT | ENT | NFG | NUFG | PW | PL | TGW | YPP |
|---|---|---|---|---|---|---|---|---|---|---|
| DFF | -0.067 | 0.003417 | -0.005829 | -0.006164 | 0 | -0.005427 | -0.014941 | -0.004958 | 0.004556 | -0.004422 |
| PH | -0.001122 | 0.022 | -0.000836 | -0.001166 | 0.00473 | 0.001694 | 0.004774 | 0.00297 | 0.000858 | -0.000836 |
| TNT | 0.003915 | -0.00171 | 0.045 | 0.04158 | 0.00342 | 0.00252 | -0.004815 | -0.00882 | -0.00531 | 0.004995 |
| ENT | -0.009844 | 0.005671 | -0.098868 | -0.107 | -0.01177 | -0.005564 | 0.008667 | 0.016371 | 0.01284 | -0.013161 |
| NFG | 0 | -0.03483 | -0.012312 | -0.01782 | -0.162 | -0.054594 | -0.07695 | -0.012636 | 0.020898 | -0.015714 |
| NUFG | 0.011826 | 0.011242 | 0.008176 | 0.007592 | 0.049202 | 0.146 | 0.028324 | 0.01241 | -0.015476 | 0.013432 |
| PW | 0.034565 | 0.033635 | -0.016585 | -0.012555 | 0.073625 | 0.03007 | 0.155 | 0.025265 | 0.0062 | 0.01395 |
| PL | 0 | 0 | 0 | 0 | 0 | 0 | 0 | 0 | 0 | 0 |
| TGW | 0.00986 | -0.005655 | 0.01711 | 0.0174 | 0.018705 | 0.01537 | -0.0058 | -0.00232 | -0.145 | -0.00087 |
| YPP | -0.0033 | 0.0019 | -0.00555 | -0.00615 | -0.00485 | -0.0046 | -0.0045 | -0.00425 | -0.0003 | -0.05 |
Table text extracted from the original PDF; superscript letters are shown inline. The original table image is below.
View original table image
Results and Discussion
Results and Discussion
Plant height
Plant height
Total no. of Tillers
Total no. of Tillers had positive and direct effect (0.045) on single plant yield at phenotypic levels in 2019. It had indirect negative effects on single plant yield through plant height (-0.00171) panicle weight (-0.004815), panicle length (-0.00882), test weight (-0.00531). It had indirect positive effects on single plant yield through, Days to 50% flowering (0.003915), productive tiller number (0.04158), total no. of filled grains (0.00342), no. of un filled grains (0.00252), yield per plant (0.004995). Saravanan and Sabesan (2009) [26] revealed the estimates of direct effects for the number of tillers per plant with high direct effect on grain yield per plant, suggesting that the improvement in grain yield will be efficient if the selection is based on these component traits. Pankaj et al. (2010) [20] revealed the direct positive effect of tillers per plant on yield per plant. Ravindra Babu et al. (2012) [25] reported that number of tillers per hill exhibited maximum direct effect on grain yield per hill at phenotypic levels. Aditya and Anuradha (2013) [1] revealed that tillers per plant exhibited positive direct effect on grain yield.
Effective no. of tillers
Productive no. of tillers had negative and direct effect (-0.107) on single plant yield at phenotypic levels in 2019. It had indirect negative effects on single plant yield through Days to 50% flowering, (-0.009844), productive tiller number (-0.098868), no. of un filled grains (-0.01177), yield per plant (-0.013161). It had indirect positive effects on single plant yield through, plant height (0.005671), panicle weight (0.008667), panicle length (0.016371), test weight (0.01284). Khan et al. (2009) [18] reported negative direct effect of number of productive tillers per plant on grain yield. Sarawagi et al. (2016) [27] reported that effective tillers per plant showed positive direct effect on grain yield per plant. [4] , and Nithya et al. (2020) [35] . [21] .
Number of filled grains
Number of filled grains
Number of unfilled grains
Number of unfilled grains
Panicle weight
Panicle weight had positive and direct effect (0.155) on single plant yield at phenotypic levels in 2019. It had indirect negative effects on single plant yield through, total no. of tillers (-0.016585) productive tiller number (-0.012555). It had indirect positive effects on single plant yield through, Days to 50% flowering, (0.034565) plant height (0.033635), total no. of filled grains (0.073625), no. of un filled grains (0.03007), panicle length (0.025265), test weight (0.0062), yield per plant (0.01395).
Panicle length
Panicle length had positive and direct effect (0.046) on single plant yield at phenotypic levels in 2020. It had indirect negative effects on single plant yield through, total no. of tillers (-0.005382) productive tiller number (-0.00736), test weight (-0.000046). It had indirect positive effects on single plant yield through, Days to 50% flowering (0.00506), plant height (0.002576), total no. of filled grains (0.006486), no. of un filled grains (0.005152), yield per plant (0.002208), panicle weight (0.007498),
Awaneet and Senapati (2013) [6] revealed that panicle length exhibited positive direct effect on grain yield, while 1000 grain weight exhibited negative direct effect on grain yield. Chouhan et al. (2014) evaluated thirty five rice accessions to assess their character association and path analysis for grain yield and yield attributing traits. Path analysis revealed positive direct effects of traits panicle length on yield per plant. Dhurai et al. (2016) [11] revealed that panicle length exhibited high positive direct effects on grain yield. Harsha et al. (2017) [15] revealed that at phenotypic level panicle length direct positive effect. [9] revealed the positive direct effect of 1000-grain weight on grain yield. Harsha et al. (2017) [15] revealed that at phenotypic level, test weight showed direct positive effect.
Thousand test weight
Thousand test weight
Yield per plant
Yield per plant had negative and direct effect (-0.05) on single plant yield at phenotypic levels in 2019. It had indirect negative effects on single plant yield through, Days to 50% flowering, (-0.0033) panicle weight (-0.0045), panicle length (-0.00425), test weight (-0.0003). total no. of tillers (0.00555), productive tiller number (-0.00615), total no. of filled grains (-0.00485), no. of un filled grains (-0.0046), yield per plant (-0.05). It had indirect positive effects on single plant yield through, plant height (0.0019). The data showed that correlation at genotypic and phenotypic levels had the same trend. The values of genotypic correlation coefficients were higher than those of their respective phenotypic correlation coefficients in most of the cases, suggesting that there was a strong and inherent association between two characters. In some cases, however, the phenotypic correlation was slightly higher than their genotypic counterpart, which implied that the non-genetic causes inflated the value of genotypic correlation because of the influence of environmental factors.
Conclusion
Thus, it concludes that path analysis based on phenotypic correlation showed high direct effect of plant height, tiller number per plant, no. of un filled grains per panicle, panicle weight as well as appreciable indirect effects were exerted by days to 50% flowering, effective number of tillers, test weight, towards grain yield per plant. Revealing scope for considering these characters for imposing selection pressure for bringing out an improvement in rice yield. On the basis of all the above findings, it can be concluded that, while imposing selection for genetic improvement of grain yield in rice.
References
29 in the original paper- Aditya JP, Anuradha B. Genetic variability, correlation and path analysis for quantitative characters in rain-fed upland rice of Uttarakhand hills. Journal of Rice Research. 2013;6(2):24-34.
- Akhtar N, Nazir MF, Rabnawaz A, Mahmood T, Safdar ME, Asif M, et al. Estimation of heritability, correlation and path coefficient analysis in fine grain rice (Oryza sativa L.). J Ani. & Pl. Sci. 2011;21(4):660-664.
- Ambili SN, Radhakrishnan VV. Correlation and path analysis of grain yield in rice. Gregor Mendel Foundation Proceedings. 2011, 1-6.
- Anuradha K, Prakash. In-silico identified A., Prakash, B., Ramu, P., Shah, T., Ashok Kumar, A and Deshpande, S.P., Silico identification of candidate genes involved for grain Fe and Zn, 2016, 163.
- Awaneet, Senapati. Revealed that, panicle weight exhibited positive direct effect on grain yield, followed by panicle length. Gour et al. (2017) reported that showed high positive direct effect on panicle weight per plant, 2013.
- Awaneet K, Senapathi BK. Genetic parameters and association studies for important quantitative traits in advanced lines of Sambamahsuri derivatives. Journal of Crop and Weed. 2013;9(1):156-163.
- Burton GW, Devane EW. Estimating heritability in tall Fescue (Festuca arundinacea) from replicated clonal material. Agronomy Journal. 1953;45:478-481.
- Chakraborty Kraborty NR, Bhat JS. Analysis of variability, correlation and coefficients in induced mutants of aromatic non-basmati rice. Tropical Agricultural Research and Extension. 2008;113:60-64.
- Chakraborty S, Das PK, Guha B, Sarmah KK, Barman B. Quantitative genetic analysis for yield and yield components in boro rice (Oryza sativa L.). Notulae Scientia Biologicae. 2010;2(1):117-120.
- Cochran WG, Cox GM. Cross-Over Design. Experimental Designs. 2 nd Edn. John Wiley and Sons. New York. 1957, 127-131.
- Dhurai SY, Reddy DM, Ravi S. Correlation and path analysis for yield and quality characters in rice (Oryza sativa L.). Rice Genomics and Genetics. 2016;7(4):1-6.
- Fisher RA. The correlations among relatives on the supposition of Mendalian inheritance. Tran. Royal Soc. Edinburg. 1918;52:399-433.
- Gour L, Koutu GK, Singh SK, Patel DD, Shrivastava A, Singh Y. Genetic variability, correlation and path analyses for selection in elite breeding materials of rice (Oryza sativa L.) genotypes in Madhya Pradesh. The Pharma Innovation Journal. 2017;6(11):693-696.
- Harsha, Deo I, Kumar S, Talha M. Assessment of Genetic Variability and Inter-Character Association Studies in Rice Genotypes (Oryza sativa L.). International Journal of Current Microbiology and Applied Sciences. 2017;6(9):2041-2046.
- Jayasudha S, Deepak S. Genetic parameters of variability, correlation and path-coefficient for grain yield and physiological traits in rice (Oryza sativa L.) under shallow lowland situation. Elect. J Pt. Breeding. 2010;1(5):1332-1338.
- Ketan R, Sarkar G. Studies on variability, heritability, genetic advance and path analysis in some indigenous aman rice (Oryza sativa L.). J Crop & Weed. 2014;10(2):308-315.
- Naseem I, Khan AS, Akhter M. Correlation and path coefficient studies of some yield related traits in rice (Oryza sativa L.). Int. J Sci. & Res. Pub. 2014;4(4):1-5.
- Pinjari SS, Meshram NA, Jagtap DN, Rathod RR, Sagvekar VV, Bodke PS. Impact of green manuring and growth stimulants on soil properties of organically grown transplanted rice (Oryza sativa L.). Int. J Adv. Chem. Res. 2020;2(1):33-37. DOI: 10.33545/26646781.2020.v2.i1a.59
- Pankaj G, Pandey DP, Dhirendra S. Correlation and path analysis for yield and its components in rice (Oryza sativa L.). Crop Improvement. 2010;37(1):4651.
- Parimala K, Devi KR, Venkanna V, Lingaiah N, Hari Y, Chandra BS. Estimation of variability for grain yield and quality traits in rice (Oryza sativa L.). International Journal of Pure and Applied Biosciences. 2020;4(2):250-255.
- Patel HR, Patel VP, Patel PB, Rathod AJ, Pampaniya AG. Genetic variability, correlation and path analysis for grain yield and component traits in f3 segregating population of rice (Oryza sativa L.). Int. J Chem. Stu. 2018;6(2):2327-2331.
- Rashmi D, Bisen P, Saha S, Loitongbam B, Singh S, Pallavi, et al. Genetic Diversity Analysis in Rice (Oryza sativa L.) Accessions using SSR Markers. International Journal of Agriculture, Environment and Biotechnology. 2017;10(4):457-467.
- Ravindra Babu V, Shreya K, Kuldeep SD, Usharani G, Siva Shankar A. Correlation and path analysis studies in popular rice hybrids of India. International Journal of Scientific and Research Publications. 2012;2(3):1-5.
- Sarawagi AK, Ojha GC, Koshta N, Pachauri A. Genetic Divergence and Association Study for Grain Yield in Rice (Oryza sativa L.) Germplasm accessions. The Ecoscan. 2016;9(2):217-223.
- Sravan T, Rangare NR, Suresh BG, Kumar SR. Genetic variability and character association in rainfed upland rice (Oryza sativa L.). J Rice Res. 2012;5(1):24-29.
- Sürek H, Basir. Correlation and path analysis for yield and yield components in rice in an 8-parent half diallel set of crosses. Oryza. 2003;35(1):15-18.
- Wright S. Correlation and causation. J Agri. Res. 1921;7:557-585.
- Yadav SK, Pandey P, Kumar B, Suresh BG. Genetic architecture, Inter-relationship and selection criteria for yield improvement in rice. Pakistan Journal of Biological Sciences. 2011;14(9):540-545.
- Nithya N, Beena R, Stephen R, Abida PS, Jayalekshmi VG, Viji MM, et al. Genetic variability, heritability, correlation coefficient and path analysis of morphophysiological and yield related traits of rice under drought stress. Chemical Science Review Letter. 2020;9(33):48-54.