
Research article · 2023 · Full text
International Journal of Statistics and Applied MathematicsBayesian inference in control charts using normal prior
Volume 8(1) · Pages 22–25 · DOI: 10.22271/maths.2023.v8.i1a.922 ↗
Research areasAdvanced Statistical Process MonitoringScientific Measurement and Uncertainty Evaluation
Abstract
Author-writtenThe Control Chart is a method of quality control which utilizes statistical methods to monitor and manage processes and based on the sampling inspections and chart performance. This issue is currently being researched into the economic planning of control chart. The traditional approach to design control chart utilizes the traditional structure of control plot to determine the value of parameters of the chart, namely: The sample size, sample interval and control chart limits for achieving economic needs. Under Bayes estimate framework, focus on defining the optimal control policy based on posterior probabilities, thereby reducing total expected costs in the given finite time horizon or the expected average long-term costs.
Summary
Source-checkedPlain-language reading of the full paper, prepared with AI and checked against the text. Each point links to the authors' own words.
Why it matters
- Control charts are statistical quality control tools used to monitor and manage industrial processes through sampling inspections. View evidence ↗
- Statistical Process Control (SPC) acts as a proactive method to signal when a system is out of control, allowing for preventive adjustments to the manufacturing system. View evidence ↗
- The Bayesian method is an emerging approach in Statistical Quality Control that uses subjective probabilities of prior information to account for various uncertainties in a system. View evidence ↗
The question
- The research focuses on using a Bayesian framework to define optimal control policies based on posterior probabilities to reduce expected costs over time. View evidence ↗
What they did
- The model assumes that observations (y) are random variables following a Normal distribution with a known variance (σ2) and mean (µ). View evidence ↗
- The study utilizes a Normal prior distribution characterized by a mean (m) and variance (s2). View evidence ↗
- The posterior distribution is derived by combining the prior distribution with the likelihood function. View evidence ↗
- Control limits were determined using simulated data sets with varying values for the mean (μ) and standard deviation (σ). View evidence ↗
What they found
- When the parameter y is held constant, the control limits increase as the prior mean parameter (m) increases. View evidence ↗
- For fixed values of s and σ, the control limits increase when both parameters y and m increase. View evidence ↗
- The Upper Control Limit (UCL) and Lower Control Limit (LCL) are designed to be equally spaced around the Center Line (CL). View evidence ↗
- In cases where the Lower Control Limit (LCL) results in a negative value, it is rounded to zero. View evidence ↗
What it means
- The authors conclude that the Bayesian inference method effectively incorporates prior knowledge of unknown parameters into the process of creating control charts. View evidence ↗
- The authors note that identifying an uninformative prior in problems involving multiple parameters is a challenging task. View evidence ↗
Visual summary
3 visualsIllustrations explain the paper; charts are replotted from the paper's own table values.
Bayesian Inference Flow
AI-generated conceptual illustration (mathematical probability density curves). It explains the idea and does not show study data.
View source evidence ↗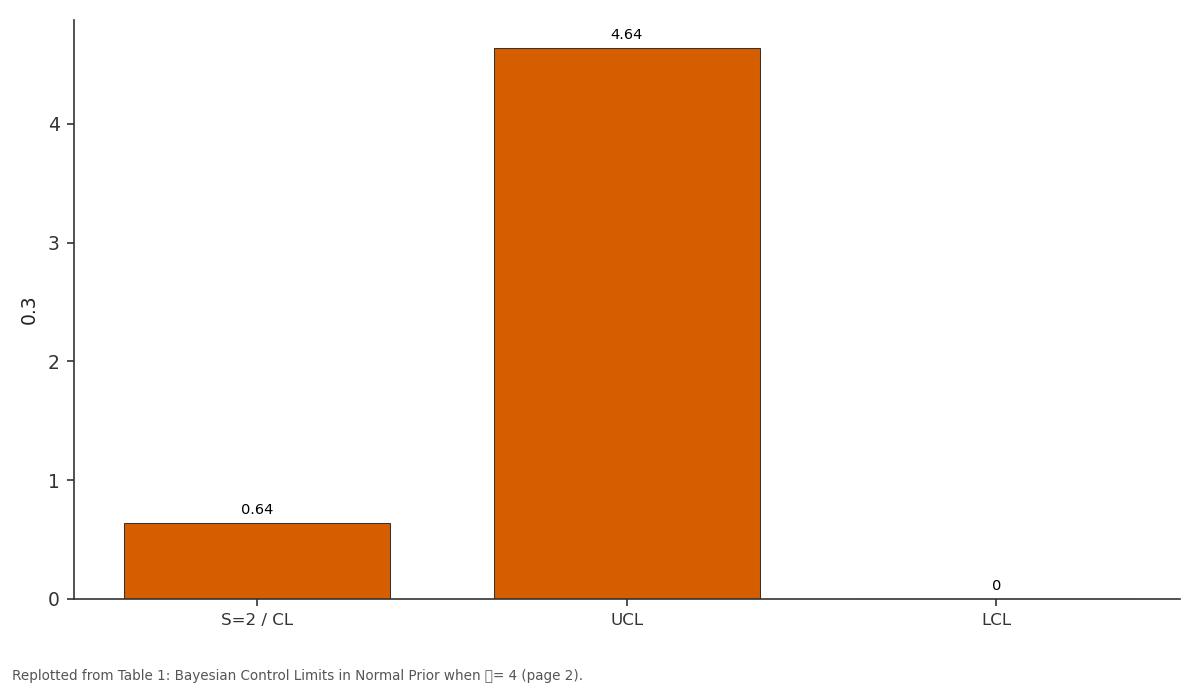
0.3: S=2 / CL vs UCL vs LCL
Replotted from Table 1 (page 2) of the original paper. Every bar is the paper's own table value.
View source evidence ↗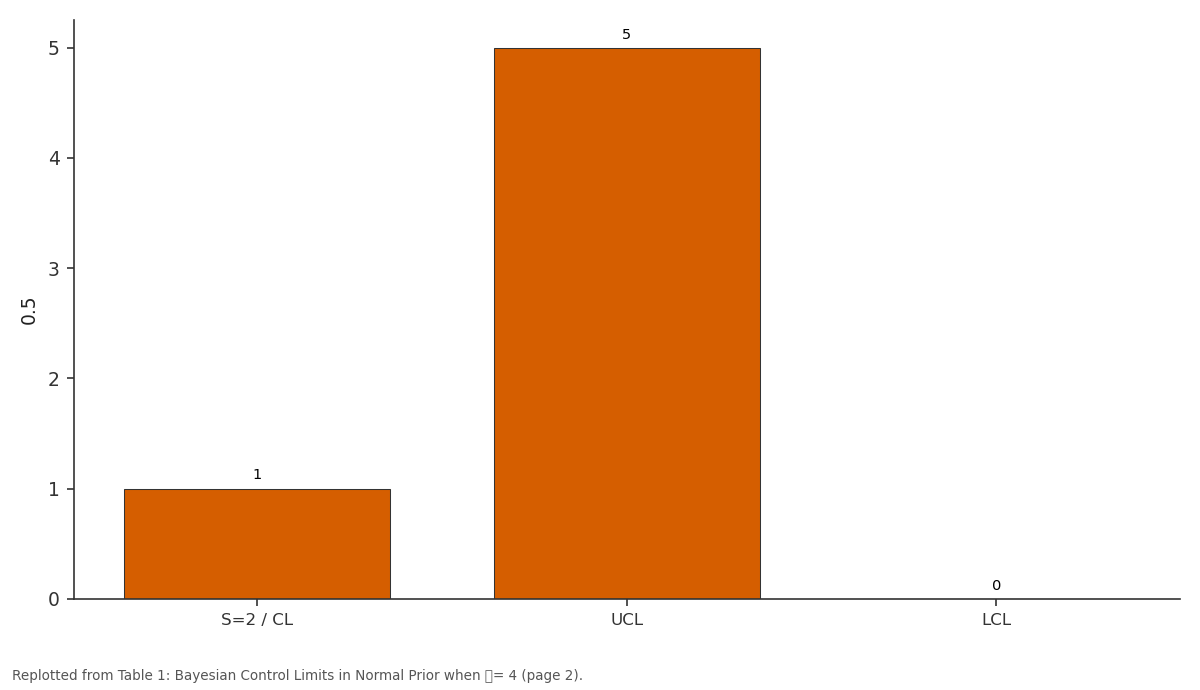
0.5: S=2 / CL vs UCL vs LCL
Replotted from Table 1 (page 2) of the original paper. Every bar is the paper's own table value.
View source evidence ↗Figures & tables
From the original paper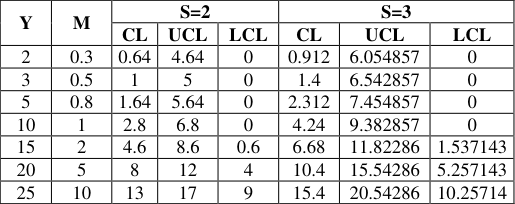 Table 1
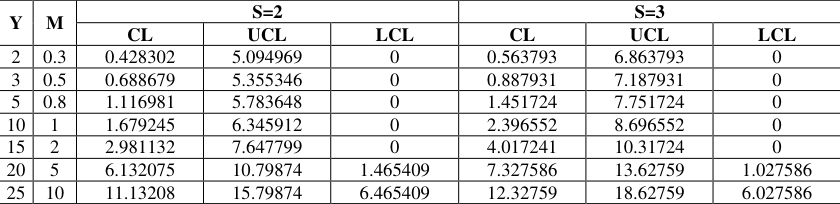 Table 2
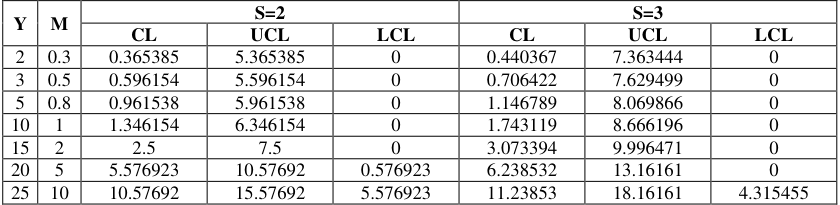 Table 3
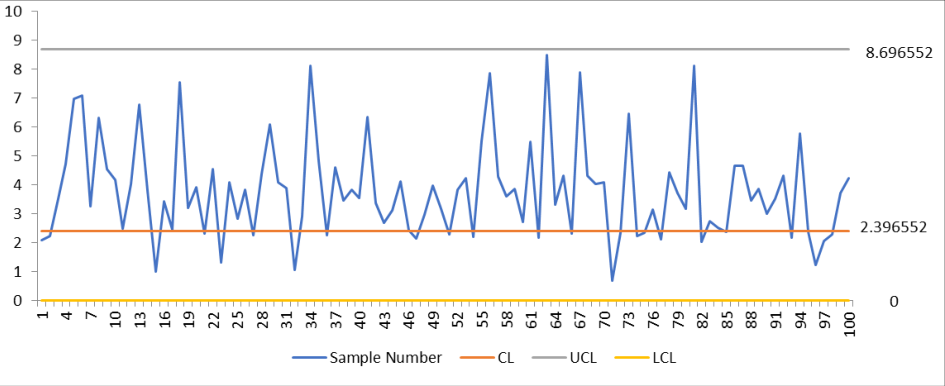 Figure 1
Introduction SPC (Statistical Process Control
) is a statistical technique used to display a system manages and is a proactive method. Unlike recognition sampling plans, it is also used because of the system in which the nonconformities merchandise have already occurred, SPC is used to sign the system while it's miles out of control, after which one has taken essential preventive steps to alter the manufacturing system. Specifically, it's miles and utility of statistical strategies for the gathering of the records observations, charting the records, after which tracking the variety of a selected system of hobby over a time variety relative to the Lower and Upper control limits typically set at three Standard deviations beneath and above from the system goal line. One of the thrilling new methods in commercial SQC (Statistical Quality Control), is the Bayesian method, primarily based totally on subjective possibility of earlier facts approximately the system wherein many varieties of uncertainty are blanketed with inside the version and expressed. Bayesian context consists of a top level view of the notion with inside the system earlier and the product after staring at the records, additionally the cap potential to dynamically replace the control chart additives and anticipated parameters as they arise for the gathering of latest records. Bayesian fashions are designed to interesting system parameters as variables that behave in a distribution of unknown possibility. The Bayesian version affords the shape of observable and unobservable variables, parameters, and their dependencies. This shape continues in view greater flexibility and attempts to clear up the parameters of the manufacturing machine. Ulrich (2002, 2007) [7,9] used the Bayes framework to affirm the goal and the variety of manage charts, respectively. Constructed control chart, proposed through Ulrich (2010) [10] , while the goal of the system and its variance are unknown of ordinary distribution. In 2015, Aamir proposed the chart the use of posterior control limits in which he used the non-informative and informative priors` context to replace the system suggest and show the control limits. Many researchers have additionally prolonged the MLE method to a state of affairs wherein the prior isn't always known. The most effective speculation they formulated changed into that the form of the modifications belongs to a fixed of monotonous effects.
The Bayesian method to modeling and statistical evaluation bureaucracy the idea for estimating a precies of earlier distributions and cutting-edge pattern records. From the perspective of statistical theory, the statistical system is received through seeking out the out the common performance of all viable records. This is the contradiction to the Bayesian system due to the fact greater attention is paid to the conduct of the system in a given state of affairs. In addition, in contrast to frequentist procedures, Bayesian methods formally use the facts to be had from confirms aside from statistical surveys. This fact, beyond experiences, describes all capacity values' possibility distribution of the unknown parameter in a statistical version. The Bayesian Approach is provided in section 2. Section 3 contains The Bayesian Control limits using Normal Prior. Section 4 illustrates a numerical example and section 5 describe conclusion.
Bayesian approach
Bayesian approaches are a reliable model for questionable statistical decisions and statistical conclusions. They provide an often-used solution to the problems faced by standard statistical methods, as well as increasing the usefulness of statistics. Statistical inference using Bayes' theorem should be implemented in a way that accounts for uncertainty caused by evident values.
Posterior (Prior x Likelihood)
Where, "Posterior" is later information related to the size of the sample data. "Prior" means knowing the interest's quantity of the probability distribution; and "Likelihood" is a prototype observation. Therefore, Bayes theorem is attributed to three random quantities of y and parameter σ 2 , s 2 and prior µ as.
𝑔(µ|𝑦) ∝ 𝑔(µ) 𝑥 𝑓 (𝑦|µ)
The prior distribution is combined with the likelihood function to give another distribution called as posterior distribution. The observation y is a random variable taken from a Normal distribution with mean µ and variance σ 2 which is assumed known.
We have a prior distribution that is Normal with mean m and variance s 2 . The shape of the prior density is given by
Usually we have a random sample y 1 , y 2 . y n of observations instead of a single observation. The observations in a random sample are all independent of each other, so the joint likelihood of the sample is the product of the individual observation likelihoods. This gives 𝑓 (𝑦 1 , . , 𝑦 𝑛 |µ) = 𝑓 (𝑦 1 |µ) × 𝑓 (𝑦 2 |µ) ×.× 𝑓 (𝑦 𝑛 |µ).
Prior times likelihood will be a 𝑁(𝜇 𝑛 , 𝜎 2 ).
As we know 𝑠 2 and 𝜎 2 , we can ignore the constant term, then we have
𝑔(𝜇 𝑦
𝑔(𝜇 𝑦
Control limits using normal prior
The Bayesian control chart is a graphical tool used to determine the probability of two out-of-control conditions in a process. This information can be useful when making decisions about process state. The prior distribution determines how much information about the structure of the process should be known before using this chart. However, if you do not have enough data for the posterior distribution, then its variance will be smaller than that of the prior distribution
Numerical example
An example of how Bayesian control limits can be used is illustrated by considering a situation where data from an experiment falls within the range of values that have been observed in past experiments. Control limits for this type of scenario are determined using simulated data sets with different values for μ and σ, as shown in Tables 4.2-4.5 below. The UCL, CL and LCL values are reported below. From Tables 1 to Table 3, for a fixed value of Parameter y, the control limits rise as parameter m rises. The control limits rise whenever parameter y and m rise for a fixed value of and s. Around the CL, the UCL and LCL ought to be equally spaced. Whatever the LCL's negative turn, it can be rounded to zero. A control chart for the proposed Bayesian model is shown in Figure 1. A special case of these values are y = 10, m = 1, s = 3, and = 7.
| Y | M | S=2 | — | — | S=3 | — | — |
|---|---|---|---|---|---|---|---|
| CL | UCL | LCL | CL | UCL | LCL | ||
| 2 | 0.3 | 0.365385 | 5.365385 | 0 | 0.440367 | 7.363444 | 0 |
| 3 | 0.5 | 0.596154 | 5.596154 | 0 | 0.706422 | 7.629499 | 0 |
| 5 | 0.8 | 0.961538 | 5.961538 | 0 | 1.146789 | 8.069866 | 0 |
| 10 | 1 | 1.346154 | 6.346154 | 0 | 1.743119 | 8.666196 | 0 |
| 15 | 2 | 2.5 | 7.5 | 0 | 3.073394 | 9.996471 | 0 |
| 20 | 5 | 5.576923 | 10.57692 | 0.576923 | 6.238532 | 13.16161 | 0 |
| 25 | 10 | 10.57692 | 15.57692 | 5.576923 | 11.23853 | 18.16161 | 4.315455 |
Table text extracted from the original PDF; superscript letters are shown inline. The original table image is below.
View original table image
Conclusion
By giving the parameter a prior distribution, the Bayesian inference method incorporates prior information about the unknown parameter into the inference process. When creating control charts with Bayesian inference, the prior knowledge is combined with a likelihood function to obtain the posterior distribution. Using the posterior distribution, the standardized mean's future distribution is determined. It is a beautiful task to identify the uninformative prior in a multi-parameter problem. Before the control limits are established, a numerical problem utilizing a binary diffusion coupling is presented, along with a control chart showing that all process observations are under control.
Figures and tables from the paper
| Y | M | S=2 | — | — | S=3 | — | — |
|---|---|---|---|---|---|---|---|
| CL | UCL | LCL | CL | UCL | LCL | ||
| 2 | 0.3 | 0.64 | 4.64 | 0 | 0.912 | 6.054857 | 0 |
| 3 | 0.5 | 1 | 5 | 0 | 1.4 | 6.542857 | 0 |
| 5 | 0.8 | 1.64 | 5.64 | 0 | 2.312 | 7.454857 | 0 |
| 10 | 1 | 2.8 | 6.8 | 0 | 4.24 | 9.382857 | 0 |
| 15 | 2 | 4.6 | 8.6 | 0.6 | 6.68 | 11.82286 | 1.537143 |
| 20 | 5 | 8 | 12 | 4 | 10.4 | 15.54286 | 5.257143 |
| 25 | 10 | 13 | 17 | 9 | 15.4 | 20.54286 | 10.25714 |
Table text extracted from the original PDF; superscript letters are shown inline. The original table image is below.
View original table image
| Y | M | S=2 | — | — | S=3 | — | — |
|---|---|---|---|---|---|---|---|
| CL | UCL | LCL | CL | UCL | LCL | ||
| 2 | 0.3 | 0.428302 | 5.094969 | 0 | 0.563793 | 6.863793 | 0 |
| 3 | 0.5 | 0.688679 | 5.355346 | 0 | 0.887931 | 7.187931 | 0 |
| 5 | 0.8 | 1.116981 | 5.783648 | 0 | 1.451724 | 7.751724 | 0 |
| 10 | 1 | 1.679245 | 6.345912 | 0 | 2.396552 | 8.696552 | 0 |
| 15 | 2 | 2.981132 | 7.647799 | 0 | 4.017241 | 10.31724 | 0 |
| 20 | 5 | 6.132075 | 10.79874 | 1.465409 | 7.327586 | 13.62759 | 1.027586 |
| 25 | 10 | 11.13208 | 15.79874 | 6.465409 | 12.32759 | 18.62759 | 6.027586 |
Table text extracted from the original PDF; superscript letters are shown inline. The original table image is below.
View original table image
References
8 in the original paper- Shaka AA, Venkatesan D. Recent Developments in Control Charts Techniques, Universal Review Journal. 2019;8(4):746-756.
- Uirich M. Control Charts for the variance and coefficient of variation based on their predictive distribution, Communications in Statistics -Theory and Methods. 2022;39(16):2930-2941.
- Abirami S, Vijayasankar N. Statistical Process Control Using New Generalization of Exponentiated Mukherjee - Islam Distribution. Journal of Northeastern University. 2022;25(4):569-577.
- Amin SA, Venkatesan D. Bayesian Approach in Control Charts Techniques, International Journal of Scientific Research in Mathematical and Statistical Sciences. 2019;6(2):217-221.
- Ulrich M. On the Evaluation of Control Chart Limits Based on Predictive Distributions, Communications in Statistics Theory and Methods. 2002;31(8):1423-1440.
- Abirami S, Vijayasankar N. SPC Using the LengthBiased Erlang -Truncated Exponential Distribution Advanced Engineering Science. 2022;54(02):5353-5359.
- Ulrich M. Control Charts for the Generalized Variance Based on its Predictive Distribution, Communications in Statistics-Theory and Methods. 2007;36(5):1031-1038.
- Ulrich M. Control Charts for the Variance and Coefficient of Variation Based on their Predictive Distribution, Communications in Statistics-Theory and Methods. 2010;39(16):2930-2941.
Cited by 6
From OpenAlex, OpenCitations and reference lists read by Scinovex
- Bayesian Control Chart for Number of Defects in Production Quality Control ↗
Yadpirun Supharakonsakun · Mathematics · 2024
This study investigates the extension of the c-chart control chart to Bayesian methodology, utilizing the gamma distribution to establish control limits. By comparing the performance of the Bayesian approach with that of two existing methods (the traditional frequentist method and the Bayesian with Jeffreys method), we assess its effectiveness in terms of the average run lengths (ARLs) and false alarm…
❝ 6PDF - A Bayesian Extended Exponentially Weighted Moving Average Control Chart ↗
Souradeep Das, Sudhansu S. Maiti · Stochastics and Quality Control · 2024
Abstract In this study, we propose a Bayesian Extended Exponentially Weighted Moving Average (BEEWMA) control chart. We have considered that the control chart statistic follows a normal distribution and the location parameter has an informative prior (normal). Average run length (ARL) has been used to evaluate the performance of the BEEWMA control chart. A simulation study has been performed to…
❝ 1 - Integration of Bayesian inference with normal priors in control chart design for manufacturing quality assurance: A review ↗
Hiroshi Tanaka · Asian Journal of Management and Commerce · 2026
Manufacturing quality assurance relies on robust statistical monitoring techniques capable of identifying process deviations before they result in nonconforming products. This review investigates the integration of Bayesian inference employing normal prior distributions into the design of control charts for manufacturing applications. Through a comprehensive survey of published literature from 1998 through 2022, this research evaluates the theoretical frameworks, practical implementation
- Posterior estimation techniques for Shewhart control charts under conjugate normal prior assumptions ↗
Lima Rocha · Journal of Mathematical Problems Equations and Statistics · 2026
The integration of Bayesian inference into statistical process control has emerged as a significant area of research within applied mathematics. This review examines the theoretical developments in posterior estimation techniques applied to Shewhart control charts under conjugate normal prior assumptions. Through systematic evaluation of the existing literature published between 2000 and 2022, this research identifies key mathematical frameworks that facilitate
- Computational approaches for implementing Bayesian control charts using normal prior parameterization: A review ↗
Marieke Vries · International Journal of Engineering in Computer Science · 2026
The computational implementation of Bayesian control charts requires careful consideration of algorithmic efficiency, numerical stability, and software architecture to ensure reliable real-time operation. This review examines the computational approaches that have been developed for implementing Bayesian control charts with normal prior parameterization, encompassing both the theoretical algorithmic foundations and the practical software engineering considerations that govern successful deployment. A systematic
- A comprehensive review of normal prior-based Bayesian frameworks for statistical process control charts ↗
Min-Soo Kim · International Journal of Physics and Mathematics · 2025
Bayesian statistical methods have gained increasing recognition within the domain of process monitoring and quality control. This review presents a comprehensive examination of Bayesian frameworks that employ normal prior distributions for the construction and analysis of statistical process control charts. Drawing upon an extensive survey of peer-reviewed publications spanning 2001 through 2022, this research categorizes the existing methodologies into six