
Research article · 2023 · Full text
International Journal of Agriculture and Food ScienceProblems and prospects of water resources in Karnataka
Volume 5(1) · Pages 08–13 · DOI: 10.33545/2664844x.2023.v5.i1a.108 ↗
Research areasWater resources management and optimizationWater Systems and Optimization
Abstract
Author-writtenIndia's annual precipitation is thought to be around 4000 billion cubic metres (bcm) and its potential water supply is 1869 bcm. The overall utilisable water resource potential is 1137 bcm, made up of 690 bcm of surface water and 447 bcm of groundwater due to topographical and other limitations. In India, the yearly water availability per person was around 1544 cubic metres in 2011, but has since decreased owing to population growth. A country is deemed to be under water stress if its per capita annual renewable water supply falls below 1700 m3, according to the widely used Falkenmark Index (Jain, 2019). Out of different states Karnataka is also considered as the water stress region with per capita water consumption for domestic use come down from 135 litres per capita per day (LPCD) to 80-100 LPCD (KSRSAC, GOK) Over the last 50 years, a number of factors, including increasing demand and environmental deterioration, have made managing India's water supplies an increasingly difficult task and, in its water, stressed region also. The majority of the problems with water management in Karnataka can be broadly divided into the following categories: Availability of water resources in Karnataka, demand of water in different districts, variability of annual rainfall, groundwater exploitation and feasible solutions. Here, in this paper has great depth about each of these difficulties and summary of the state of Karnataka's water supply and consumption, as well as the major problems.
Summary
Source-checkedPlain-language reading of the full paper, prepared with AI and checked against the text. Each point links to the authors' own words.
Why it matters
- Water stress is defined by the Falkenmark Index as a condition where the annual renewable water supply per person drops below 1,700 cubic meters. View evidence ↗
- Karnataka is identified as a water-stressed region, where domestic water consumption has decreased from 135 to between 80 and 100 litres per capita per day. View evidence ↗
- Water management challenges in Karnataka primarily involve resource availability, district-level demand, rainfall variability, and groundwater exploitation. View evidence ↗
The question
- The objective of this study is to analyze the demand for water resources and the existing supply gap within Karnataka. View evidence ↗
What they did
- The paper provides a detailed summary and analysis of Karnataka's water supply, consumption patterns, and associated difficulties. View evidence ↗
- The study examines rainfall data, noting a mean annual rainfall of approximately 1,355 mm, with 80% occurring during the South-West monsoon. View evidence ↗
What they found
- Of the 3,475.2 TMC of water available in Karnataka's seven major river basins, only 1,690.30 TMC is economically utilized for development at 50% dependability. View evidence ↗
- The Krishna and Cauvery rivers are the primary water sources, providing 93% of the state's water. View evidence ↗
- The state's replenishable groundwater potential is estimated at 17.03 BCM, with a net availability of 14.81 BCM. View evidence ↗
- Agricultural water usage totals 2,180 TMC, with 78% sourced from surface water and 22% from groundwater. View evidence ↗
- When limited to usable water, per capita availability drops below 1,000 cubic meters per person per year, classifying Karnataka as a region of 'Water Scarcity'. View evidence ↗
- Analysis by the Department of Mines and Geology indicates that 64 out of 234 watersheds in the state suffer from serious water quality issues. View evidence ↗
- Over 50% of the state's irrigation tanks are filled with silt, highlighting a critical need for conservation. View evidence ↗
What it means
- The authors conclude that Karnataka needs a state water policy that is responsive to its future requirements. View evidence ↗
- The authors state that the problem can be largely solved through the judicious and economic use of water across agricultural, industrial, and domestic sectors. View evidence ↗
Visual summary
2 visualsIllustrations explain the paper; charts are replotted from the paper's own table values.
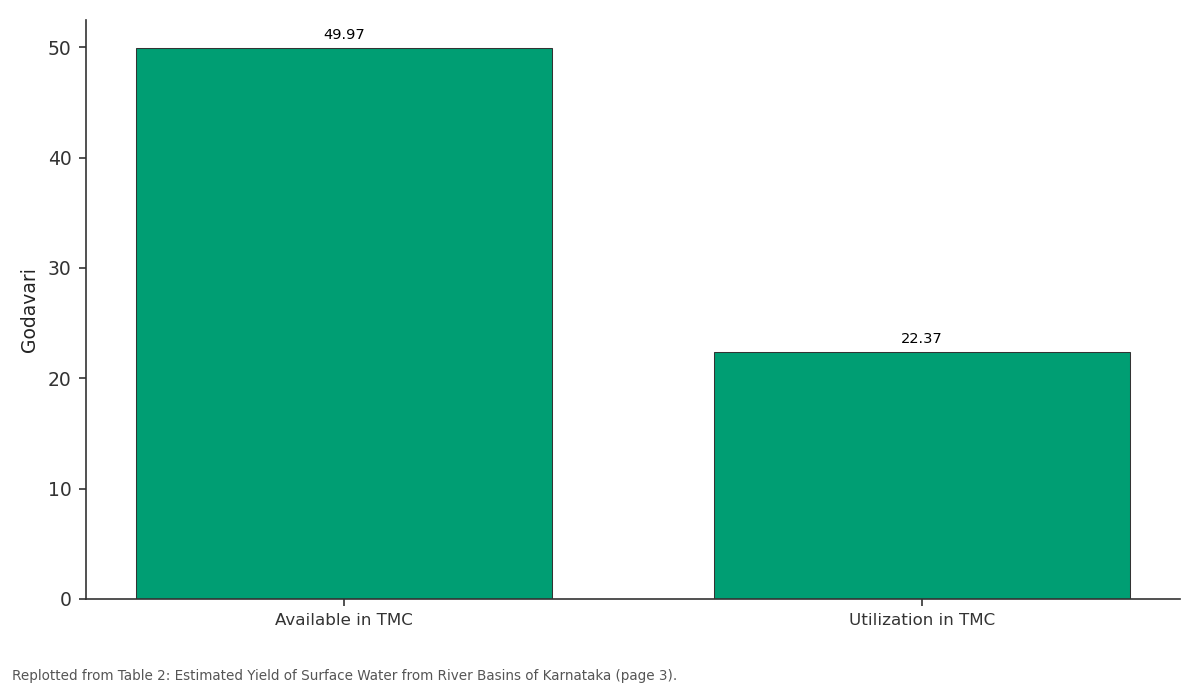
Godavari: Available in TMC vs Utilization in TMC
Replotted from Table 2 (page 3) of the original paper. Every bar is the paper's own table value.
View source evidence ↗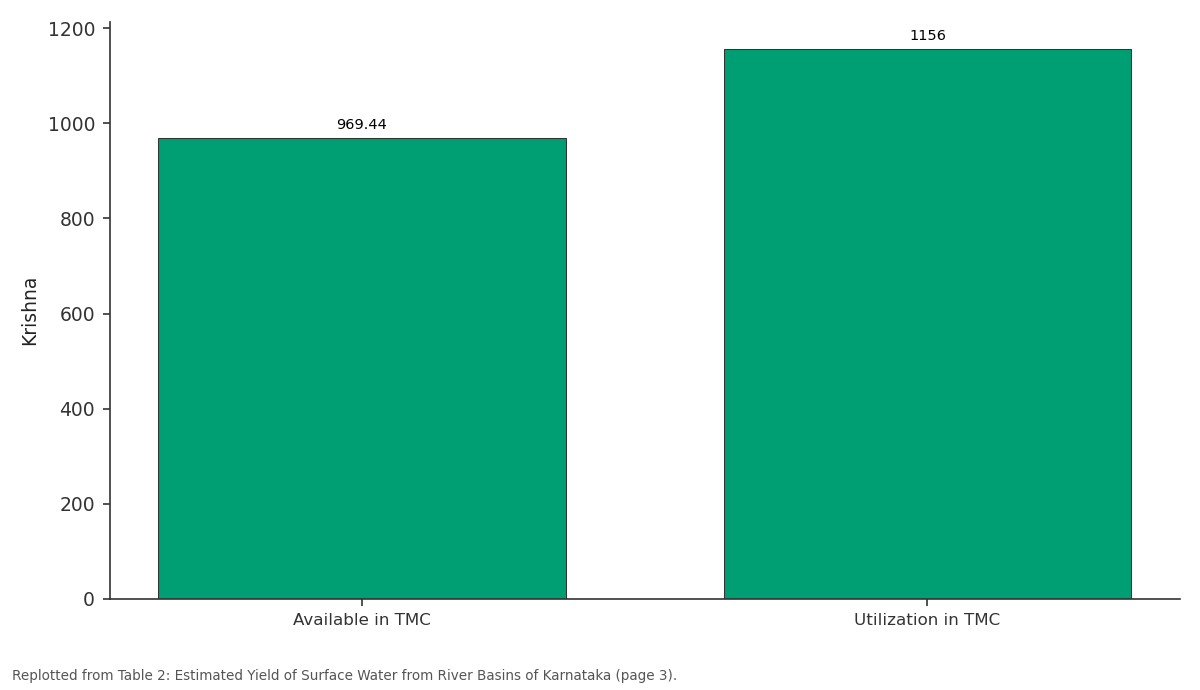
Krishna: Available in TMC vs Utilization in TMC
Replotted from Table 2 (page 3) of the original paper. Every bar is the paper's own table value.
View source evidence ↗Figures & tables
From the original paper Table 1
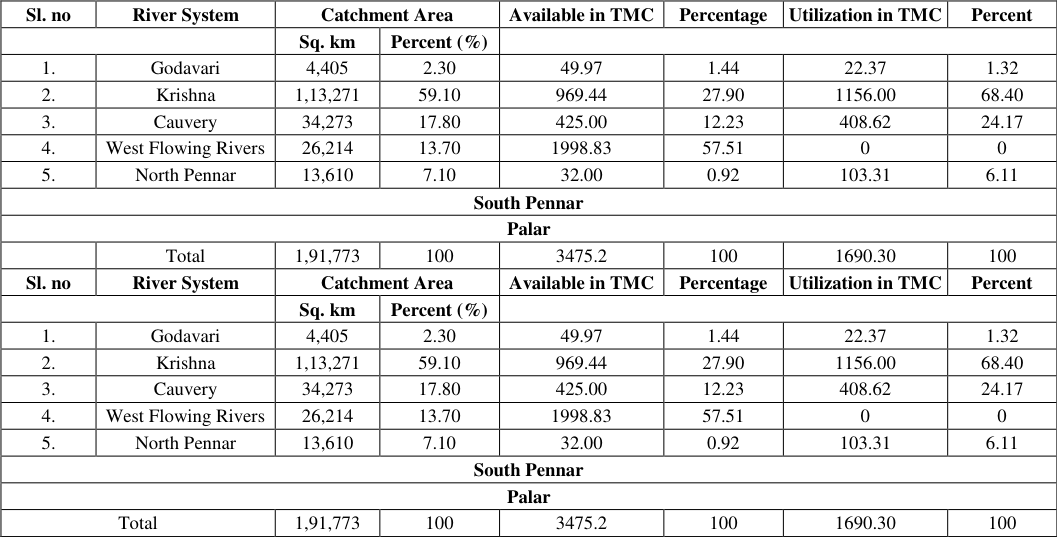 Table 2
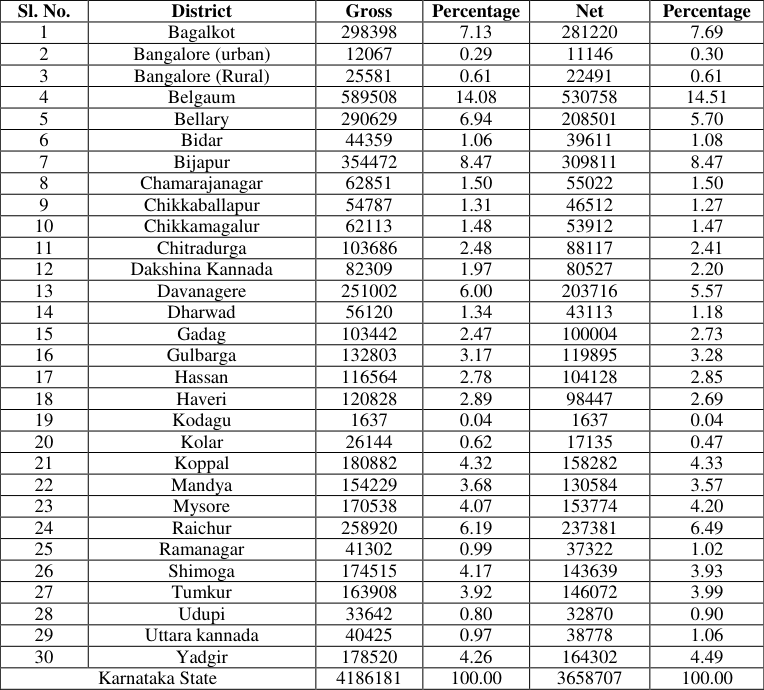 Table 3
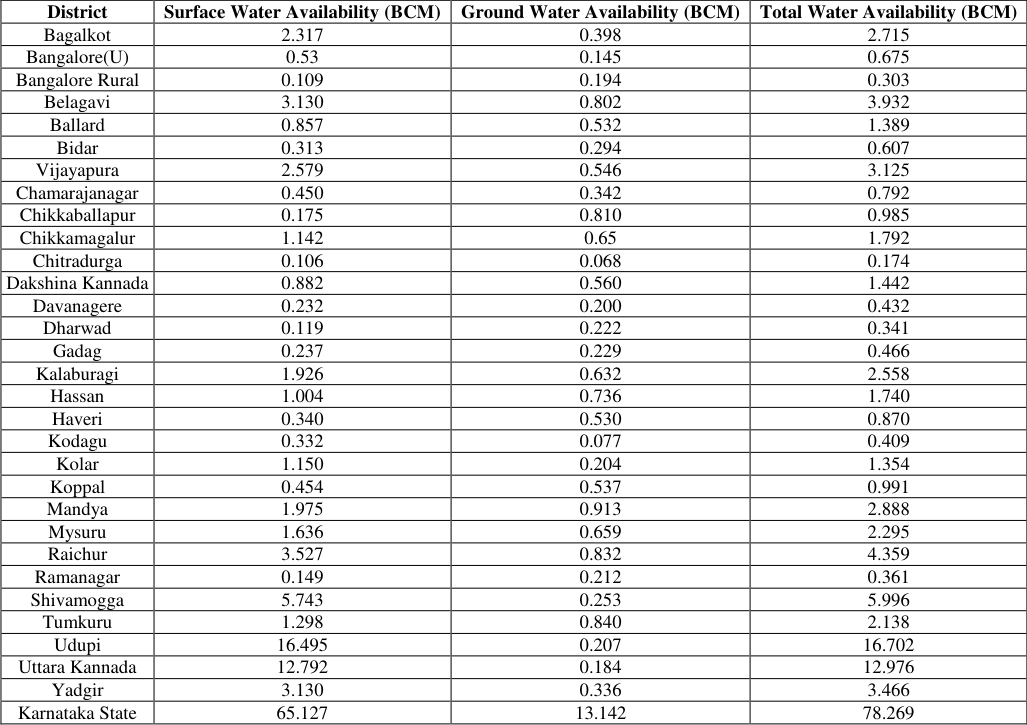 Table 4
Introduction
India is experiencing a very significant water challenge. Approximately, 820 million people of India -living in twelve river basins across the country have per capita water availability close to or lower than 1000 m 3 -the official threshold for water scarcity as per the Falkenmark Index. About 82% of rural households in India do not have individual piped water supply, 81 and 163 million live without access to clean water close to their homes. 82 70% of India's surface water is contaminated (Mishra, 2019) [14] . Average per capita water availability, which is already low enough for India to be categorized as water stressed, is expected to reduce further to 1341 m 3 by 2025 and 1140 m 3 by 2050, 84 closes to the official water scarcity threshold. 85 Estimates suggest ~INR 20, 00, 000 corers in investments are required to bridge the expected water supply gap by 2030, objective of the study is to know the water resources demand and gap in Karnataka.
The population density of the state is 319 per sq. km. The decadal growth rate of Karnataka's population is 15.7%. Karnataka's population was recorded as 61.13 million as per 2011 Census of India. Out of this, 61.43% reside in rural areas. The sex ratio for the state is 973 which is higher than the all-India average of 940. The sex ratio for rural Karnataka is 979 while for urban Karnataka it is 963. The child sex ratio for Karnataka stands at 948 (Gupta and Gok of Karnataka, 2011) [15] .
Climate and Rainfall data
The state receives the majority of its precipitation from the southwest monsoon because it is situated on India's western coast. There are three different types of climates in the state: arid, semi-arid, and humid tropical. The altitude, topography, and distance from the sea affect how the climate varies from place to place. The State experiences three different climates that change with the seasons. The winter season runs from January through February, and the summer season runs from March through May. The South-West monsoon is active in the state from June to September. The post-monsoon season spans the months of October through December. April and May are hot, dry, and uncomfortably warm overall. Due to the high temperature and humidity in June, the weather is frequently oppressive. Despite the continued high humidity, July, August, and September are somewhat comfortable thanks to the lower daytime temperatures. The state receives the benefit of two monsoons: the South-West monsoon and the North-East monsoon. Karnataka receives mean annual rainfall of around 1,355 millimeters (mm). The region that receives the maximum rainfall is coastal Karnataka. South interior Karnataka receives only 1286 mm average rainfall while north interior Karnataka receives the least rainfall with 731 mm average annually. The district of Udupi gets the highest average rainfall while districts such as Chitradurga, Koppal and Vijayapura receive the lowest rainfall. In the districts of Vijayapura, Raichur, Bellary and Southern half of Kalaburagi, the rainfall is the lowest varying from 50 to 60 mm, because the north interior region falls in the rain shadow area (KNNL, Gok and Sulugodu, et al., 2019) [12] . The South-West monsoon is the principal rainy season during which the State receives 80% of its rainfall which is depicted in the table 1. More than 75 percent of the land in majority of the districts in the state is rain fed. The total cropped area of 10.80 million hectares, only 21.50 percent is irrigated while the balance 78.5 percent of agriculture is under rain fed conditions. Two-third of the total geographical area falling in the semi-arid zone receives less than 750 millimeters of annual rainfall with frequent drought conditions.
| Season and Monsoon | Month | Average Rainfall Received (mm) |
|---|---|---|
| Kharif, South West monsoon | June - September | 991.7 (73%) |
| Rabi, North East monsoon | October - December | 212.4 (16%) |
| Cold season | January - February | 8.3 (1%) |
| Summer season | March - May | 142.3 (10%) |
| All seasons | June - May | 1354.7 (100%) |
Table text extracted from the original PDF; superscript letters are shown inline. The original table image is below.
View original table image
Water resources in Karnataka Rivers
Karnataka is endowed with numerous rivers and rivulets that originate primarily in the Western Ghats. Despite the availability of 3475.2 TMC of water in the state's seven major river basins, namely the Krishna, Cauvery, Godavari, West Flowing Rivers, North Pennar, South Pennar, and Palar, only 1690.30 TMC of water is economically used for the state's developmental needs at 50% dependability. The rivers Cauvery and Krishna provide 93% of the water for the state. Because the West Flowing Rivers flow through the ecologically sensitive Western Ghats region, economic use of the water from dams is limited. However, in recent years, efforts have been made, particularly through the Yattinahole Project, to divert water from the west flowing rivers. Rivers flow west to the plains. Because of protracted inter-state water disputes, the state has already reached the point where it cannot improve water utilization through the construction of storage facilities (Multipurpose irrigation dams) by tapping surface water from rivers and the different types of river basins usage and its percentage has been given in table 2 Comparative analysis of the water yield shows that the state yields very less water from the system of seven Rivers when compared to water yields in various basins of India. Further, the Central Water Commission estimates show that the per capita water availability in the country has drastically dropped by 15 per cent during 2001 and 2017 from 1816 to 1545 cubic meter respectively. It is projected that the per capita water availability will drop further to the level of 1401 and 1191 cubic meters by 2025 and 2050 respectively. Water scarcity, water use inefficiency and inequity in water distribution have already resulted in prevalence of water poverty all over India. In fact, the per capita availability of water in Karnataka would be less than the national average.
| Sl. no | River System | Catchment Area | — | Available in TMC | Percentage | Utilization in TMC | Percent |
|---|---|---|---|---|---|---|---|
| Sq. km | Percent (%) | ||||||
| 1. | Godavari | 4,405 | 2.30 | 49.97 | 1.44 | 22.37 | 1.32 |
| 2. | Krishna | 1,13,271 | 59.10 | 969.44 | 27.90 | 1156.00 | 68.40 |
| 3. | Cauvery | 34,273 | 17.80 | 425.00 | 12.23 | 408.62 | 24.17 |
| 4. | West Flowing Rivers | 26,214 | 13.70 | 1998.83 | 57.51 | 0 | 0 |
| 5. | North Pennar | 13,610 | 7.10 | 32.00 | 0.92 | 103.31 | 6.11 |
| South Pennar | |||||||
| Palar | |||||||
| Total | 1,91,773 | 100 | 3475.2 | 100 | 1690.30 | 100 | |
| Sl. no | River System | Catchment Area | Available in TMC | Percentage | Utilization in TMC | Percent | |
| Sq. km | Percent (%) | ||||||
| 1. | Godavari | 4,405 | 2.30 | 49.97 | 1.44 | 22.37 | 1.32 |
| 2. | Krishna | 1,13,271 | 59.10 | 969.44 | 27.90 | 1156.00 | 68.40 |
| 3. | Cauvery | 34,273 | 17.80 | 425.00 | 12.23 | 408.62 | 24.17 |
| 4. | West Flowing Rivers | 26,214 | 13.70 | 1998.83 | 57.51 | 0 | 0 |
| 5. | North Pennar | 13,610 | 7.10 | 32.00 | 0.92 | 103.31 | 6.11 |
| South Pennar | |||||||
| Palar | |||||||
| Total | 1,91,773 | 100 | 3475.2 | 100 | 1690.30 | 100 |
Table text extracted from the original PDF; superscript letters are shown inline. The original table image is below.
View original table image
Lakes and Tanks
Rural areas still rely on lakes and tanks to meet their economic, recreational, and ecological needs, but urban lakes are typically too polluted to be used for productive purposes. The Lake Development Authority has been working to rejuvenate urban lakes. Over a command area of 6, 85, 000 hectares, the state has about 37, 000 lakes and tanks. Hassan (5, 599), Kolar (4, 263), and Shivamogga (4, 890) districts have the most lakes (Table 3). Vijayapura, Bagalkot, and Belagavi districts follow Belagavi in terms of the amount of land that is net-irrigated by wells and tanks. Due to the silt that has overfilled more than half of the state's irrigation tanks, lake and tank preservation is extremely important. The conservation of tanks and lakes is very important as more than 50 percent of irrigation tanks in the state are filled with silt and community management of tanks is completely missing resulting in tragedy of common property resources.
| Sl. No. | District | Gross | Percentage | Net | Percentage |
|---|---|---|---|---|---|
| 1 | Bagalkot | 298398 | 7.13 | 281220 | 7.69 |
| 2 | Bangalore (urban) | 12067 | 0.29 | 11146 | 0.30 |
| 3 | Bangalore (Rural) | 25581 | 0.61 | 22491 | 0.61 |
| 4 | Belgaum | 589508 | 14.08 | 530758 | 14.51 |
| 5 | Bellary | 290629 | 6.94 | 208501 | 5.70 |
| 6 | Bidar | 44359 | 1.06 | 39611 | 1.08 |
| 7 | Bijapur | 354472 | 8.47 | 309811 | 8.47 |
| 8 | Chamarajanagar | 62851 | 1.50 | 55022 | 1.50 |
| 9 | Chikkaballapur | 54787 | 1.31 | 46512 | 1.27 |
| 10 | Chikkamagalur | 62113 | 1.48 | 53912 | 1.47 |
| 11 | Chitradurga | 103686 | 2.48 | 88117 | 2.41 |
| 12 | Dakshina Kannada | 82309 | 1.97 | 80527 | 2.20 |
| 13 | Davanagere | 251002 | 6.00 | 203716 | 5.57 |
| 14 | Dharwad | 56120 | 1.34 | 43113 | 1.18 |
| 15 | Gadag | 103442 | 2.47 | 100004 | 2.73 |
| 16 | Gulbarga | 132803 | 3.17 | 119895 | 3.28 |
| 17 | Hassan | 116564 | 2.78 | 104128 | 2.85 |
| 18 | Haveri | 120828 | 2.89 | 98447 | 2.69 |
| 19 | Kodagu | 1637 | 0.04 | 1637 | 0.04 |
| 20 | Kolar | 26144 | 0.62 | 17135 | 0.47 |
| 21 | Koppal | 180882 | 4.32 | 158282 | 4.33 |
| 22 | Mandya | 154229 | 3.68 | 130584 | 3.57 |
| 23 | Mysore | 170538 | 4.07 | 153774 | 4.20 |
| 24 | Raichur | 258920 | 6.19 | 237381 | 6.49 |
| 25 | Ramanagar | 41302 | 0.99 | 37322 | 1.02 |
| 26 | Shimoga | 174515 | 4.17 | 143639 | 3.93 |
| 27 | Tumkur | 163908 | 3.92 | 146072 | 3.99 |
| 28 | Udupi | 33642 | 0.80 | 32870 | 0.90 |
| 29 | Uttara kannada | 40425 | 0.97 | 38778 | 1.06 |
| 30 | Yadgir | 178520 | 4.26 | 164302 | 4.49 |
| Karnataka State | 4186181 | 100.00 | 3658707 | 100.00 |
Table text extracted from the original PDF; superscript letters are shown inline. The original table image is below.
View original table image
Groundwater
Ground water is another important source for meeting nearly half of the demand for irrigation, industrial production and municipal water needs of both rural and urban areas. The total replenish able ground water potential for the state is estimated at 17.03 billion Cubic Meters (BCM) received from both monsoon and non-monsoon seasons (Rainfall constitutes 9.48 BCM and recharge of 7.55 BCM from other sources). It is estimated that 2.2 BCM of water is naturally discharged during the non-monsoon period and net availability of ground water is 14.81 BCM. The total annual ground water draft (9.41 BCM) for irrigation and Domestic and Industrial use is estimated at 8.59 and 0.28 BCM respectively and the balance BCM is available for economic use (Table-4).
Water Demand
The accelerating demand for water will exceed the supply in future making the state as "Water Deficit or Stress". This will limit the economic growth prospects of agriculture, industrial production and meeting essential drinking water needs in both rural and urban areas. Understanding of water in a globalized economy as economic good ensures devising various new market instruments towards achieving higher economic growth with limited use of water. This will also help efficient and equitable allocation of water among competing sectors of the economy. Efforts have been made to include natural capital such as water in the integrated economic and environmental accounting or green GDP and also to assess the total economic value (TEV) of water contributing for economic growth. Already the growing scarcity of water is reflected in the emergence of formal and informal water market in agriculture, industry and domestic water use. The society has more or less accepted that abundance of water is a thing of the past; water is no longer a merely renewable good, but is a conditionally renewable good. Severe drinking water shortages due to droughts and depleting water tables all over have forced the Government to take policy measure for efficient and equitable allocation of water for all sectors. In recent years, inter-state water disputes and public outcry or water struggles are often showing up in several places of the state. Due to growing water scarcity, rights over water (allocation of interstate water) are imposed by institutions such as Tribunals or Courts Therefore, proper assessment of water demand by various sectors such as agriculture, industry and domestic is necessary to satisfy their competing requirements equitably against limited supply. Even though water allocation is highly skewed in favor of the agriculture sector, recent economic growth and population explosion have resulted in more allocation of water for Industrial and domestic needs. There has been a decline in GSDP generated from the agricultural sector and consequently, the SDP per worker in the sector has been declining at a faster rate in the recent past when compared to the last decade. The share of primary sector has declined from 14.5% in 2014-15 to 11.79% in 2016-17 and total usage of water for agriculture is -2180 TMC (78% from Surface water and 22% from groundwater CWC, 2017)
Water crisis in Karnataka Karnataka has a total population of 61 million, as per the 2011 Census of India. Karnataka is the ninth largest state in terms of population with 5 percent of India's population and 5.8 percent of the country's geographic area. To put this in context, more people live in Karnataka than in countries such as Italy, Spain, Argentina and Canada. Like Karnataka, India as a whole has witnessed rapid growth in the last decade, with an average economic growth rate of over 8 percent per annum. Karnataka is an important state for the country's overall economic performance since it contributes to about 6 percent of country's Gross Domestic Product (GDP) and 13 percent of India's exports. While there has been a recent decline in the rate of growth, the Planning Commission of India has set the target of 8 percent growth for the country in the twelfth five year plan (2012-2017).
For these goals to be achieved, economic growth will need to be supported by growth in all three sectors of the economyagriculture, industry and services. Higher growth, however, means greater water requirements for these sectors. Higher demands will be placed on water for irrigation, for process and cooling purposes in industry and for domestic consumption in urban areaswhich are primary hubs for the services sector. Karnataka exemplifies the particular problems India as a whole face with respect to water resources, namely significant regional and temporal disparities in water availability. The total water availability of Karnataka is in excess of 3,200 TMC which is approximately 1,500 cubic meters per person per year for all water uses including food production. As per the Falkenmark indicator which is a widely used indicator to measure water scarcity, Karnataka would be classified as experiencing "Water Stress". However, closer examination of regional distribution of water resources tells another story. More than 2,000 TMC of water is available in west flowing rivers emanating from the ecologically sensitive Western Ghats region. These are a collection of rivers that travel very short distances and rapidly discharge in the Arabian Sea, and are presently not utilizable except for a small percentage due to limited potential for use. The industrial and urban growth is primarily concentrated in the Krishna and Cauvery basins due to various factors. Thus, while the water resources are theoretically available to the state of Karnataka, their utilization potential, is limited due to unfavorable distribution of water resources and technological, environmental and cost constraints for interbasin river transfers. When one considers only usable water, the per capita availability falls below 1,000 cubic meters per person per year. Based on this assessment Karnataka would be classified as a region experiencing "Water Scarcity" (Rana, 2018) [10] . About 64 of the 234 watersheds have serious water quality problems in the state as per the recent analysis of ground water samples by the Department of Mines and Geology. Ground water is polluted with excess concentration fluoride, arsenic, iron, nitrate and salinity due to both anthropogenic and geogenic factors (Sharannya, 2021) [11] in parts of the State.
Major causes and the solutions 1. Droughts occur often in Karnataka. 67 percent of Karnataka's land designated for irrigation is dry tracts, which is a severe problem given the availability of water from the river systems and storage facilities. 2. Rising populations and quality of life. The demand on the earth's water resources is always rising as a result of a population that is growing quickly and rising living standards. Water resources are becoming less and less accessible per person every day. 3. Water inputs and rainfall. The situation is made worse by the unpredictable patterns of rainfall and the disputes over interstate river water. It is also impossible to overlook how climate change is affecting water resources. 4. Abuse and inadequate management. Siltation of water basins, resource abuse, and inadequate catchment area management all contribute to the water scarcity in the state. 5. Creation of farm ponds which can support in water drain situation. 6. Adopting RWHS (Rain water harvesting structures) in urban and rural areas which recharge the groundwater. 7. Waste water management in urban areas and using treated wastewater in lawns instead of freshwater in fact the wastewater supports good growth of ornamental crops (Gurjar, 2018) [7] . 8. Increasing water efficiency through micro irrigation. 9. Rejuvenation of local water bodies for artificial recharge of aquifers. 10. Formulating Schemes to promote public participatory (Schemes to promote public participatory are Jalvarsha, Jaladhare, Jalamurtha, Amurthavarshani which are initiatives of government of Karnataka) which can be formulated in root level which can boost the proper usage of conjunctive use of water.
In order to cater to the water requirement of the expanding population, the existing water resources must be conserved and prevented from further degradation and depletion. Deficiencies in water management have resulted in inequitable distribution of water, underutilization of the irrigation potential created and problems of land degradation due to excessive use of water. Unauthorized use of irrigation water, excess usage of water by farmers in the head reach and pumping of water from canals are depriving the tail-end farmers their due share of water. Karnataka is endowed with limited surface and ground water resources that need to be systematically developed and properly utilized adopting new approaches for the overall development of the State. Therefore, there is a need to formulate a state water policy, which is responsive to the States future needs. As a conclusion the judicious and economic use of water resources for agricultural, industrial and domestic purposes can help in solving the problem to a large extent.
Figures and tables from the paper
| District | Surface Water Availability (BCM) | Ground Water Availability (BCM) | Total Water Availability (BCM) |
|---|---|---|---|
| Bagalkot | 2.317 | 0.398 | 2.715 |
| Bangalore(U) | 0.53 | 0.145 | 0.675 |
| Bangalore Rural | 0.109 | 0.194 | 0.303 |
| Belagavi | 3.130 | 0.802 | 3.932 |
| Ballard | 0.857 | 0.532 | 1.389 |
| Bidar | 0.313 | 0.294 | 0.607 |
| Vijayapura | 2.579 | 0.546 | 3.125 |
| Chamarajanagar | 0.450 | 0.342 | 0.792 |
| Chikkaballapur | 0.175 | 0.810 | 0.985 |
| Chikkamagalur | 1.142 | 0.65 | 1.792 |
| Chitradurga | 0.106 | 0.068 | 0.174 |
| Dakshina Kannada | 0.882 | 0.560 | 1.442 |
| Davanagere | 0.232 | 0.200 | 0.432 |
| Dharwad | 0.119 | 0.222 | 0.341 |
| Gadag | 0.237 | 0.229 | 0.466 |
| Kalaburagi | 1.926 | 0.632 | 2.558 |
| Hassan | 1.004 | 0.736 | 1.740 |
| Haveri | 0.340 | 0.530 | 0.870 |
| Kodagu | 0.332 | 0.077 | 0.409 |
| Kolar | 1.150 | 0.204 | 1.354 |
| Koppal | 0.454 | 0.537 | 0.991 |
| Mandya | 1.975 | 0.913 | 2.888 |
| Mysuru | 1.636 | 0.659 | 2.295 |
| Raichur | 3.527 | 0.832 | 4.359 |
| Ramanagar | 0.149 | 0.212 | 0.361 |
| Shivamogga | 5.743 | 0.253 | 5.996 |
| Tumkuru | 1.298 | 0.840 | 2.138 |
| Udupi | 16.495 | 0.207 | 16.702 |
| Uttara Kannada | 12.792 | 0.184 | 12.976 |
| Yadgir | 3.130 | 0.336 | 3.466 |
| Karnataka State | 65.127 | 13.142 | 78.269 |
Table text extracted from the original PDF; superscript letters are shown inline. The original table image is below.
View original table image
References
14 in the original paper- Annual Season & Crop Statistics Report of DE&S, Bangalore; c2016-2017.
- Dr. Uvaraj S. GIS based analytical hierarchy process (AHP) and frequency ratio (FR) models for groundwater potential zone mapping. International Journal of Geography, Geology and Environment. 2021;3(2):83-91.
- Central Groundwater Board, Groundwater Scenario of India 2009-2010, June 2010. State of the Environment Report. Government of Karnataka; c2003; c2017.
- Pandey R, Chaurey R, Solanki ERHK, Kumar S, Singh RM. Groundwater prospectus mapping using well points based on remote sensing and GIS techniques in a micro-watershed. Int. J Geogr Geol. Environ. 2022;4(1):145-153.
- Alhassan YJ, Agbomakha FI, Sheriff SY, Manga MT. Examination of gender specific roles in sustainable land use, water management and agricultural productivity in Southern Kebbi state. International Journal of Agriculture Extension and Social Development. 2021;4(1):43-48.
- Gurjar DS, Kaur R. Impact of wastewater irrigations and planting methods on leaf firing, colour, quality and traffic tolerance of Turfgrass. Journal of Environmental Biology. 2018;39(1):117-121. https://censusindia.gov.in/nada/index.php/catalog/42619
- Mishra V, Thirumalai K, Jain S, Aadhar S. Unprecedented drought in South India and recent water scarcity. Environmental Research Letters. 2021;16(5):054007.
- Rana M, Guleria V. Water scarcity in India: A threat to sustainable management of water. ESSENCE - International Journal for Environmental Rehabilitation and Conservation. 2018;9(1):35-44.
- Sharannya TM, Venkatesh K, Mudbhatkal A, Dineshkumar M, Mahesha A. Effects of land use and climate change on water scarcity in rivers of the Western Ghats of India. Environmental Monitoring and Assessment. 2021;193(12):1-17.
- Sulugodu B, Deka PC. Evaluating the performance of CHIRPS satellite rainfall data for stream flow forecasting. Water Resources Management. 2019;33(11):3913-3927.
- Mishra P, Pandey CM, Singh U, Gupta A, Sahu C, Keshri A. Descriptive statistics and normality tests for statistical data. Annals of Cardiac Anaesthesia. 2019;22(1):67.
- Gupta AK, Tyagi P, Sehgal VK. Drought disaster challenges and mitigation in India: Strategic appraisal. Current science; c2011. p. 1795-1806.
- Barker RD, Chandrakantha G. Estimation of runoff potential using curve number method. Indian Journal of Ecology. 2022;49(5):1848-1853.
- Government of Karnataka. Economic Survey of Karnataka 2010-11 and 2011-12; c2013.