
Research article · 2022 · Full text
International Journal of Biology SciencesUtilization and growth performance of Clarias gariepinus fingerlings fed soybean meal-based diets supplemented with pineapple flavour
Volume 4(2) · Pages 35–40 · DOI: 10.33545/26649926.2022.v4.i2a.73 ↗
Research areasAquaculture Nutrition and GrowthAquaculture disease management and microbiotaFish Biology and Ecology Studies
Abstract
Author-writtenAn experiment was conducted to investigate the nutrient utilisation and growth performance of fingerlings of Clarias gariepinus fingerlings fed soybean meal-based diets supplemented with pineapple flavour as feed additive. Four treatments with three replicates each at 25 fishes per tank (mean weight of 22.32 g) were fed four diets (D1-D4) including the control and supplemented with powdered pineapple flavour at 0%, 1.5%, 2.0%, and 2.5% respectively in rectangular glass tanks filled with 30 liters of water each. Feeding was done at 5% body weight on daily basis throughout the feeding trial. Weights of the fish were recorded every week following food adjustment. The water quality parameters were within the range recommended for tropical fish culture. After 56 days, no significant differences (p
Summary
Source-checkedPlain-language reading of the full paper, prepared with AI and checked against the text. Each point links to the authors' own words.
Why it matters
- Aquaculture is viewed as a critical industry for meeting the growing global demand for protein. View evidence ↗
- Feed management is vital for the economic viability of fish farming, as feeding costs typically represent 40-60% of total production expenses. View evidence ↗
- Soybean products are being investigated as alternatives to fishmeal due to their affordability, supply security, and favorable amino acid profiles. View evidence ↗
The question
- The study aimed to investigate how supplementing soybean meal-based diets with pineapple flavor affects the growth performance and nutrient utilization of Clarias gariepinus fingerlings. View evidence ↗
What they did
- Fish were fed twice daily at a rate of 5% of their body weight over a total trial period of 56 days. View evidence ↗
- All experimental diets were isonitrogenous, formulated to provide 40% crude protein, with fish meal limited to 5% of the composition. View evidence ↗
- Water quality was maintained within recommended ranges, with dissolved oxygen (6.0–6.3 mg/L), pH (7.1–7.6), temperature (24.6–25.5 °C), conductivity (73–79 µg), and total hardness (45.2–50.0 mg/L). View evidence ↗
What they found
- No significant differences were found in the proximate composition of the fish across the different dietary treatments. View evidence ↗
- The 2.0% pineapple flavor diet (D3) resulted in the highest mean weight gain (164.8±3.4 g), significantly outperforming the control diet. View evidence ↗
- Feed intake decreased when the pineapple flavor inclusion level was increased beyond 2.0%. View evidence ↗
What it means
- The authors concluded that a 2.0% inclusion of powdered pineapple flavor in soybean-based diets is optimal for the maximum growth of Clarias gariepinus. View evidence ↗
- The authors suggest that future research should investigate other water-soluble plant compounds as potential feed attractants and stimulants. View evidence ↗
Visual summary
2 visualsIllustrations explain the paper; charts are replotted from the paper's own table values.
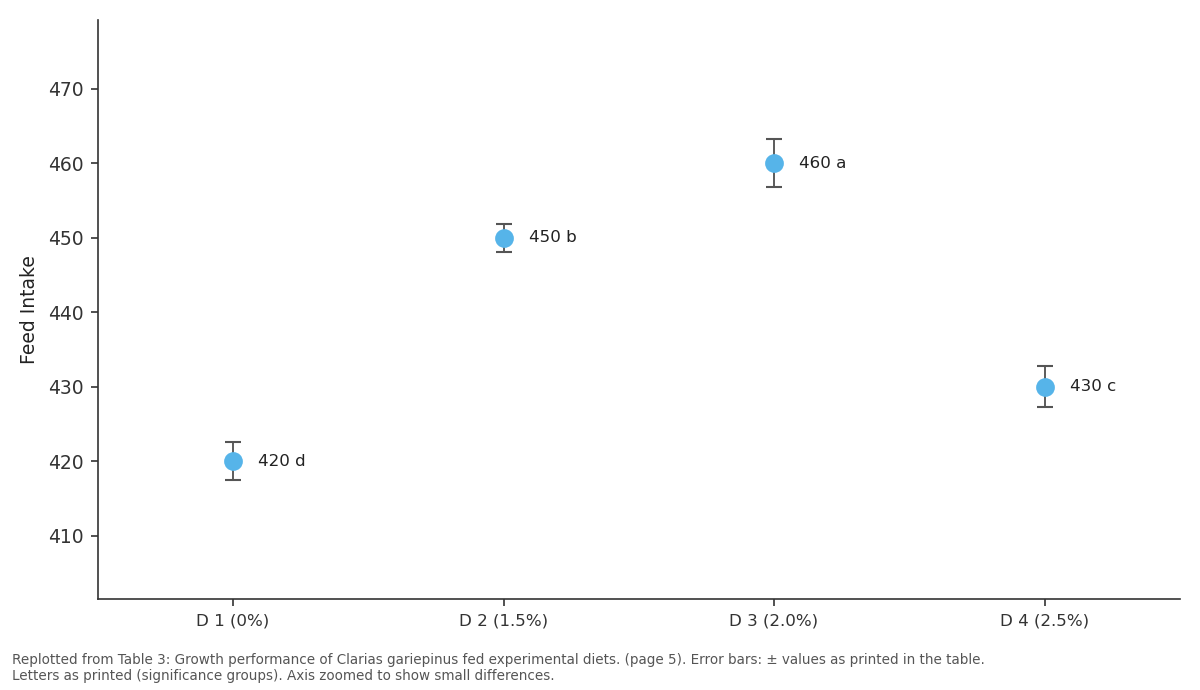
Feed Intake: D 1 (0%) vs D 2 (1.5%) vs D 3 (2.0%) vs D 4 (2.5%)
Replotted from Table 3 (page 5) of the original paper. Every bar is the paper's own table value.
View source evidence ↗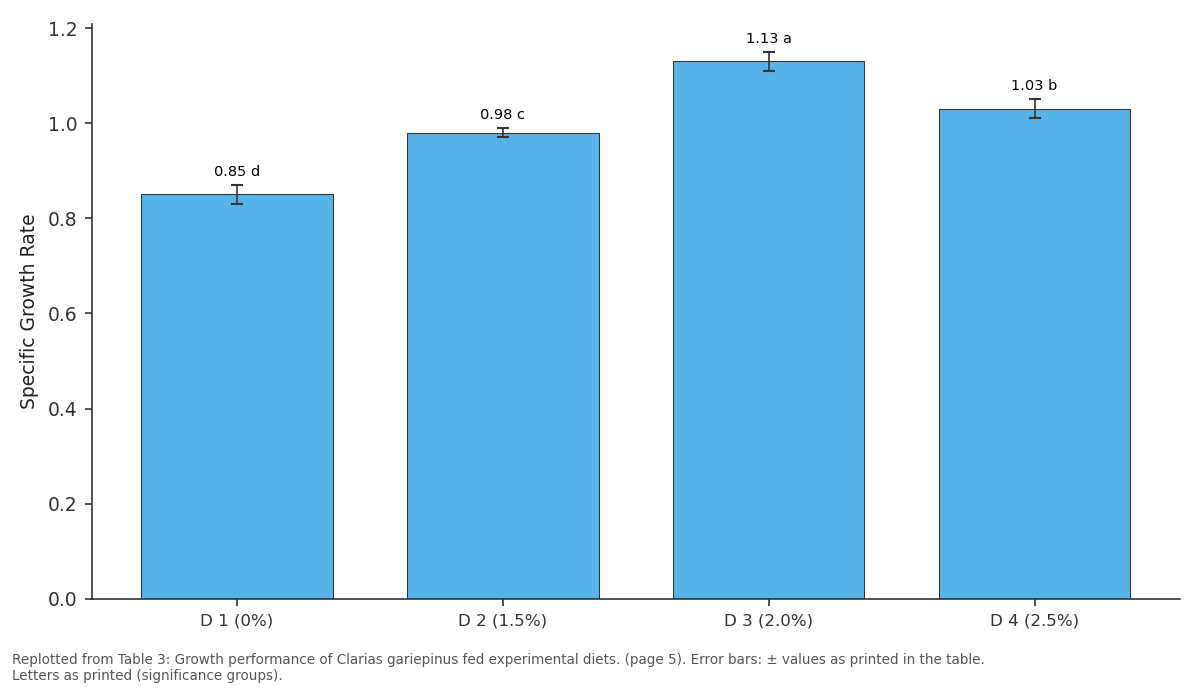
Specific Growth Rate: D 1 (0%) vs D 2 (1.5%) vs D 3 (2.0%) vs D 4 (2.5%)
Replotted from Table 3 (page 5) of the original paper. Every bar is the paper's own table value.
View source evidence ↗Figures & tables
From the original paper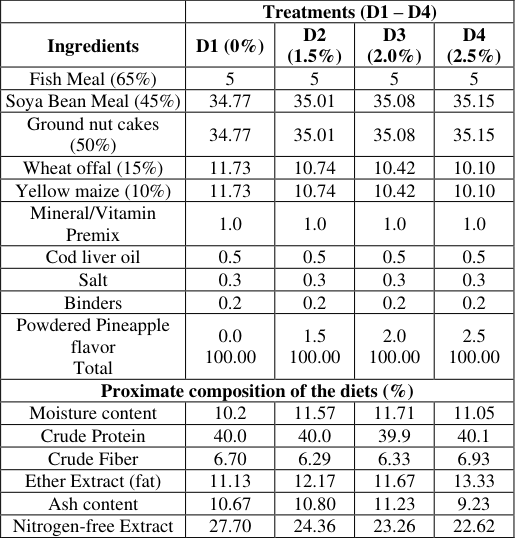 Table 1
 Table 2
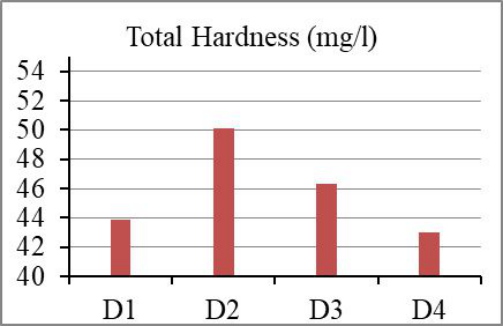 Figure 1
 Table 3
Introduction
The promise of aquaculture has long been recognised till the recent time, despite the virtual demise of the ancient fish pond system. The ancient control over water use and aquaculture represented power and provided stable food supply for the ruling class. For present political leaders, aquaculture represent an opportunity for economic expansion and diversification, yet in-spite of the past history of success and current encouragement, aquaculture has not achieved the level of success that was envisaged [1] . Aquaculture development program points out an increasing demand for aquaculture products on a worldwide basis and could become a major industry for meeting the world future protein demand of the populace [2] . Fish nutrition is recently dominated by the need to develop low fishmeal and fish oil feeds for commercial production. Demand for seafood is expected to increase by 2030 [3] and this demand can only be accomplished by increase in aquaculture production. Alternative source of protein and oil have long been used in fish feeds but the challenge remain to increase their levels in feed while maintaining fish growth, producing healthy products for human consumption and reducing the effects of aquaculture production on the aquatic environment [4,5] .
According to Miles and Chapman [6] , and Hasan and New [7] , feed management determines the viability of aquaculture, as food and feeding account for 40-60% of the total fish farm production. The cost of feeding in aquaculture result to loss of interest or operation at reduced capacities, which made some farmers to shift to crop production. For several years, there has been continuing interest in identifying and developing ingredients as alternatives to fish meal for use within aquaculture industry [8,9] . Among the ingredient being investigated as alternative to fishmeal are the products derived from Soybeans (Glycine max L.), largely because of the security of supply, affordable price and protein/amino acid composition [4] and [10] . Soybeans protein has one of the best amino acid profiles of all protein rich plant feed stuffs for meeting the essential amino acid requirement of fish [11] .
Jindal et al. [10] reported that fish meal provides the major portion of protein in dry commercial aquaculture feeds because fish protein is used efficiently in feed formulation. Plant materials can contain bitter-tasting compounds (antinutritional factors) which may reduce their palatability. The use of feed additives in the aquaculture industry has received considerable attention in the recent time. The rationale behind their use is to preserve the nutritional characteristics of the diet or feed ingredients prior to use, enhancing ingredient dispersion, facilitate feed ingestion thereby promoting growth of the cultured fish [12] . However, feed attractants may lose their stimulatory effect over prolonged study period; therefore, studies of feed attractants are performed over short intervals [13] . Feed additives are added to fish feeds to improve their quality and performance [14] . Flavour can be simply defined as chemical compound that gives pleasant odour and taste. In this study, a commercial pineapple flavour was added to the feed as feed additive. This is a common strategy in other areas of animal production, where industrial flavours are used to promote intake in the earlier life stages and also to hide the unpleasant taste of vitamins, supplements or therapeuticals. Pineapple flavour is made from pineapple fruits pulp which exhibit high moisture, high sugar, soluble solid content ascorbic acid and low crude fibre. Pineapple (Ananas comosus) is a wonderful tropical fruit having exceptional juiciness, vibrant tropical flavour [15] . This fruit are used as supplementary nutritional fruit for good health. It is an excellent source of vitamins and minerals. Also, according to Pardo et al. [16] , Pineapple contain 1.58% protein, 3.0% ash, 3.19% crude fat, 24.14% crude fibre and 68.79% nitrogen free extract, useful for healthy and body development.
In practice, an attractant is needed to induce fish and shrimps to consume proteins they would otherwise reject. Moreover, less feed wasted leads to an improvement in water quality and to a reduction in production costs. There is dearth of information on the use of flavour to enhance feed intake and growth response of the cultured species. This study therefore examined the impact of such feed components in the body composition and growth performance of Clarias gariepinus fingerlings.
Materials and Methods
Materials and Methods
Study site
The experiment was carried out in the Limnology Laboratory at the Department of Fisheries and Aquaculture Technology, Federal University of Technology, Akure (FUTA), Ondo state, Nigeria. The university lies between Latitudes 7°17′ -7°19′N and Longitudes 5°7′ -5°9′E in the north-western part of Akure metropolis.
Experimental Diets
The feed ingredients used for the formulation of the diets were purchased from K2 Feed Mill, Akure, Ondo State, Nigeria. Pineapple flavour was purchased from OK Store at King's Market, Akure, Ondo State. Each feed ingredient was properly milled into fine powder, mixed and pelletized using Hobart A-200 with a 2.0 mm duel (Hobart Manufacturing Ltd, UK). The feeds were immediately dried at room temperature because of the volatility of the flavour and later broken mechanically into smaller sizes and packed in dry, airtight small container and labeled prior to use. The gross composition of the diets is presented in Table 1. There were four treatment including control. Each diet was formulated to give 40% crude protein isonitrogenously. Fish meal constitutes only 5% of the composition. The control (D1) was prepared without pineapple flavour (0%), while diets (D2-D4) were formulated with 1.5, 2.0 and 2.5% of pineapple flavour respectively.
| — | Treatments (D1 – D4) | — | — | — |
|---|---|---|---|---|
| Ingredients | D1 (0%) | D2 (1.5%) | D3 (2.0%) | D4 (2.5%) |
| Fish Meal (65%) | 5 | 5 | 5 | 5 |
| Soya Bean Meal (45%) | 34.77 | 35.01 | 35.08 | 35.15 |
| Ground nut cakes (50%) | 34.77 | 35.01 | 35.08 | 35.15 |
| Wheat offal (15%) | 11.73 | 10.74 | 10.42 | 10.10 |
| Yellow maize (10%) | 11.73 | 10.74 | 10.42 | 10.10 |
| Mineral/Vitamin Premix | 1.0 | 1.0 | 1.0 | 1.0 |
| Cod liver oil | 0.5 | 0.5 | 0.5 | 0.5 |
| Salt | 0.3 | 0.3 | 0.3 | 0.3 |
| Binders | 0.2 | 0.2 | 0.2 | 0.2 |
| Powdered Pineapple flavor Total | 0.0 100.00 | 1.5 100.00 | 2.0 100.00 | 2.5 100.00 |
| Proximate composition of the diets (%) | ||||
| Moisture content | 10.2 | 11.57 | 11.71 | 11.05 |
| Crude Protein | 40.0 | 40.0 | 39.9 | 40.1 |
| Crude Fiber | 6.70 | 6.29 | 6.33 | 6.93 |
| Ether Extract (fat) | 11.13 | 12.17 | 11.67 | 13.33 |
| Ash content | 10.67 | 10.80 | 11.23 | 9.23 |
| Nitrogen-free Extract | 27.70 | 24.36 | 23.26 | 22.62 |
Table text extracted from the original PDF; superscript letters are shown inline. The original table image is below.
View original table image
Experimental Procedure
The experimental fish for the study, Clarias gariepinus were obtained from the Department of Fisheries and Aquaculture Technology Fish Farm in the Federal University of Technology, Akure (FUTA), Ondo State, Nigeria. The experiment was conducted using 12 rectangular glass aquaria (70cm x 45cm x 30cm), comprising four treatments with three replicates each. Prior to the commencement of the experiment, the fish were acclimatized for two weeks and fed within the hours of 07:00am -08:00am with nutritionally balanced commercial diet of 40% crude protein. After the acclimation period, 25 fingerlings were stocked in each of the twelve glass aquaria tanks filled with 30 liters of water each. The fish were fed at 5% of their body weight twice daily in two equal rations for 56 days. Camry Digital Sensitive weighing balance Ek5055 max (5 kg/11 lbd = 1g/0.052) was used for fish weight measurement of the fish on weekly basis.
Water Quality Parameters
The water used for the experiment was being changed on every other day to avoid accumulation of nitrogenous waste in the tanks. Water quality parameters such as dissolved oxygen was measured using DO 2 meter, pH using pH meter, temperature was measured using mercury in glass thermometer, Ultra meter 6P II water quality test meter (Cole Palmer, USA) for conductivity and hydrometer (Fisher Scientific, UK) for measuring total hardness. Temperature and pH were measured daily while other parameters were determined on weekly basis.
Proximate analysis, growth performance and nutrient utilization:
The proximate analysis of the experimental diets, fish sample before and after the experiment was carried out using AOAC methods [17] . The following growth parameters were estimated according to the method used by Fasakin et al. [18] and Ogunji et al. [19] .
Weight Gain (WG)
Where W 1 the initial weight of fish at the beginning of the experiment and W 2 the final weight of fish at the expiration of the experiment.
Specific Growth Rate
This was calculated from the following relationship: SGR = lnW 2 -lnW 1 x 100/days, Where W 1 = initial weight of fish, W 2 = final weight of fish, ln = Natural logarithm to base e, T 2 -T 1 = experimental period in days.
Total Feed Intake
This is the summation of the amount of feed per days of the whole experimental period. It was estimated from 5% of the treatment weight adjustment.
Food Conversion Ratio (FCR)
The FCR was calculated according to Boyd [20] from the relationship between food intake and weight gain by fish.
FCR = Feed Intake
FCR = Feed Intake
Statistical Analysis
Data collected from the experiment were subjected to normality test and analysis of variance (ANOVA) and the differences among means were tested for significance (p<0.05) using SAS statistical package (Version 2.6).
Results and Discussion
Results and Discussion
Water Quality Parameters
The mean results of water quality parameters for all the treatments throughout the duration of the experiment are presented in Fig. 1(a-e). The dissolved oxygen ranged between 6.0 -6.3 mg/L in D2 (1.5%) and D4 (2.5%) respectively. The pH values were between 7.1 and 7.6, temperature was between 24.6 and 25.5 o C during the study. Conductivity ranged between 73µg and 79µg. the total hardness was observed to range between 45.2 and 50.0 mg/L. The quality of water in any ecosystem provides significant information about the available resources for supporting life in that ecosystem. A good water condition is a necessity for the survival and growth of fish since the entire life process of the fish wholly dependent on the quality of its environment [20,42] . Water quality management is a key ingredient in a successful fish culture practice [23,24] because, water quality determine the success or failure of an aquaculture operation. This is in agreement with the report of Wurts and Durbow [25] and Bhatnagar and Devi [24] for good fish culture. The water parameters were within the range recommended for fresh water fish culture [26,27,28,29] . The mean water quality parameters
Proximate composition of the experimental diets
The results of the proximate composition of the experimental diets are presented in Table 1. The mean percentage crude protein value was 40%. Ayinla [30] stated that crude protein level between 35-40% is good for raising African catfish to Juvenile stage. Percentage ash content was lowest in D4 (9.23%) and highest in D3 (11.23%). The percentage crude fibre was lowest in the D2 (6.29%) and highest in D4 (6.93%). The moisture content lowest value was recorded in the Control D1 (10.20%) and highest in D3 (11.71%). The lowest value of lipids (11.13%) was recorded in the control diet and highest value (13.33%) recorded in D4. The NFE was equally lowest in D4 (22.62%) and highest in Control (D1) (27.70%).
Proximate Composition of the Experimental Fish
The carcass composition of the fish before and after the experiment is presented in Table 2. There were no significant differences (p<0.05) observed in the proximate composition of the fish among the treatments after the experiment. Though, slight differences occurred in the values obtained. The results showed that there were increases in the values of protein and fat contents after the experiment in all the dietary treatments with pineapple flavor additive. As the crude protein and fat increases, so also the values obtained for fibre, ash and carbohydrate reduced after the experiment. The crude protein of fish ranged between 56.60±0.6 in fish fed D2 and 57.13±0.5 in the control (D1) above the crude protein before the experiment (56.33±0.1). The low values of fat obtained in the experiment were compensated by high moisture content. This is similar to the report of Tawfik [31] , who reported low and varying level of fat relative to the moisture content. The ash and nitrogen free extracts of the fish fed D2 (1.5%) were similar to that of the fish before the experiment. The protein contents were high (average of 56.98) compare to the report of Manthey-Karl [32] ; 18.9% to 20.3% for turbot in North East Atlantic, and Akpambang [33] ; 21.28 -21.65% for some tropical fishes in Nigeria.
| — | Before | After the experiment | — | — | — |
|---|---|---|---|---|---|
| Parameter (%) | D1 (0%) | D2 (1.5%) | D3 (2.0%) | D4 (2.5%) | |
| Dry matter | 88.17±0.0 | 88.00±0.1 | 88.00±0.3 | 87.57±0.2 | 87.74±0.1 |
| Moisture content | 11.83±0.0 | 12.00±0.1 | 12.00±0.3 | 12.43±0.2 | 12.26±0.1 |
| Crude protein | 56.33±0.1 | 57.13±0.5 | 56.60±0.6 | 57.06±0.4 | 57.13±0.6 |
| Fat | 4.72±0.2 | 4.97±0.9 | 4.80±1.0 | 4. 75±1.1 | 5.05±1.2 |
| Crude fibre | 2.44±0.3 | 2.32±0.6 | 2.28±0.8 | 2.29±0.9 | 2.28±1.0 |
| Ash | 15.52±0.2 | 14.62±0.7 | 15.18±0.6 | 14.9±0.5 | 14.69±0.4 |
| Carbohydrate | 9.16±0.1 | 8.96±0.4 | 9.10±0.7 | 8.48±0.3 | 8.59±1.0 |
Table text extracted from the original PDF; superscript letters are shown inline. The original table image is below.
View original table image
Nutrients utilization and growth performance
The results of the nutrients utilization and growth parameters of the fish fed with experimental diets at different inclusion level of powdered pineapple flavour are presented in Table 3. The result showed there were significant differences (p<0.05) in the mean weight gain, feed intake, specific growth rate and the food conversion ration among the fish fed the diets. Fish fed D3 (2%) had the highest mean weight gain (164.8±3.4) followed by the fish fed D4 (2.5% pineapple flavor inclusion (145.8±4.4). The lowest value of the mean weight gain was recorded in the control diet. This difference can be attributed to the feed intake of the fish which is quite low in the control diet. It can be inferred that pineapple flavour aid more ingestion and assimilation of the feed. The result is similar to that obtained when fish were fed diets formulated with vanilla flavor. It was observed that the feed intake reduced when the level of pineapple inclusion was increase beyond 2.0%. The specific growth rate (SGR) of the fish administered with the various diets was highly significant (p<0.05) in the fish fed D3 (1.13±0.02) followed by those fed D4 (1.03±0.02), D2 (0.98±0.01) and D1 (0.85±0.02) of pineapple flavour respectively. Fish fed D2 produced the best food conversion ration of the feed into flesh. This indicates that fish was able to convert the food consumed into flesh better with 2.0% inclusion of pineapple flavour. This result is in line with the report of Ajiboye et al. [12] that addition of trace amount of feed stimulants or attractants promote feed intake, supply additional nutrients for protein and energy metabolism thereby enhancing growth performance and ingestion rates of farmed species in aquaculture. Previous studies have been reported on the application of different feed additives; probiotics in the diet of Oncorhynchus mykiss [34] , mannan oligosaccharide (MOS) based nutritional supplements in aqua feed for Gilthead sea bream (Sparus aurata) [35] ; European sea bass -Dicentrachus labrax [36] ; attractants in diet for carnivorous largemouth (Micropterus salmoides) [37] , herbal growth promoter feed additive in the diet of Tilapia (Oreochromis niloticus) [38] , Moringa oleifera in the diet of Hybrid catfish [39] ; Clarias gariepinus [40] . However none of these studies have considered the application of flavour or flavour material as feed attractant or stimulant for aquaculture species as justified in this present study. It was reported that a healthy ripe pineapple fruit can supply about 16.2% of daily requirement for vitamin C, which is the body's primary water soluble antioxidant against free radical that attack and damage normal cells [41] .
| Parameters | D 1 (0%) | D 2 (1.5%) | D 3 (2.0%) | D 4 (2.5%) |
|---|---|---|---|---|
| Initial Weight (g) | 557.7±0.2a | 558.1±0.2a | 558.1±0.3a | 558.2±0.2a |
| Final Weight (g) | 898.0±3.3d | 966.6±1.7c | 1052.5±3.6a | 995.7±4.5b |
| Weight Gain (g) | 340.3±3.5d | 408.5±1.6c | 494.4±3.4 a | 437.5±4.4b |
| Mean Weight Gain (g) | 113.4±3.5d | 136.2±1.6c | 164.8±3.4a | 145.8±4.4b |
| % Mean Weight Gain | 20.33c | 24.40b | 29.53a | 29.52a |
| Feed Intake | 420±2.5d | 450±1.9b | 460±3.2a | 430±2.7c |
| Specific Growth Rate | 0.85±0.02d | 0.98±0.01c | 1.13±0.02a | 1.03±0.02b |
| Food Conversion Ratio | 1.27±0.3a | 1.10±0.1b | 0.93±0.1d | 0.98±0.1c |
Table text extracted from the original PDF; superscript letters are shown inline. The original table image is below.
View original table image
Conclusion and Recommendation
The result of the 56 days feeding trial revealed that the dietary powdered pineapple flavour level required for maximum growth of Clarias gariepinus was 2.0% flavour inclusion in soya bean based diet. Experiment with soybean based diet supplement with 2.0% flavour is therefore recommended for fish farmer for optimum growth of Clarias gariepinus. As plant materials are part of the diet of several catfish and other culture species, it would be worthwhile to investigate the importance of other water soluble plant related compounds as attractants and feeding stimulants. Using more than one attractants will help the olfactory sense of the fish and likely be attracted to consume more food and thereby improve the growth rate of fish as the end product of all aquaculture production.
Disclosure Statement
No conflict of interest exists among the authors.
References
33 in the original paper- Adekoya FD. The potential and strategies for optimum utilization of fisheries resources of Nigeria. Journal of applied Aquaculture. 2001;3:44-56.
- Hardy RW. Aquaculture's rapid growth requirements for alternate protein sources. Feed Management. 1999;50(1):25-28.
- Mimako Kobayashi, Siwa Msangi, Miroslav Batka, Stefania Vannuccini, Madan M. Dey, James L. Anderson. Fish to 2030: The Role and Opportunity for Aquaculture, Aquaculture Economics & Management. 2015;19(3):282-300.
- Hardy RW. Utilization of plant proteins in fish diet: Effects of global demand supplies of fish meal. Aquaculture research. 2010;41:770-776.
- Katheline Hua, Jennifer M. Cobcroft, Andrew Cole, Kelly Condon, Dean R. Jerry, Arnold Mangott, et al. "The Future of Aquatic Protein: Implications for Protein Sources in Aquaculture Diets. Review. One Earth. 2019;1(3):316-329.
- Hasan MR, New MB. eds. On-farm feeding and feed management in aquaculture. Rome, FAO. FAO Fisheries and Aquaculture Technical Paper No. 2013;583:67.
- Tacon EB. Global trends and challenges in aquafeeds for marine shrimp. Aquafeed International. 1998;4:2535.
- Tharindu Bandara. Alternative feed ingredients in aquaculture: Opportunities and challenges. Journal of entomology and zoology studies. 2018;6(2):3087-3094.
- Jindal M, Garg SK, Yadava NK, Gupta RK. Effect of replacement of fishmeal with processed soybean on growth performance and nutrient retention in Channa punctatus (Bloch) fingerlings. Livestock Research for Rural Development. 2007;19(11):10.
- Ajiboye OO, Yakubu AF, Adams TE. A perspective on the ingestion and nutritional effects of feed additives in farmed fish species. World Journal of Fish and Marine Sciences. 2012;4(1):87-101.
- Papatryphon E, Soares Jr. JH. The effect of dietary feeding stimulants on growth performance of striped bass, (Morone saxatilis), fed a plant feedstuff-based diet. Aquaculture. 2000;185(3):329-338.
- Hemalatha R, Anbuselvi S. Physicochemical constituents of pineapple pulp and waste. Journal of Chem. Pharm. Res. 2013;5(2):240-242.
- Pardo MES, Cassellis MER, Escobedo RM, García EJ. Chemical characterisation of the industrial residues of the pineapple (Ananas comosus), Journal of Agricultural Chemistry and Environment. 2014;3(2B):53-56. International Journal of Biology Sciences https://www.biologyjournal.net/
- Fasakin EA, Davies SJ, Gadamosi OK. Dietary improvement and utilization efficiencies of maize gluten supplemented with Lysine for Nile Tilapia, (Oreochromis niloticus L.). Journal of Fisheries International. 2006;1(1-2):27-32.
- Ogunji Johnny, Rahat-Ul-Ain, Summan Toor, Carsten Schulz, Werner Kloas. Growth Performance, Nutrient Utilization of Nile Tilapia (Oreochromis niloticus) Fed Housefly Maggot Meal (Magmeal) Diets. Turkish Journal of Fisheries and Aquatic Sciences. 2008;8(1):141-147.
- Boyd CE. Water Quality in warm water fish ponds. Auburn University Experiment station,, Alabama. USA, 1990.
- Molla Malede, Berhanu Abate, Asmamaw Amogne. The effect of soil acidity on some growth-related traits of soybean genotypes. Int. J Res. Agron. 2020;3(2):3541.
- Lucy Towers. Water quality: a priority for successful aquaculture. The Fish Site, 2015. [Online]. Available: https://thefishsite.com/assets/img/logo-hatch-fish.svg.
- Joseph B, Yamakanamardi SM. Monthly changes in the abundance and biomass of zooplankton and water quality parameters in Kukkarahalli Lake of Mysore, India, Journal of Environmental Biology. 2011;32(5):551-557.
- Bhatnagar A, Devi P. Water quality guidelines for the management of pond fish culture. International Journal of Environmental Sciences. 2013;3(6):1980-1993.
- Wurts WA, Durbow RM. Indicators of pH, carbondioxide, Alkalinity and hardness in fish ponds. Southern Regional Aquat. Centre Fact Sheet No. 1992;464:1-4.
- Hussain ME, Shafei. Assessment of some water quality characteristics as guide lines for the management of pond fish culture in Lake Manzala, Egypt. International Journal of Fisheries and Aquatic Studies. 2016;4(2):416-420.
- Tawfik MS. Proximate compositions and fatty acids profiles in most common available fish species in Saudi market. Asian J. Clin. Nutr. 2009;1(1):50-57.
- Manthey-Karl M, Lehmann I, Ostermeyer U, Schröder U. Natural chemical composition of commercial fish species: characterisation of pangasius, wild and farmed turbot and barramundi. Foods. 2016;5(3):58.
- Akpambang VOE. Proximate composition of some tropical fish species. Der Chemica Sinica. 2015;6(4):125-129.
- Sealey WM, Barrows FT, Smith CE, Hardy RW. Dietary supplementation strategies to improve performance of Rainbow Trout fed plant-based diets. Bull. Fish. Res. Agen. 2010;31:15-23.
- Dimitroglou A, Merrifield DL, Spring P, Sweetman J, Moate R, Davies SJ. Effects of mannan oligosaccharide (MOS) supplementation on growth performance, feed utilisation, intestinal histology and gut microbiota of gilthead sea bream (Sparus aurata). Aquaculture. 2010;300(1-4):182-188.
- Torrecillas S, Makol A, Caballero MJ, Montero D, Gine´s R, Sweetman J, Izquierdo MS. Improved feed utilization, intestinal mucus production and immune parameters in sea bass (Dicentrarchus labrax) fed mannan oligosaccharides (MOS). Aquaculture Nutrition. 2011;17(2):223-233.
- Oliveira AM, de Cyrino JE. Attractants in plant protein based diets for the carnivorous largemouth bass (Micropterus salmoides). Sci. Agric. 2004;61(3):326331.
- Dada AA. Effects of herbal growth promoter feed additive in fish meal on the performance of nile tilapia (Oreochromis niloticus L.). Egypt. Acad. J Biolog. Sci. 2012;4(1):111-117.
- Adamu KM, Ahmed IM. Impact of a widely cultivated tree (Moringa oleifera) on the health of commercially important Hybrid Catfish. Pakistan Journal of Scientific and Industrial Research Series B: Biological Sciences. 2014;57(3):155-160.
- Bello NO, Nzeh GC. Effects of varying levels of Moringa oleifera leaf meal diet on growth performance, hematological indices and biochemical enzymes of African catfish Clarias gariepinus (Burchell 1822). Elixir Aquaculture. 2013;57A:14459-14466.
- Hossain MF, Akhtar S, Anwar M. Nutritional value and medicinal benefits of pineapple. International Journal of Nutrition and Food Sciences. DOI: 10.11648/j.ijnfs.20150401.22. 2015;4(1):84-88.