
Research article · 2022 · Full text
International Journal of Agriculture Extension and Social DevelopmentRelationship of adoption gap in recommended pigeon pea practices with socio-economic characteristics of tribal farmers in Narmada district
Volume 5(2) · Pages 01–02 · DOI: 10.33545/26180723.2022.v5.i2a.134 ↗
Research areasAgricultural Economics and PracticesAgricultural Systems and PracticesAgricultural Innovations and Practices
Abstract
Author-writtenThe agricultural technology is generally not adopted by the farmers completely in all respects as such. There always appears a gap between the technology recommended by the scientists and its use at farmer’s level. The study was conducted in Narmada districts of South Gujarat. The primary data was collected from 100 respondents by following personal interview method and using structured interview schedule. This study was objective to ascertain the relationship between selected characteristics pigeon pea growers and their overall adoption gap in recommended pigeon pea practices. In order to realize the objective of the study, 100 farmers were selected from adoptive villages higher areas of pigeon pea growers purposively and random sampling technique pigeon pea had medium adoption gap 68.89 per cent about recommended pigeon pea practices Majority of pigeon pea growers had land holding (0.169),annual income (0.052), risk preference (0.066), scientific orientation (0.301) were negative and significant association with their adoption gap of recommended pigeon pea production technologies, While, education, (0.162),knowledge (0.228) were significantly correlated at 5% level of significance.
Summary
Source-checkedPlain-language reading of the full paper, prepared with AI and checked against the text. Each point links to the authors' own words.
Why it matters
- There is typically a gap between the agricultural technologies recommended by scientists and the actual practices implemented by farmers. View evidence ↗
- India is the world's leading producer of pigeon pea. View evidence ↗
- The Narmada district is characterized by a high tribal population (78%), with 89.6% of residents living in villages and relying on agriculture. View evidence ↗
The question
- The study aimed to determine how specific characteristics of pigeon pea growers relate to the gap in their adoption of recommended farming practices. View evidence ↗
What they did
- The researchers purposively selected five talukas in the Narmada district and used simple random sampling to select 100 pigeon pea growers (10 respondents from two villages per taluka). View evidence ↗
- Primary data was gathered through personal interviews using a structured schedule, supplemented by secondary data from relevant agencies. View evidence ↗
- Data analysis was performed using frequency, percentage, mean, standard deviation, and correlation coefficients. View evidence ↗
What they found
- Among the respondents, 39% were in the middle age category, 17% had secondary-level education, and 46% held medium land holdings (1.1 to 2 ha). View evidence ↗
- Education (0.162) and knowledge (0.228) showed a significant positive correlation with the adoption gap at the 5% significance level. View evidence ↗
- Land holding (0.169), annual income (0.052), risk preference (0.066), and scientific orientation (0.301) were found to have a negative significant association with the adoption gap. View evidence ↗
- Age (-0.007), occupation (-0.0253), and cropping pattern (-0.009) were negatively correlated with the adoption gap, but these results were not statistically significant. View evidence ↗
What it means
- The authors conclude that while education and knowledge have a positive significant relationship with the adoption gap, factors like land holding, income, risk preference, and scientific orientation have a negative significant association. View evidence ↗
Visual summary
2 visualsIllustrations explain the paper; charts are replotted from the paper's own table values.
Factors Influencing Adoption Gap
AI-generated conceptual illustration (pigeon pea plants). It explains the idea and does not show study data.
View source evidence ↗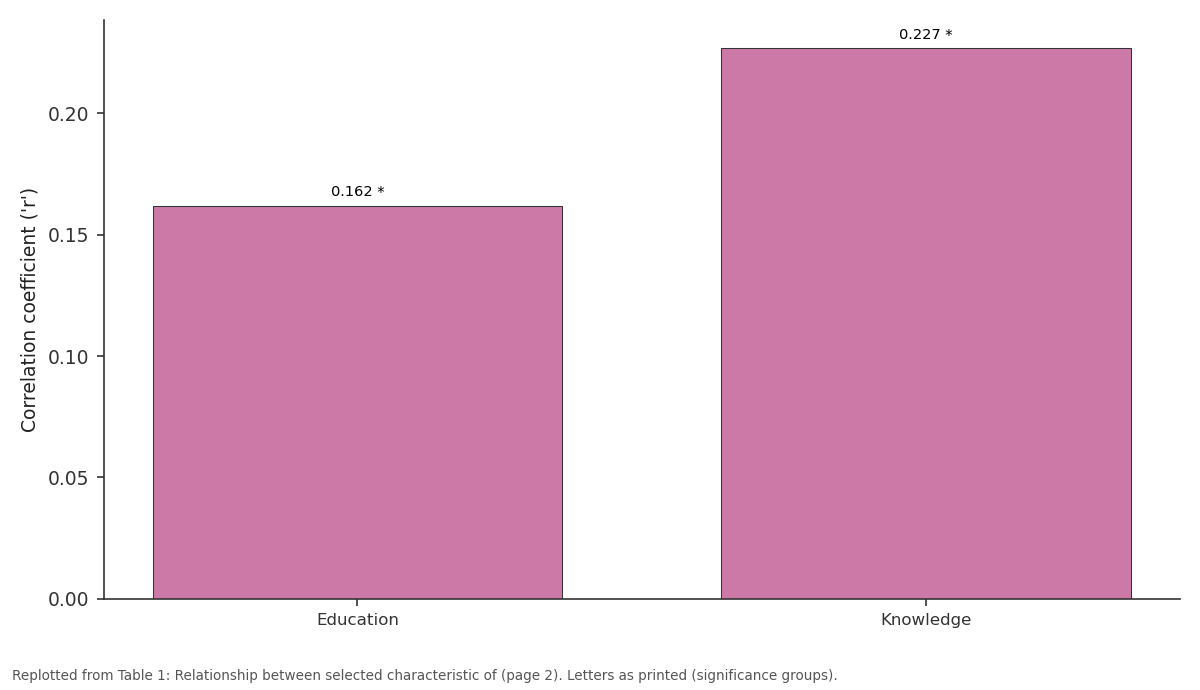
Correlation coefficient ('r'): Education vs Knowledge
Replotted from Table 1 (page 2) of the original paper. Every bar is the paper's own table value.
View source evidence ↗Figures & tables
From the original paper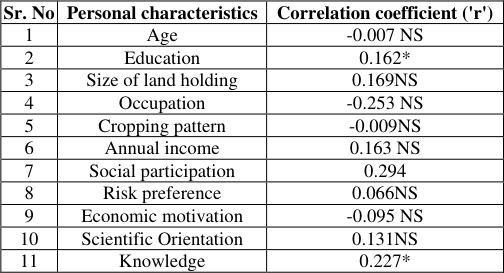 Table 1
Introduction
India is the largest pigeon pea growing country in the world. The area, production and productivity of the pulses in the country are 24.0 million hectare, 25.23 million tonnes and 11 q/ha, respectively. The area, production and productivity of pigeon pea are 350 ha. 40.00 lakh tonnes and 1156 kg/ha, during year 2016-17 our country respectively. Pigeon pea ranks second after chickpea among all the pulses in the country. The area, production and productivity of pigeon pea in Narmada district are 18568 ha, 18382 metric tonnes and 990/ha, respectively. Narmada district is a tribal dominated district with 78% tribal population. The 89.6% of the population resides in the villages and depends on Agriculture. the study area to identified the relationship between selected characteristics pigeon pea growers and their overall adoption gap in recommended pigeon pea practices to work out the following specific objectives. Objective 1. To study the personal profile of selected pigeon pea growers in Narmada District. 2. Find out relationship between selected characteristic of tribal farmers and their adoption gap.
Methodology
The study was be conducted in Narmada district of Gujarat State as it is the jurisdiction of KVK, Dediapada. out of five taluka from Narmada district i.e. Sagbara, Dediapada, Nandod, Tilkwada and Garudeshvar each taluka having highest area pigeon pea growers were purposively selected, 10 respondent from two villages from each taluka, Thus Total of 100 pigeon pea growers by Simple random method, This study was objective to ascertain the relationship between selected characteristics pigeon pea growers and their overall adoption gap in recommended pigeon pea practices. The data were collected with the help of structured schedule by personal interview whereas secondary data were collected from the concerned agencies. Statistical tools such as Frequency, percentage, Mean, Standard deviation, correlation of coefficient were used to analyze the data.
Findings and Discussion
Socio-economic profile of the respondents Socio-economic status of the respondents is an important and integral part of any social science research. The profile study reveals that, half of the respondents (39.00 per cent) belonged to middle age category, majority of the respondents (17.00 per cent) had education up to the secondary level of education, (46.00 per cent) of them had medium (1.1 to 2 ha) land holding, majority of the respondents (46.00 per cent ) tribal hilly area occupied to farming +Animal husbandry, cropping pattern(35.00 per cent) with more than 50.00 per cent respondents belonged to medium categories in following variables, risk preference (49.00 per cent), Economic motivation (40.00 percent), www.extensionjournal.com Scientific Orientation (42.00 percent),social participation (32.00 percent).respectively. The data manifested in Table 1 reveals that land holding (0.169),annual income (0.052), risk preference (0.066), scientific orientation (0.301) of the pigeon pea growers were found to have negative significant association with their adoption gap of recommended pigeon pea production technologies, However, Age (-0.007), occupation (-0.0253) and cropping pattern (-0.009) were negatively nonsignificant correlated with their adoption gap of recommended pigeon pea production technologies While, education,(0.162),knowledge (0.228) were significantly correlated at 5% level of significance. This finding is somewhat in conformity with the findings Sarkar et al. (2002) [1] , Jadhav (2009) [2] , Dharwad et al. (2007) [3] Suranse et al. (2011) [4] , Tengli, MB and Sharma OP (2017) [5] .
| Sr. No | Personal characteristics | Correlation coefficient ('r') |
|---|---|---|
| 1 | Age | -0.007 NS |
| 2 | Education | 0.162* |
| 3 | Size of land holding | 0.169NS |
| 4 | Occupation | -0.253 NS |
| 5 | Cropping pattern | -0.009NS |
| 6 | Annual income | 0.163 NS |
| 7 | Social participation | 0.294 |
| 8 | Risk preference | 0.066NS |
| 9 | Economic motivation | -0.095 NS |
| 10 | Scientific Orientation | 0.131NS |
| 11 | Knowledge | 0.227* |
Table text extracted from the original PDF; superscript letters are shown inline. The original table image is below.
View original table image
Conclusions
Findings of the study presented above can be concluded that the majority of the respondents had medium level of personal profile socio economic tribal farmers. Majority of pigeon pea growers had land holding, annual income, risk preference, scientific orientation were negative and significant association with their adoption gap of recommended pigeon pea production technologies, While, education, knowledge were found positive significant relationship with their adoption gap of recommended pigeon pea production technologies.
References
4 in the original paper- Sarkar JD, Sangode PK, Shrivastava KK. Variables influencing tribal leaders' knowledge and adoption gap for improved paddy cultivation technologies. Gujarat Journal of Extension Education. 2002;12-13:35-38.
- Kapse PS, Pimprikar YK, Dudhate DG. Correlates of technological gap in recommended summer groundnut technology. International Journal of Agricultural Sciences. 2007;3(2):112-115.
- Suranse PK, Ingle PO, Thakare UG. Technological gap in adoption of recommended soybean cultivation practices and its correlates. Financial Agriculture. 2011;45(10):24-27.
- Tengli MB, Sharma OP. Technological gap in adoption of improved paddy cultivation practices International Journal of Current Microbiology and Applied Sciences. 2017;6(11):1224-9.