
Research article · 2023 · Full text
International Journal of Agriculture Extension and Social DevelopmentFarmers’ knowledge, perceptions and management of major insect pests of potato at Kavrepalanchok, Nepal
Volume 6(1) · Pages 31–36 · DOI: 10.33545/26180723.2023.v6.i1a.168 ↗
Research areasAgricultural Economics and PracticesAgricultural Practices and Plant Genetics
Abstract
Author-writtenOut of the 13 municipalities in the district, four (Banepa, Panauti, Panchkhal and Mandandeupur) were chosen based on their higher production potential, and 25 households from each of the four municipalities were then randomly chosen, yielding a sample size of 100. We used both primary and secondary data collection methods. According to the findings, the disease is one of the top five primary issues facing farmers in the research area, with an index value of 0.818. Information level was divided into four categories: 0, 1, 2, 3 and 4, respectively, denoting lack of knowledge, knowledge about one insect pest, knowledge about two insect pests, knowledge about three insect pests, and knowledge about four or more insect pests. In the study area, the majority of farmers (33%) were found to be knowledgeable of 2 insect pests. The majority of farmers (67%) thought the potato tuber moth was the worst problem. The majority of farmers (42%) thought that insect pests only had a minimal impact on plant populations (about 40%). The majority of farmers (44%) believed that insect pests had only slightly harmed (40% area affected) their fields or stores. The majority of farmers (71%) said chemical methods were the most effective for controlling insect pests. The majority of farmers (50.6%) were found to apply the recommended dose of chemical pesticides for insect pest management. The majority of farmers (51%) thought that the proliferation of insect pests was on the decline.
Summary
Source-checkedPlain-language reading of the full paper, prepared with AI and checked against the text. Each point links to the authors' own words.
Why it matters
- Agriculture is a critical driver of Nepal's economy, providing employment for nearly 54% of the population. View evidence ↗
- Potatoes are a major food crop in Nepal, contributing 6.57% to the agricultural GDP and 2.17% to the total GDP. View evidence ↗
- Pest-induced crop losses prevent the population from achieving food self-sufficiency. View evidence ↗
The question
- The study aimed to evaluate the knowledge, perceptions, and management practices of farmers regarding potato insect pests in the Kavrepalanchok district. View evidence ↗
What they did
- The research focused on four municipalities in the Kavrepalanchok district: Panchkhal, Banepa, Mandandeupur, and Panauti, selected for their high potato production potential. View evidence ↗
- A total of 100 households were selected using stratified simple random sampling, with 25 households chosen from each of the four municipalities. View evidence ↗
- Data were analyzed using Microsoft Excel and SPSS, employing descriptive statistics, chi-square tests, and one-way ANOVA. View evidence ↗
What they found
- The most common knowledge level among farmers was the ability to name two insect pests along with their morphology and damage symptoms (33%). View evidence ↗
- The majority of farmers (67%) identified the Potato Tuber Moth as the most serious insect pest. View evidence ↗
- A plurality of farmers (41%) perceived the severity of insect pests to be minor. View evidence ↗
- Chemical pest management is perceived as the most effective method by 71% of the farmers. View evidence ↗
- Slightly over half of the farmers (50.6%) reported using the recommended dose of chemical pesticides. View evidence ↗
- A majority of farmers (53%) believe that the spread of insect pests is decreasing. View evidence ↗
What it means
- The authors conclude that the perceived decrease in insect pest spread is likely due to improved management practices resulting from training and extension services. View evidence ↗
- While farmers prefer chemical methods for their efficiency and ease of use, they are aware of the negative impacts these chemicals have on the environment and human health. View evidence ↗
Visual summary
1 visualsIllustrations explain the paper; they do not show study data.
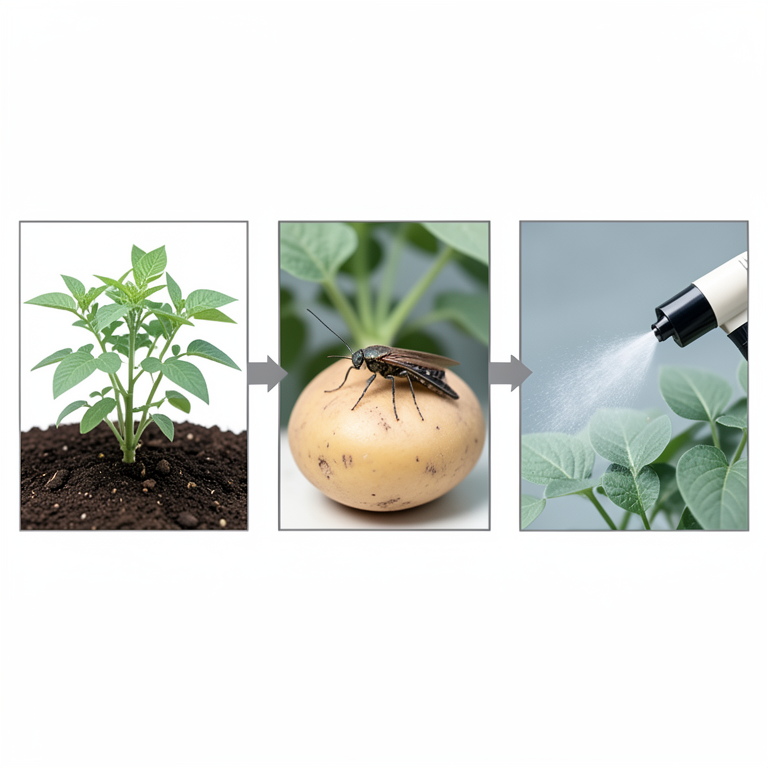
Conceptual Framework of Farmer Perceptions
AI-generated conceptual illustration (potato plants and potato tuber moths). It explains the idea and does not show study data.
View source evidence ↗Figures & tables
From the original paper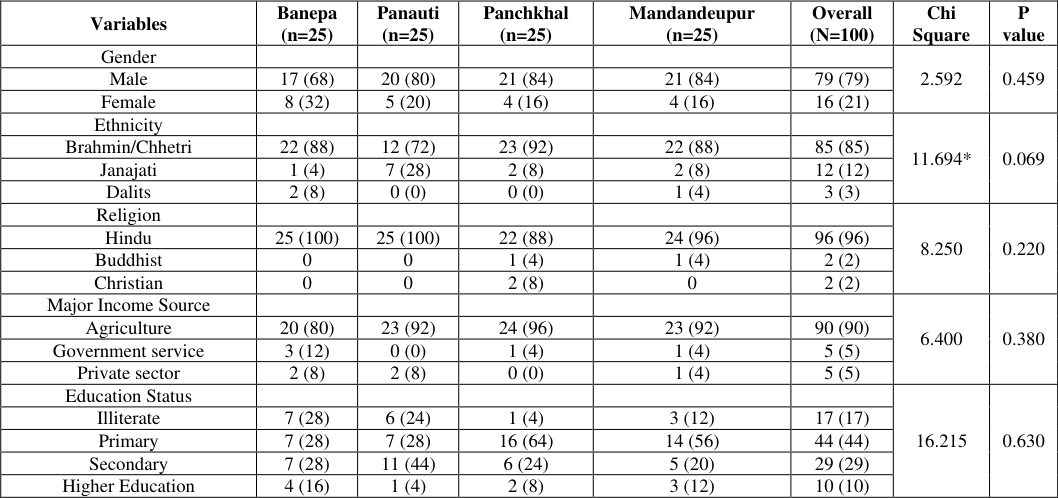 Table 2
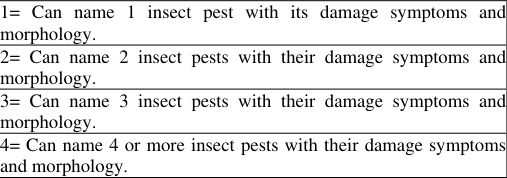 Table 1
 Table 3
 Table 4
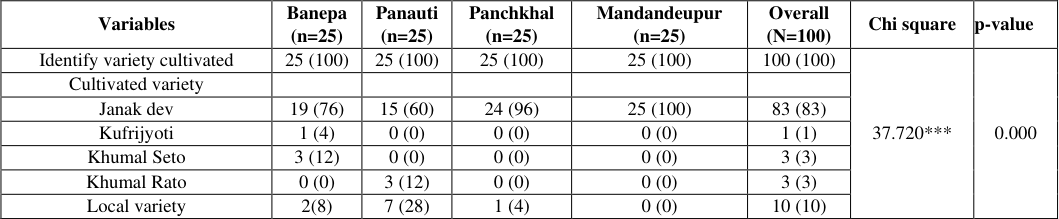 Table 5
 Table 6
 Table 7
 Table 8
 Table 9
 Table 10
 Table 11
 Table 12
Introduction
The potato (Solanum tuberosum) is an annual herbaceous crop that yields tubers. It's a member of the Solanaceae family. China produces more potatoes than any other country in the world, with Nepal coming in at number 24. (FAOSTAT, 2016) [2] . Agriculture has profoundly influenced Nepal's economy (Tripathi, S., Shah, K. K., Tiwari, I., & Shrestha, J., 2020) [10] . Farming employs nearly 54% of the population (Adhikari, 2017). The potato (Solanum tuberosum) is an annual herbaceous crop that yields tubers. It's a member of the Solanaceae family. It comes in at number four as a significant food crop. AGDP contributes to 24.26% of the total GDP of Nepal (STATISTA, 2019) [8] and the contribution of potato on AGDP is 6.57% and on the total GDP is 2.17% (Timsina, K.P., Kafle, K., Sapkota, S., 2013) [11] . With an average annual per capita consumption of 30 kg in Nepal's mid-and high-hills, potatoes are one of the country's major food crops (Ojha, D.N., Hidalgo, O.A., & Lama, T.L., 2001) [4] . So from an economic point of view and consumption point of view potato is an important crop in the case of Nepal. Even so, due to crop losses caused by pests, the population's food supply could not reach self-sufficiency (Seddon, D., Adhikari, J., & Gurung, G., 2002) [7] . One of the worst insect pests of potatoes in Nepal is the potato tuber moth (Pthorimaea opercullela) (Panciotto-Hediger, 1985). Other significant insect pests of potatoes in Nepal are White grub (Anomala spp.), Red ants (Dorylus orientalis), Cutworms (Agrotis ipsilon), Semi-looper (Thysanoplusia orichalcea), Potato Leaf miner (Lyriomyza spp.), and Aphids (Myzus persicae). (Panta, 2074/75) [6] . Farmers get exposed to toxic pesticides by eating while spraying, entering freshly sprayed fields, inhalation, and direct contact with the skin with any form (liquid, powder, or aerosol) of pesticides (Okello, J.J., Swinton, S.M., 2010) [5] and in developing country like Nepal farmers are not that much careful to avoid exposing themselves to such chemicals directly.
Materials and Methods
The study was carried out in the hilly Kavrepalanchok district in Nepal. Four of its thirteen municipalities, namely Panchkhal, Banepa, Mandandeupur and Panauti, were chosen because they had the most potential for producing potatoes in the district. From each of the four municipalities, 25 households were chosen, yielding a total sample size of 100. Following the population list compiled from the preliminary survey, stratified simple random sampling was conducted. Software such as Microsoft Excel and statistical tools for social science was used for data analysis (SPSS). Estimates were made for descriptive statistics such as frequency count and percentage. Additionally, tests using the chi-square and one-way ANOVA were conducted. Using the Chi-square test for categorical variables across 4 municipalities, data analysis was done to determine the associations between variables across the 4 selected municipalities. One-way www.extensionjournal.com ANOVA tests were used to evaluate the mean differences of variables across a number of chosen municipalities for continuous variables. 2= Can name 2 insect pests with their damage symptoms and morphology. 3= Can name 3 insect pests with their damage symptoms and morphology. 4= Can name 4 or more insect pests with their damage symptoms and morphology.
Knowledge level scoring
Knowledge level scoring
Results and Discussion
Results and Discussion
Socio-economic and demographic status
Out of 100 respondents, 79% of them were men. It was determined that there was no significant difference in the gender composition across the four municipalities. Brahmin/Chhetris made up the majority of responders (85%), followed by Janajatis (12%) and Dalits (3%). Panchkhal had the largest percentage of Brahmin/Chhetri inhabitants (92%). Panauti (28%) has the highest proportion of Janajati. At Banepa, the percentage of Dalits was the highest (8%). At the 10% level of significance, the distribution of the population by ethnicity across the four municipalities was found to be statistically significant. In the study area, Hinduism (96%) emerged as the most prevalent religion, followed by Buddhism (2% each) and Christianity (2% each). It was found that the distribution of religions among the municipalities did not differ significantly. Agriculture provided 90% of the household income in the survey area, followed by government and private sector employment, each of which contributed 5%. It was determined that there was no significant variation in the four municipalities' sources of income. In terms of the study area's educational standing, 44% of respondents had completed their elementary education, 29% had completed their secondary school, 17% were illiterate, and 10% had completed their higher education. It was determined that there was no significant difference in educational attainment across the four municipalities. The study area's average household head age was found to be 43.29 years old. The average age was found to be highest in Banepa, where it was 47.04 years (6.031), followed by Panauti, 44.76 years (10.333), Panchkhal, 43.40 years (7.767), and Mandandeupur, 37.96 years (6.195). At the 1% level of significance, it was discovered that the difference in average age between the four municipalities was significant. 5.29 families made up the average family in the research area (1.499). Banepa had the largest average family size, which was 5.84. (1.098). The average family size in the four municipalities was found to be non-significantly different. 3.81 (1.116) people on average were found to be economically active per family. The average number of economically active people per family in Banepa was the highest, coming in at 4.2 (1.500). The average number of people who are economically active per family throughout the four municipalities was found to be non-significant. It was discovered that the study area's average dependency ratio was 0.3868. (0.28388). the average dependency ratios for Panchkhal, Banepa, and Mandandeupur were found to be 0.4153 (0.31354), 0.3929 (0.24565), 0.3787 (0.28862), and 0.3868 (0.28838), respectively. The average dependency ratio among the 4 municipalities did not differ significantly. www.extensionjournal.com Of the farmers surveyed from each municipality, 100% were able to identify the cultivated variety. Eighty-three percent (83%) of farmers grew the Janakdev variety, ten percent (10) grew local varieties, three percent (%) grew each of the Khumal Seto and Khumal Rato types, and one percent (%) grew the Kufri Jyoti variety. 100% (25) of the farmers in Mandandeupur farmed the Janakdev variety. At Panchkhal, local varieties were grown by 4% (1) of the farmers and the Janakdev variety by 96% (24) of the farmers. At Banepa, 76% (19) of farmers grew Janakdev varieties, 12% (3) grew Khumal Seto varieties, and 8% (2) grew local varieties. 60% (15) of the farmers in Panauti grew the Janakdev variety, 28% (7) grew the local variety, and 12% (3) grew the Khumal Rato variety. At the 1% level of significance, it was discovered that there was a significant difference between the cultivated varieties in the 4 municipalities.
Farmers' knowledge level of insect pests
Farmers who can name 2 insect pests with their damage symptoms and morphology were found higher (33%). Farmers who can name 1 insect pest with its damage symptoms and morphology were found higher at Panauti, Panchkhal and Mandandeupur (4%). Farmers who can name 2 insect pests with their damage symptoms and morphology were found higher at Panauti (52%). Farmers who can name 3 insect pests with their damage symptoms and morphology were found higher at Panchkhal (48%). Farmers who can name 4 or more insect pests with their damage symptoms and morphology were found higher at Banepa (72%). The result was found statistically significant at 1% level of significance.
Perception of the most severe insect pest
The Potato Tuber Moth was deemed the most serious insect pest by the majority of farmers (67%). Farmers who thought aphids (24%) and root grubs (4%) were the most severe were found to be more prevalent at Banepa. Farmers who consider Potato Tuber Moth to be the most severe insect pest were found in greater numbers (96%) in Panchkhal, while those who consider Semi-loopers to be the most severe were found in greater numbers (24%) in Banepa. At the 1% level of significance, the result was found to be statistically significant.
Perception of severity of insect pests
Farmers who believe the severity of insect pests is minor are found to be more likely (41%). Farmers who perceive insect pest severity to be major were found to be more prevalent in Panchkhal (40%), those who perceived insect pest severity to be moderate were found to be more prevalent in Mandandeupur (52%) and those who perceived insect pest severity to be minor were found to be more prevalent in Banepa (76%). At the 1% level of significance, the result was found to be statistically significant.
) Notes: ***indicate significant difference at 1% level of significance and figures in parenthesis represent percentages. 1=Major (> 60% plant affected) 2=Moderate (40-60% plant affected) 3=Minor (<40% plant affected)
Perception of effectiveness of insect pest management practices:
Farmers who perceive their management practices for insect pest management as being effective were found higher (65%). The result was found statistically nonsignificant.
Farmers' perception of the best management practice for insect pests
Farmers who believe in chemical pest management were found to be more likely (71%). Farmers who perceive physical/cultural methods to be the best management practice for insect pest management were found to be more prevalent (44%) in Banepa, while those who perceive biological management methods to be superior (24%) in Mandandeupur and those who perceive chemical management methods to be superior (92%) in Panchkhal. At the 1% level of significance, the result was found to be statistically significant.
Doses of chemical pesticide to control insect pest
Farmers who use the recommended pesticide dose for insect pest management were found higher (50.6%). Farmers who use less than the recommended dose of pesticide were found to be more prevalent (61.5%) in Banepa. Farmers who use the recommended dose of pesticide for insect pest management were found to be more prevalent in Panchkhal (60%), while farmers who use more than the recommended dose of pesticide for insect pest management were found to be more prevalent in Panauti (38.1%). At the 5% level of significance, the result was found to be statistically significant.
Farmers perception of extent of insect pest Spread
Farmers who believe the extent of insect spread is decreasing are more likely to be found (53%). Farmers who believe the extent of insect pest spread is decreasing were found to be more prevalent (32%) in Panchkhal, while those who believe it is increasing were found to be more prevalent (76%) in Banepa and those who believe it is decreasing were found to be more prevalent (44%) in Mandandeupur. At the 1% level of significance, the result was found to be statistically significant.
Conclusion
The study was conducted to determine farmers' knowledge, perceptions of potato insect pests, and management methods used to address these issues. The research was carried out in the district of Kavrepalanchok. Four municipalities in the Kavrepalanchok district were chosen based on their production potential, and 25 respondents from each municipality were chosen at random for data collection. Using MS Excel and SPSS software, the results were drawn using descriptive analysis and various statistical tests such as the chi-square test and the one-way ANOVA test. Farmers were asked to name insects based on their morphology and damage symptoms to assess their knowledge level regarding insect pest identification. In the study area, the majority of farmers (33%) were familiar with two insect pests. Potato Tuber Moth (PTM) was found to be the most severe insect pest for the majority (67%) of farmers in the study area. When it comes to insect pest severity, the majority of farmers (42% each) believe it is minor (40% plant population affected). For insect pest management, the majority of farmers (71%) believe that chemical methods are the most effective. They claimed that chemical management is easier to implement, takes less time, and is more effective at disease and pest control. However, they appeared to be well aware of the negative effects of chemical management methods on human health and the environment. Farmers' use of chemical pesticides was investigated in terms of pesticide dosage. The majority of farmers (50.6%) used the recommended dose of chemical pesticides for insect pest management. Farmers were also questioned on their perceptions of the extent of insect pest spread in comparison to previous years. The majority of farmers (51%) believe the extent of insect pest spread is decreasing. They believed this was due to farmers receiving insect pest management training and extension services, which resulted in better application of management practices, thereby reducing the extent of insect spread.
Figures and tables from the paper
| Variables | Banepa (n=25) | Panauti (n=25) | Panchkhal (n=25) | Mandandeupur (n=25) | Overall (N=100) | Chi Square | P value |
|---|---|---|---|---|---|---|---|
| Gender | 2.592 | 0.459 | |||||
| Male | 17 (68) | 20 (80) | 21 (84) | 21 (84) | 79 (79) | ||
| Female | 8 (32) | 5 (20) | 4 (16) | 4 (16) | 16 (21) | ||
| Ethnicity | 11.694* | 0.069 | |||||
| Brahmin/Chhetri | 22 (88) | 12 (72) | 23 (92) | 22 (88) | 85 (85) | ||
| Janajati | 1 (4) | 7 (28) | 2 (8) | 2 (8) | 12 (12) | ||
| Dalits | 2 (8) | 0 (0) | 0 (0) | 1 (4) | 3 (3) | ||
| Religion | 8.250 | 0.220 | |||||
| Hindu | 25 (100) | 25 (100) | 22 (88) | 24 (96) | 96 (96) | ||
| Buddhist | 0 | 0 | 1 (4) | 1 (4) | 2 (2) | ||
| Christian | 0 | 0 | 2 (8) | 0 | 2 (2) | ||
| Major Income Source | 6.400 | 0.380 | |||||
| Agriculture | 20 (80) | 23 (92) | 24 (96) | 23 (92) | 90 (90) | ||
| Government service | 3 (12) | 0 (0) | 1 (4) | 1 (4) | 5 (5) | ||
| Private sector | 2 (8) | 2 (8) | 0 (0) | 1 (4) | 5 (5) | ||
| Education Status | 16.215 | 0.630 | |||||
| Illiterate | 7 (28) | 6 (24) | 1 (4) | 3 (12) | 17 (17) | ||
| Primary | 7 (28) | 7 (28) | 16 (64) | 14 (56) | 44 (44) | ||
| Secondary | 7 (28) | 11 (44) | 6 (24) | 5 (20) | 29 (29) | ||
| Higher Education | 4 (16) | 1 (4) | 2 (8) | 3 (12) | 10 (10) |
Table text extracted from the original PDF; superscript letters are shown inline. The original table image is below.
View original table image
| Variables | Banepa (n=25) | Panauti (n=25) | Panchkhal (n=25) | Mandandeupur (n=25) | Overall (N=100) | F value | P value |
|---|---|---|---|---|---|---|---|
| Age of Household head | 47.04 (6.301) | 44.76 (10.333) | 43.40 (7.767) | 37.96 (6.195) | 43.29 (8.409) | 6.069*** | 0.001 |
| Family size | 5.84 (1.908) | 5.12 (1.124) | 5.28 (1.429) | 4.92 (1.038) | 5.29 (1.499) | 1.777 | 0.157 |
| Economically active population | 4.20 (1.500) | 3.72 (0.936) | 3.64 (1.075) | 3.68 (0.802) | 3.81 (1.116) | 1.394 | 0.249 |
| Dependency Ratio | 0.3929 (0.24565 | 0.3787 (0.28862) | 0.4153 (0.31354) | 0.3613 (0.29937) | 0.3868 (0.28388) | 0.154 | 0.927 |
Table text extracted from the original PDF; superscript letters are shown inline. The original table image is below.
View original table image
| Variables | Banepa (n=25) | Panauti (n=25) | Panchkhal (n=25) | Mandandeupur (n=25) | Overall (N=100) | F value | P value |
|---|---|---|---|---|---|---|---|
| Area of production (Ha) | 0.4579 (0.25052) | 0.3948 (0.27991) | 0.4029 (0.16015) | 0.3663 (0.15680) | 0.4055 (0.21794) | 0.767 | 0.515 |
| Productivity (MT/Ha) | 21.9054 (5.57121) | 17.1918 (0.39574) | 23.2007 (1.41218) | 23.2553 (2.23572) | 21.3888 (14.03504) | 1.044 | 0.377 |
Table text extracted from the original PDF; superscript letters are shown inline. The original table image is below.
View original table image
| Variables | Banepa (n=25) | Panauti (n=25) | Panchkhal (n=25) | Mandandeupur (n=25) | Overall (N=100) | Chi square | p-value |
|---|---|---|---|---|---|---|---|
| Identify variety cultivated | 25 (100) | 25 (100) | 25 (100) | 25 (100) | 100 (100) | 37.720*** | 0.000 |
| Cultivated variety | |||||||
| Janak dev | 19 (76) | 15 (60) | 24 (96) | 25 (100) | 83 (83) | ||
| Kufrijyoti | 1 (4) | 0 (0) | 0 (0) | 0 (0) | 1 (1) | ||
| Khumal Seto | 3 (12) | 0 (0) | 0 (0) | 0 (0) | 3 (3) | ||
| Khumal Rato | 0 (0) | 3 (12) | 0 (0) | 0 (0) | 3 (3) | ||
| Local variety | 2(8) | 7 (28) | 1 (4) | 0 (0) | 10 (10) |
Table text extracted from the original PDF; superscript letters are shown inline. The original table image is below.
View original table image
| Variables | Banepa (n=25) | Panauti (n=25) | Panchkhal (n=25) | Mandandeupur (n=25) | Overall (N=100) | Chi square | p-value |
|---|---|---|---|---|---|---|---|
| Knowledge Level | 30.780*** | 0.000 | |||||
| 1. | 0 (0) | 1 (4) | 1 (4) | 1 (4) | 3 (3) | ||
| 2. | 1 (4) | 13 (52) | 8 (32) | 11 (44) | 33(33) | ||
| 3. | 6(24) | 6 (24) | 12 (48) | 8 (32) | 32 (32) | ||
| 4. | 18 (72) | 5 (20) | 4(16) | 5 (20) | 32 (32) |
Table text extracted from the original PDF; superscript letters are shown inline. The original table image is below.
View original table image
| Variables | Banepa (n=25) | Panauti (n=25) | Panchkhal (n=25) | Mandandeupur (n=25) | Overall (N=100) | Chi square | p-value |
|---|---|---|---|---|---|---|---|
| Most severe insect pest | 45.156*** | 0.000 | |||||
| Aphids | 6 (24) | 0 (0) | 0 (0) | 0 (0) | 6 (6) | ||
| Root Grubs | 1 (4) | 9 (36) | 1 (4) | 4 (16) | 15 (15) | ||
| Potato Tuber Moth | 12 (48) | 11 (44) | 24 (96) | 20 (80) | 67 (67) | ||
| Semi-loopers | 6 (24) | 5 (20) | 0 (0) | 1 (4) | 12 (12) |
Table text extracted from the original PDF; superscript letters are shown inline. The original table image is below.
View original table image
| Variables | Banepa (n=25) | Panauti (n=25) | Panchkhal (n=25) | Mandandeupur (n=25) | Overall (N=100) | Chi square | p-value |
|---|---|---|---|---|---|---|---|
| Severity | 26.304*** | 0.000 | |||||
| 1. | 2 (8) | 3 (12) | 10 (40) | 4 (16) | 19 (19) | ||
| 2. | 4 (16) | 11 (44) | 12 (48) | 13 (52) | 40 (40) | ||
| 3. | 19 (76) | 11 (44) | 3 (12) | 8 (32) | 41 (41) |
Table text extracted from the original PDF; superscript letters are shown inline. The original table image is below.
View original table image
| Variables | Banepa (n=25) | Panauti (n=25) | Panchkhal (n=25) | Mandandeupur (n=25) | Overall (N=100) | Chi square | P value |
|---|---|---|---|---|---|---|---|
| Effectiveness | 2.593 | 0.459 | |||||
| Effective | 17 (68) | 14 (56) | 15 (60) | 19 (76) | 65 (65) | ||
| Fair | 8 (32) | 11 (44) | 10 (40) | 6 (24) | 35 (35) |
Table text extracted from the original PDF; superscript letters are shown inline. The original table image is below.
View original table image
| Variables | Banepa (n=25) | Panauti (n=25) | Panchkhal (n=25) | Mandandeupur (n=25) | Overall (N=100) | Chi square | P value |
|---|---|---|---|---|---|---|---|
| Management Practices | 29.097*** | 0.000 | |||||
| Physical | 11 (44) | 8 (32) | 1 (4) | 2 (8) | 22 (22) | ||
| Biological | 0 (0) | 0 (0) | 1(1) | 6 (24) | 7 (7) | ||
| Chemical | 14 (56) | 17 (68) | 23 (92) | 17 (68) | 71 (71) |
Table text extracted from the original PDF; superscript letters are shown inline. The original table image is below.
View original table image
| Variables | Banepa (n=13) | Panauti (n=21) | Panchkhal (n=25) | Mandandeupur (n=20) | Overall (N=59) | Chi square | p-value |
|---|---|---|---|---|---|---|---|
| Doses | 13.766** | 0.032 | |||||
| 1. | 8 (61.5) | 3 (14.3) | 4(16) | 4 (20) | 19 (19) | ||
| 2. | 4(30.8) | 10 (47.6) | 15 (60) | 11 (55) | 40 (50.6) | ||
| 3. | 1 (7.7) | 8 (38.1) | 6 (24) | 5 (25) | 20 (25.3) |
Table text extracted from the original PDF; superscript letters are shown inline. The original table image is below.
View original table image
| Variables | Banepa (n=25) | Panauti (n=25) | Panchkhal (n=25) | Mandandeupur (n=25) | Overall (N=100) | Chi square | p-value |
|---|---|---|---|---|---|---|---|
| Extent | 20.382*** | 0.002 | |||||
| Increasing | 0 (0) | 1 (4) | 8 (32) | 2 (8) | 11 (11) | ||
| Decreasing | 19 (76) | 14 (56) | 8 (32) | 12 (48) | 53 (53) | ||
| Same | 6 (24) | 10 (40) | 9 (36) | 11 (44) | 36 (36) |
Table text extracted from the original PDF; superscript letters are shown inline. The original table image is below.
View original table image
References
7 in the original paper- Adhikari PR. An overview of pesticide management in Nepal. Journal of Agriculture and Environment. 2017;18:95-105.
- Haverkort AJ, Struik PC, Visser RGF, Jacobson EJPR. Applied biotechnology to combat late blight in potato caused by Phytophthora infestans. Potato Research. 2009;52:249-264.
- Okello JJ, Swinton SM. From circle of poison to circle of virtue: pesticides, export standards and Kenya's green bean farmers. Journal of Agricultural Economics. 2010;61(2):209-224.
- Seddon D, Adhikari J, Gurung G. Foreign labor migration and the remittance economy of Nepal. Critical Asian Studies. 2002;34(1):19-40.
- H. Plecher. Statista. Nepal: Distribution of gross domestic product (GDP) across economic sectors from 2009; c2019.
- Muddebihal S, Chandrashekar GS, Ramegowda GK, Patil SV, Amarananjundeswara H, Krishna HC, et al. Studies on impact of storage materials and methods on potato tuber moth, Phthorimaea operculella Zeller (Lepidoptera: Gelechiidae) on potato. Int. J. Biol. Sci. 2021;3(2):53-56. DOI: 10.33545/26649926.2021.v3.i2a.135
- Tripathi S, Shah KK, Tiwari I, Shrestha J. Farmers' perception about major insect pests of cucurbits and their management. Indonesian Journal of Agricultural Research. 2020;3(3):153-170.