
Research article · 2023 · Full text
International Journal of Agriculture Extension and Social DevelopmentProfile of dairy farm women with their training needs
Volume 6(1) · Pages 28–30 · DOI: 10.33545/26180723.2023.v6.i1a.167 ↗
Research areasLivestock Management and Performance ImprovementAgricultural Systems and PracticesAgricultural Economics and Practices
Abstract
Author-writtenThe present study was conducted in Marathwada region of Maharashtra state during the year 2021-22 with the objective to study “Training needs of dairy farm women in dairy farming.” One districts namely Hingoli was selected randomly from Marathwada region. Four talukas from each selected district and three villages from each talukas were selected randomly for the study. From each selected village, ten farmers those having cows, buffaloes, goat and other dairy animals were selected randomly, in this way total 120 respondents were considered for the study. The detailed analysis of profile characteristics of farm women indicated that majority of the farm women were medium aged (63.34%), educated up to middle school level (33.43%), joint family type (72.50%), medium size family (76.67%), majority of married women (79.17%), medium herd size (67.50%), majority of occupation is agriculture and livestock (66.68%), medium dairying experience (76.67%), medium level of annual income i.e. Rs. 76,489 to Rs. 3,05,678 (78.34%), medium social participation (75.83%), medium extension contact (64.17%), medium mass media exposure (54.17%), medium economic motivation (61.00%).
Summary
Source-checkedPlain-language reading of the full paper, prepared with AI and checked against the text. Each point links to the authors' own words.
Why it matters
- Livestock farming is a critical part of India's agricultural sector, providing socio-economic support for the rural poor. View evidence ↗
- Indian dairy farming often remains traditional because older farmers are frequently reluctant to adopt modern technologies. View evidence ↗
- Young people aged 15 to 35 make up 40% of India's population and are seen as a key resource for driving development. View evidence ↗
The question
- The study aimed to identify the training needs of women engaged in dairy farming within the Marathwada region of Maharashtra during 2021-22. View evidence ↗
What they did
- The researchers randomly selected the Hingoli district, four talukas within that district, and three villages per taluka. View evidence ↗
- The study employed an ex-post-facto research design and collected data via a structured interview schedule. View evidence ↗
- Data analysis was performed using frequency, percentage, mean, standard deviation, and coefficient correlation. View evidence ↗
What they found
- The majority of farm women (62.34%) were middle-aged, while 20.00% were young and 16.66% were old. View evidence ↗
- Education levels varied, with the largest group (33.43%) educated to middle school, followed by primary school (30.84%) and high school (15.84%). View evidence ↗
- Most participants (72.50%) lived in joint families, compared to 27.50% in nuclear families. View evidence ↗
- The majority of respondents (76.67%) had medium-sized families, while 19.17% had large families and 4.16% had small families. View evidence ↗
- Most women (67.50%) managed a medium herd size of 5 to 10 animals, with 19.17% having low and 13.33% having high herd sizes. View evidence ↗
- A significant majority (66.68%) of the women were involved in both agriculture and livestock farming. View evidence ↗
- Most women (76.67%) had medium dairying experience, while 13.33% had low and 10.00% had high experience. View evidence ↗
- The majority of respondents (78.34%) fell into the medium annual income category. View evidence ↗
- Most women (75.83%) showed medium social participation, with 14.17% high and 10.00% low. View evidence ↗
- Medium level extension contact was most common (64.17%), followed by high (20.00%) and low (15.83%) levels. View evidence ↗
- The majority of women (54.17%) had medium mass media exposure, while 23.34% had high and 22.50% had low exposure. View evidence ↗
- Most women (61.00%) exhibited medium economic motivation, with 21.00% high and 18.00% low. View evidence ↗
What it means
- The authors conclude that the typical dairy farm woman in this region is middle-aged, middle-school educated, lives in a joint medium-sized family, is married, manages a medium herd, and possesses medium levels of experience, income, extension contact, media exposure, and economic motivation. View evidence ↗
Visual summary
3 visualsIllustrations explain the paper; charts are replotted from the paper's own table values.
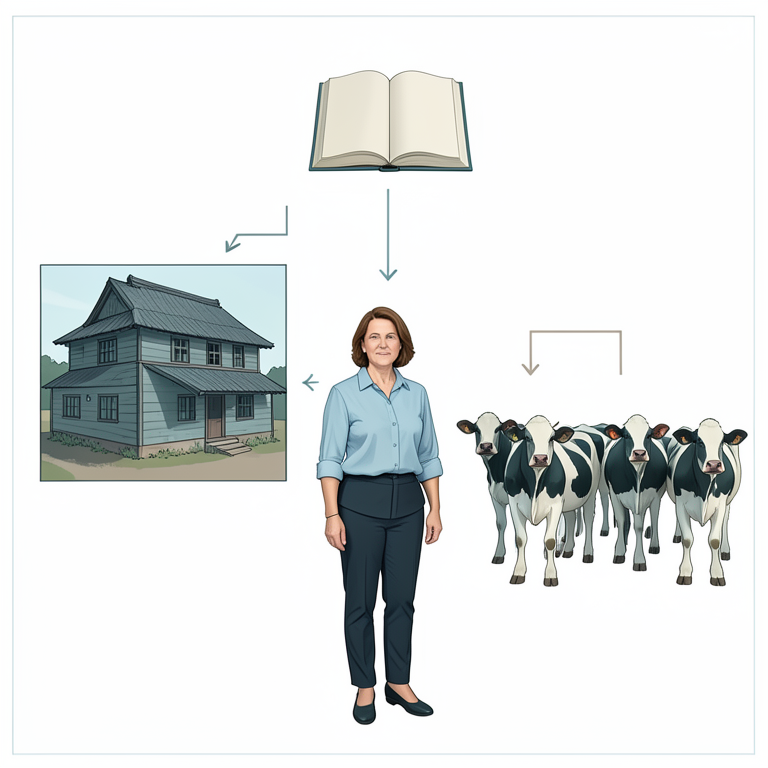
Profile of a Typical Dairy Farm Woman
AI-generated conceptual illustration (Middle-aged dairy farm woman and her rural farm environment). It explains the idea and does not show study data.
View source evidence ↗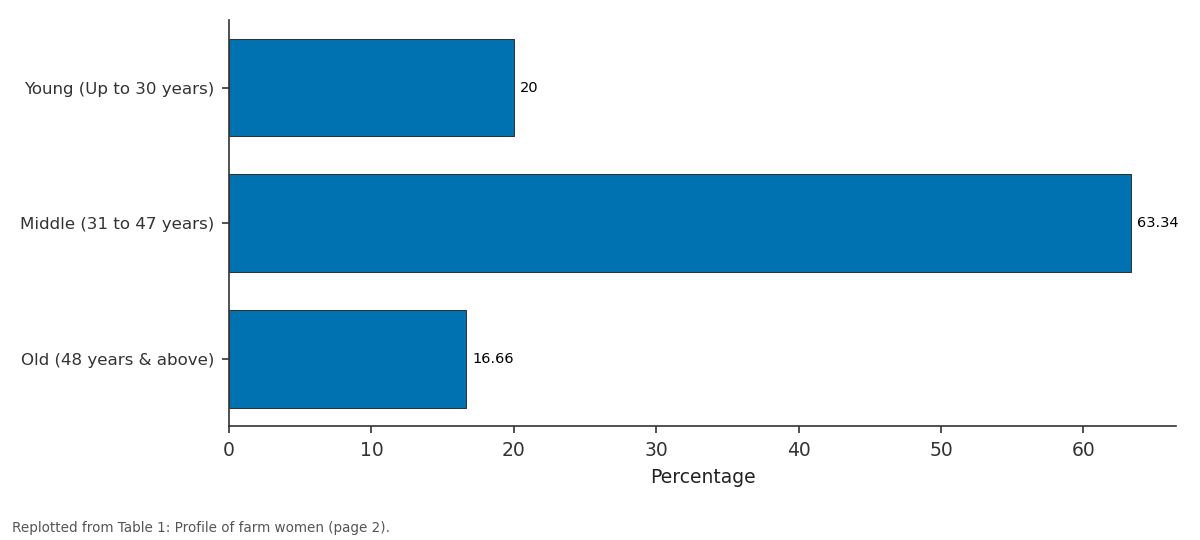
Percentage: Young (Up to 30 years) vs Middle (31 to 47 years) vs Old (48 years & above)
Replotted from Table 1 (page 2) of the original paper. Every bar is the paper's own table value.
View source evidence ↗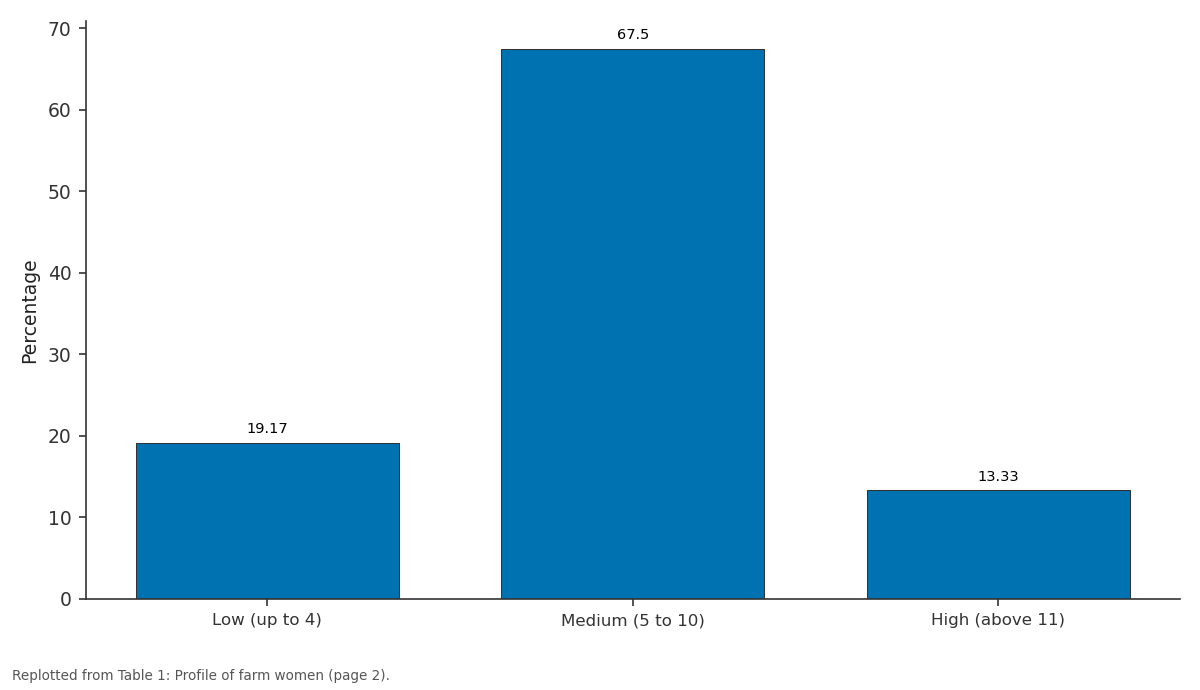
Percentage: Low (up to 4) vs Medium (5 to 10) vs High (above 11)
Replotted from Table 1 (page 2) of the original paper. Every bar is the paper's own table value.
View source evidence ↗Figures & tables
From the original paper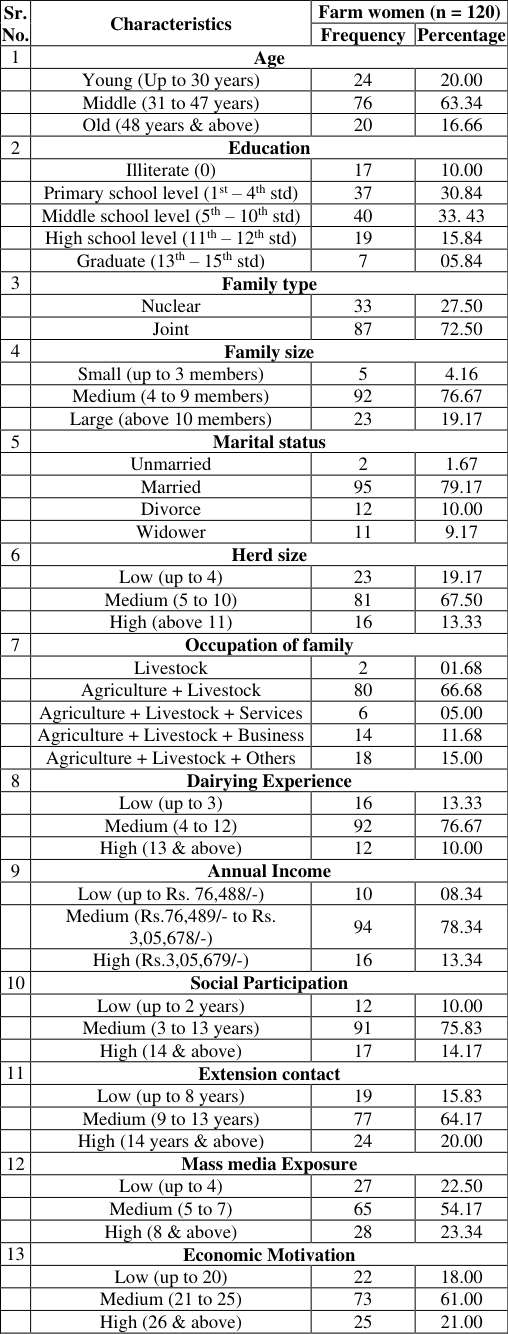 Table 1
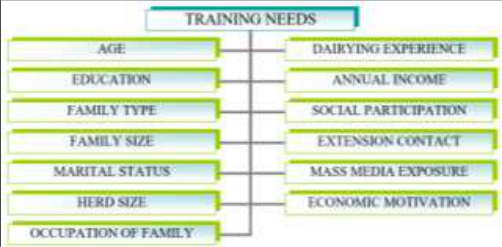 Figure 1
Introduction
Livestock is an important segment of the agricultural sector in India as it makes multifaceted contributions to socioeconomic uplift of the rural poor. Livestock in India is kept mainly by the smallholders and the landless that constitute the bulk of the rural population. Thus by being an important means of income and employment, livestock helps to alleviate poverty and smoothers income distribution in the process assuring a balanced development of the rural economy. Indian agriculture and dairy still assumes the characteristic of traditional farming because of reluctance of farming population particularly the old aged to accept the modern technology. Rural youth are expected to be more progressive than old people. Undeniably, the youth constitute a vast reserviour of energy especially in developing countries including India. Out of the total population of India, those in the age group of 15 to 35 years constitute 40 per cent young people, men and women are available for bringing about the development at local, regional and national level.
Materials and Methods
The present study was conducted in the Marathwada region of Maharashtra state during the year 2021-22 with the objective to study "Training needs of dairy farm women in dairy farming." One districtnamely Hingoli was selected randomly from the Marathwada region. Four talukas from each selected district and three villages from each talukas were selected randomly for the study. From each selected village, ten farmers those having cows, buffaloes, goats and other dairy animals were selected randomly, in this way total 120 respondents were considered for the study. An Expost-facto research design was followed for the study. Data was gathered using a well-structured interview schedule created with the study's objectives in mind. The collected data was analysed, classified and tabulated. Statistical tools such as frequency, percentage, mean, standard deviation, and coefficient correlation were used to interpret findings and draw conclusions. [6] .
Results and Discussion
Results and Discussion
Profile of farm women
Profile of farm women
Education
According to table 1 the majority (33.43%) of farm women were educated up to the middle school level, followed by primary school level (30.84%) and high school level (15.84%), respectively, graduate (05.83%) and illiterate (10.00%). Farm women had middle school level because of lack of suitable schooling facilities. Similar findings are supported by Sharma et al. (2022) [6] .
| Sr. No. | Characteristics | Farm women (n = 120) | — |
|---|---|---|---|
| Frequency | Percentage | ||
| 1 | Age | ||
| Young (Up to 30 years) | 24 | 20.00 | |
| Middle (31 to 47 years) | 76 | 63.34 | |
| Old (48 years & above) | 20 | 16.66 | |
| 2 | Education | ||
| Illiterate (0) | 17 | 10.00 | |
| Primary school level (1st – 4th std) | 37 | 30.84 | |
| Middle school level (5th – 10th std) | 40 | 33. 43 | |
| High school level (11th – 12th std) | 19 | 15.84 | |
| Graduate (13th – 15th std) | 7 | 05.84 | |
| 3 | Family type | ||
| Nuclear | 33 | 27.50 | |
| Joint | 87 | 72.50 | |
| 4 | Family size | ||
| Small (up to 3 members) | 5 | 4.16 | |
| Medium (4 to 9 members) | 92 | 76.67 | |
| Large (above 10 members) | 23 | 19.17 | |
| 5 | Marital status | ||
| Unmarried | 2 | 1.67 | |
| Married | 95 | 79.17 | |
| Divorce | 12 | 10.00 | |
| Widower | 11 | 9.17 | |
| 6 | Herd size | ||
| Low (up to 4) | 23 | 19.17 | |
| Medium (5 to 10) | 81 | 67.50 | |
| High (above 11) | 16 | 13.33 | |
| 7 | Occupation of family | ||
| Livestock | 2 | 01.68 | |
| Agriculture + Livestock | 80 | 66.68 | |
| Agriculture + Livestock + Services | 6 | 05.00 | |
| Agriculture + Livestock + Business | 14 | 11.68 | |
| Agriculture + Livestock + Others | 18 | 15.00 | |
| 8 | Dairying Experience | ||
| Low (up to 3) | 16 | 13.33 | |
| Medium (4 to 12) | 92 | 76.67 | |
| High (13 & above) | 12 | 10.00 | |
| 9 | Annual Income | ||
| Low (up to Rs. 76,488/-) | 10 | 08.34 | |
| Medium (Rs.76,489/- to Rs. 3,05,678/-) | 94 | 78.34 | |
| High (Rs.3,05,679/-) | 16 | 13.34 | |
| 10 | Social Participation | ||
| Low (up to 2 years) | 12 | 10.00 | |
| Medium (3 to 13 years) | 91 | 75.83 | |
| High (14 & above) | 17 | 14.17 | |
| 11 | Extension contact | ||
| Low (up to 8 years) | 19 | 15.83 | |
| Medium (9 to 13 years) | 77 | 64.17 | |
| High (14 years & above) | 24 | 20.00 | |
| 12 | Mass media Exposure | ||
| Low (up to 4) | 27 | 22.50 | |
| Medium (5 to 7) | 65 | 54.17 | |
| High (8 & above) | 28 | 23.34 | |
| 13 | Economic Motivation | ||
| Low (up to 20) | 22 | 18.00 | |
| Medium (21 to 25) | 73 | 61.00 | |
| High (26 & above) | 25 | 21.00 |
Table text extracted from the original PDF; superscript letters are shown inline. The original table image is below.
View original table image
Family Type
Table 1 indicates that the majority of farm women (72.50%) belonged to joint families, while 27.50 per cent farm women belonged to the nuclear family. Because of joint family respondents got more time to look after their dairy enterprise. This finding was more or less in conformity with the findings reported.
Family size
Data depicted in Table 1 concluded that more than half (76.67%) of the farm women belonged to medium size family, followed by 19.17 per cent from large families and only 4.16 per cent of the farm women were from small families. This might be due to the fact that dairy farming has many activities which cannot be managed by women. There should be a cooperative and trustful family who helps to upgrade dairy farming skills and make it a profitable venture. This finding was more or less in conformity with the findings reported by Sharma et al. (2022) [6] .
Marital Status
Data depicted in Table 1 concluded that the majority of the farm women belonged to the married category (79.17%), 10.00 per cent farm women belonged to the divorce category, followed by 9.17 per cent farm women belonged to the widower category while 1.67 per cent farm women belong to unmarried category. This may be because the married women got financial support from their husbands for doing dairy farming. This finding was more or less in conformity with the findings reported by Kaur (2015). www.extensionjournal.com
Herd Size
The above table 1. indicated that, majority of the farm women (67.50%) possessed medium herd size (5 to 10 animals), followed by 19.17 per cent (up to 4 animals) and 13.33 per cent (above 11 animals) of farm women possessed low and high herd size respectively. It may be due to the fact that women were involved in most of the household chores so they can manage medium herd size efficiently. Medium herd size helped them to spend their valuable time with their family members and has long economic impacts. This finding was more or less in conformity with the findings reported by Sharma et al. (2022) [6] .
Occupation of family
Table 1 shows that a great majority (66.68%) of the farm women were engaged in agriculture as well as livestock. 15.00 per cent farm women were engaged in agriculture + livestock + others occupation. Whereas 11.68 percent farm women were engaged in agriculture + livestock + business occupation and 5.00 percent farm women were engaged in agriculture + livestock + service occupation. Only 1.68 percent farm women were engaged in livestock occupation.
It may be due to as all of the farm women are dairy farm women hence they have agriculture + livestock as their main occupation. This finding was more or less in conformity with the findings reported.
Dairying Experience
Table 1 shows that the majority (76.67%) of the farm women had medium dairying experience while 13.33 per cent of the farm women had low dairying experience, whereas 10.00 per cent of them were found in the high dairying experience category. This may be due to all the selected farm women being middle-aged. This finding was more or less in conformity with the findings reported by Sharma (2020) [6] .
Annual Income
It is revealed from Table 1 that, the majority (78.34%) of the farm women were from medium annual income category, whereas 13.34 per cent of them from high annual income category, while 08.34 per cent were from low annual income category. It may be due to majority of farm women had medium herd size hence annual income is medium. This findings were supported by Sharma et al. (2022) [6] .
Extension Contact
The data presented in table 1 concluded that more than half (64.17%) of the farm women had medium level extension contact, followed by 20.00 per cent had high level of extension contact and remaining 15.83 per cent of the farm women had low level of extension contact. It may be due to farm women not having that much freedom to go out of their home and contact to different personnel for getting knowledge. Similar findings were supported by Sharma et al. (2022) [6] .
Mass Media Exposure
The data presented in Table 1 concluded that the majority (54.17%) of the farm women had medium mass media exposure, while 23.34 per cent of the farm women had high mass media exposure and 22.50 per cent of them had low mass media exposure. This may be due to farm women not having time for using different mass media because of their busy schedule Similar findings were supported by Sharma et al. (2022) [6] .
Economic Motivation
Table 1 highlighted that the majority (61.00%) of the farm women were in medium economic motivation category, while 21.00 per cent of the farm women were in high economic motivation category and 18.00 per cent of them were in low economic motivation category. The dairy farm women are not much more aware of getting economic benefit from dairy venture. Hence, they have medium economic motivation. This finding was supported by Sharma et al. (2022) [6] .
Conclusion
The study has conclusively proven that profile of farm women in dairy farming, more than half of the farm women belonged to the middle age group, majority of farm women were educated up to the middle school level, majority of farm women belonged to joint family, majority more than half of the farm women belonged to medium size family, majority of the farm women belonged to married category, majority of the farm women possessed medium herd size (5 to 10 animals), majority of the farm women were engaged in agriculture as well as livestock, majority of the farm women had medium dairying experience, majority of the farm women were from medium annual income category, majority of the farm women had low social participation, majority more than half of the farm women had medium level extension contact, majority of the farm women had medium mass media exposure, majority of the farm women were in medium economic motivation category.
Figures and tables from the paper
References
5 in the original paper- Pozar DM. IEEE Trans. on Antenna and Propagation. 1992;10:84:40.
- Pozar DM, Sanchez V. Electronic Letters. 1988;24:729.
- Dixit L, Pourush PKS. IEE Proc. Microwave and Antennas Propagation. 2000:147(2):151.
- Pourush PKS, Dixit L. Indian Journal of Physics. 1999;73(B):485.
- Gupta A, Pourush PKS. Indian Journal of Physics. 1999;72B(3):537.
Social Participation
Table 1. indicated that the majority of the farm women (75.83%) had medium social participation while 14.17 per cent of them had high social participation and 10.00 per cent of low level of social participation, respectively. This may due to farm women not get much time for social participation because of their household work and dairy work. This finding was supported.