
Research article · 2022 · Full text
International Journal of Statistics and Applied MathematicsAn economic model based on SkSP-2 with double sampling plan as the reference plan
Volume 7(5) · Pages 31–35 · DOI: 10.22271/maths.2022.v7.i5a.879 ↗
Research areasAdvanced Statistical Process MonitoringIndustrial Vision Systems and Defect DetectionManufacturing Process and Optimization
Abstract
Author-writtenSkip-lot sampling plans have been widely used in industries to reduce inspection efforts when products have excellent quality records. This paper provides an economic model based on SkSP-2 with the double sampling plan as a reference plan. The various combinations of producer quality level and consumer quality level by minimizing both the producer’s and the consumer’s risk have been discussed. Numerical examples are provided to confirm the application of the proposed concept.
Summary
Source-checkedPlain-language reading of the full paper, prepared with AI and checked against the text. Each point links to the authors' own words.
Why it matters
- Skip-lot sampling plans are used in industrial settings to lower the amount of inspection required when products consistently show high quality. View evidence ↗
- Acceptance sampling is a key quality control method where a sample from a lot determines whether the entire lot is accepted or rejected. View evidence ↗
- Double sampling plans can be more cost-effective than single sampling plans because they often require fewer items to be inspected for the same level of risk. View evidence ↗
The question
- The study aims to develop an economic model for a type-2 skip-lot sampling plan (SkSP-2) that uses a double sampling plan as its reference. View evidence ↗
What they did
- The researchers designed a mathematical model to minimize total production cost (TC) by first determining the probability of lot acceptance, Pa(p), using the SkSP-2 plan. View evidence ↗
- The model calculates the number of detected (Dd) and undetected (Dn) defective items to determine total production costs based on AQL and LTPD. View evidence ↗
- The model was numerically tested under two specific conditions: where the first and second sample sizes are equal (n1=n2) and where the second is twice the first (n2=2×n1). View evidence ↗
What they found
- The average outgoing quality (AOQ) decreases as the probability of lot acceptance increases; when p values exceed 0.1, AOQ approaches zero, necessitating 100% inspection. View evidence ↗
- The total production cost is positively correlated with the internal failure cost (Cf). View evidence ↗
- AOQ curves indicate that as the p value increases, AOQ decreases gradually until p = 0.04, after which it approaches zero. View evidence ↗
What it means
- The authors conclude that their proposed SkSP-2 model requires fewer sample units than conventional plans, thereby reducing both inspection time and cost. View evidence ↗
Visual summary
1 visualsIllustrations explain the paper; they do not show study data.
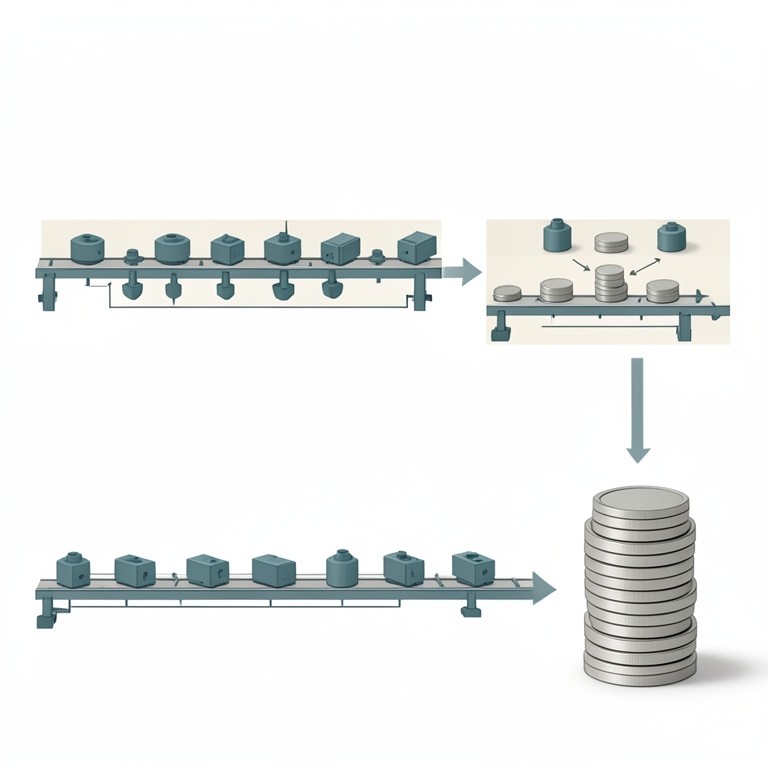
SkSP-2 Economic Model Workflow
AI-generated conceptual illustration (Industrial manufactured components on a conveyor belt). It explains the idea and does not show study data.
View source evidence ↗Figures & tables
From the original paper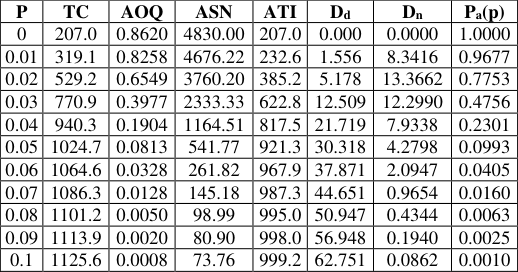 Table 1
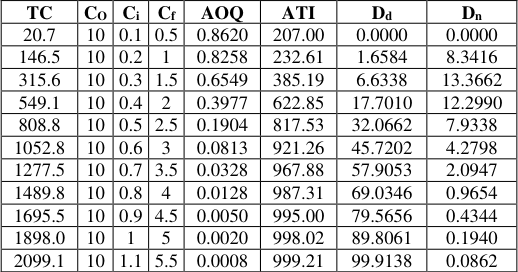 Table 2
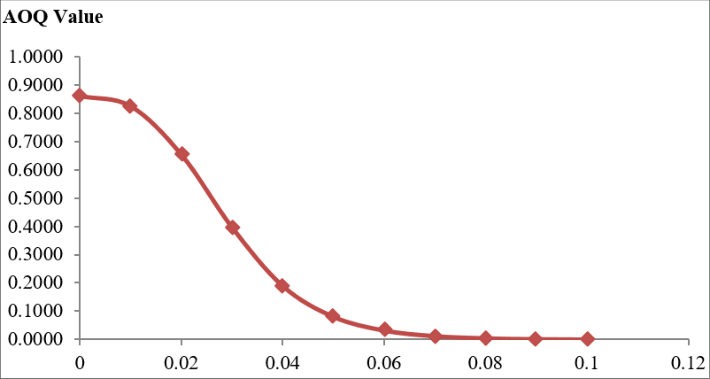 Figure 1
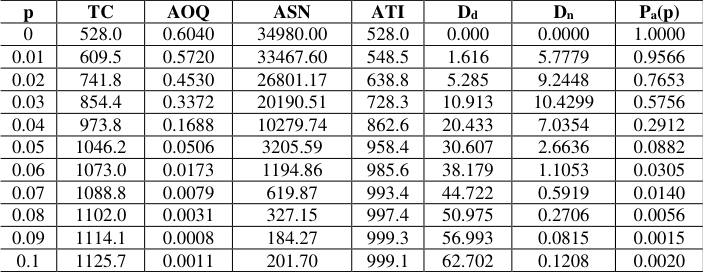 Table 3
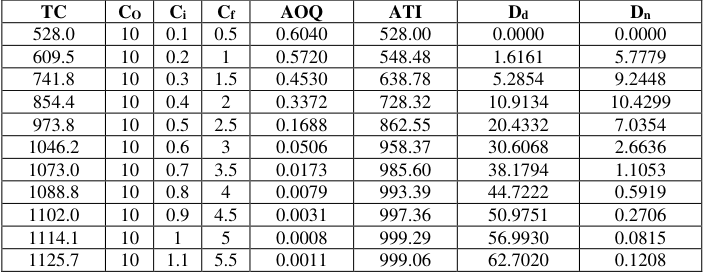 Table 4
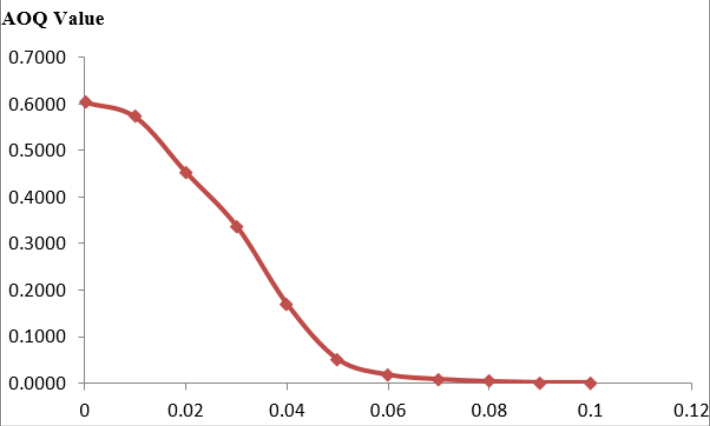 Figure 2
Introduction
The main objective of inspection at the producer's end is to control the quality of the produced items by examining them at strategic points. Inspection ensures that the quality of the lot accepted is in accordance with the specifications of the consumer. Thus, the sampling inspection, if meticulously designed, puts more effective pressure on quality improvement and, therefore, results in the submission of a better-quality product for inspection. In statistical quality control, samples of items are inspected, and the results are used to control their quality. Such a procedure, besides ensuring the quality of the product, keeps down the cost of production. Acceptance sampling plays a vital role in quality control. In acceptance sampling, items are grouped into lots, a sample is taken, and based on the observed quality of the sample, the entire lot is either accepted or rejected. The first point to decide, in acceptance sampling, is to define lots. It is to ensure that all items in the lot are produced under the same condition. As far as possible, items manufactured under different conditions should not be mixed into one lot. Attempts should be made to maintain the identity of different lots. It is further essential that a sample be drawn from each lot based on which the decision to accept or reject the lot is to be taken. Mohammad Saber Fallah Nezhad, Ahmad Ahmadi Yazdi, Parvin Abdollahi, and Muhammad Aslam (2015) [1] developed a mathematical model to design single stage and double stage sampling plan that can determine the optimal tolerance limits and the sample size. They found that the two-stage sampling plan showed better robustness than the single stage plan. Lie-Fern Hsu, and Jia-Tzer Hsu (2012) [2] designed an economic model to devise a sampling plan to minimize the total quality cost both for the producer and customer. The plan was found to be dependent on inspection, internal failure, and post-sale failure. S. Balamurali and J. Subramani (2012) [3] proposed an optimized design to establish the parameters that affect the skip-lot sampling plan of type SkSP-2 plan with double sampling plan as the reference plan. The plan has been illustrated numerically using various combinations of acceptable and limiting quality levels. The proposed plan was found to be advantageous over conventional sampling plans. Ferrell, W.G., and Chhoker A (2002) [4] developed the design of economically optimal acceptance sampling plans using a unique approach by employing a continuous loss function to quantify the deviations. They also discussed inspection error. The proposed models were found to be easy and user friendly. S. Balamurali and J. Subramani (2010) [5] designed a skiplot sampling plan, SkSP-3 to reduce the inspection cost using Markov chain formulation. Dodge and Romig (1998) [6] provided double sampling plans with a minimum average total inspection The construction and evaluation of matched sets of single, double, and multiple sampling plans were developed by Shilling and Johnson (1978) [7] Dodge and Romig (1998) [6] provided double sampling plans with a minimum average total inspection. R. Vijayaraghavan & V. Soundararajan (1998) [8] developed the concepts of design and evaluation of skip-lot sampling inspection plans with a double-sampling plan as the reference plan. Their work aimed at reducing the sample size without compromising the efficiency. Robert L. Perry (1973) [9] presented a system of skip-lot sampling plans for lot inspection designated as type SkSP-2. This system allows for skipping lots when the quality of the submitted product is good.
Operating procedure for double sampling plan and skiplot sampling plan-2
In the single sampling plan, the decision to accept or reject a lot is taken based on one sample drawn from the lot. It could happen that the quality of the sample may not be truly representative of the quality of the lot, and the entire lot may be rejected even though the quality might be as per specification, or the entire lot is accepted even though the quality of the lot is not as per specifications. While such a risk cannot be eliminated, it can be reduced by resorting to taking a second sample from the lot whenever the first sample does not provide ample evidence of the exceptionally good or inferior quality of the lot. A double sampling inspection plan can be described as follows. A sample of n1 items is drawn from a given lot. The lot is accepted, if the number of defective items in the sample is less than or equal to c 1 . If the sample contains more than c 2 defective items (c 2 > c 1 ), the lot is immediately rejected. If the number of defective items is greater than c 1 but is less than or equal to c 2 , a second sample of size n 2 is drawn. If the total number of defectives in the combined sample size is less than the combined sample size, the lot is accepted. However, if it is greater than c 2 , the lot is rejected. Thus, the double sampling plan is described by four numbers n 1, n 2, c 1 and c2 . Thus, if the incoming quality is exceptionally good, the lot is accepted based on the first sample itself and rejected if the quality is bad. However, if the quality is of an average type, a second sample may be required. Psychologically, a double sampling plan has the advantage that it gives a good chance to lots of doubtful quality. Another advantage of double sampling plan over a single sampling plan is that, for a given amount of risk, it needs lesser items to be inspected, thus reducing costs involved.
The double sampling plan can be summarized as follows:
1. Take a first sample of size 1 n
Take a second sample of size .
2 n Let the number of defectives be .
Recently, Balamurali and J. Subramani (2012) [3] determined the parameters of a skip-lot sampling plan of type SkSP-2 plan with double sampling plan as the reference plan. The skip-lot sampling plan is extremely useful, and it has economic advantages in the design of sampling plans.
The operating procedure for skip-lot sampling plan-2 with double sampling plan as a reference plan is stated as follows: a) To begin with, inspect every lot using a double sampling plan as the reference plan. At the time of inspection, lots are inspected one by one in the order of production b) When i consecutive lots on the double sampling plan are accepted, discontinue normal inspection and switch to skipping inspection. c) During skipping inspection, inspect only a fraction f of the lots using the double sampling plan as the reference plan. Skipping inspection is continued until a sampled lot is rejected. d) If a lot is rejected, resume normal inspection immediately as per step (i).
Notations and assumptions
Notations and assumptions
Economic model for SkSP-2 with double sampling plan as a reference plan
Although there are a handful of works that highlight the advantages of skip-lot sampling plans, the present work proposes a robust skip-lot sampling plan-2 with double sampling plan as a reference plan. The model can be applied readily in quality control routines to reduce the total cost. The challenges in designing a sampling plan are two-fold, viz., the number of lots to be assessed and the efficiency of the sampling technique in terms of outcome. Moreover, sampling needs to consider the risk of both the producer and the consumer, and a proven plan must as far as possible, reduce this key factor. The proposed model first requires the determination of Pa (p) value using SkSP-2. Followed by this, a mathematical model has been designed such that it finally reduces the total production cost (TC). This was implemented by calculating D d and D n values, and then arriving at the total cost for production using Acceptable Quality Level (AQL) and Lot Tolerance Percent Defective (LTPD). In accordance with Perry (1973) [9] , the operating characteristic function of SkSP-2 plan is given by,
1 ) ( --------------------(1) ---------------------------(3)
The mathematical model for an economic sampling plan is:
Finally, tables can be constructed using the above model, which can be used a ready reckoner in quality control processes.
Numerical Illustrations
Two conditions, viz., n 1 =n 2 and n 2 =2×n 1 , were considered to exemplify the model numerically. Tables 1 and3 show the total production cost and sensitivity analysis of the Skip-Lot Sampling plan-2 with different level of p values when n 1 =n 2 and n 2 =2×n 1 , respectively. If the values presented in the table are observed closely, it is evident that the probability of accepting the lot has a direct effect on AOQ. As the probability of accepting the lots increases, the average outgoing quality values are found to decrease. If p values are greater than 0.1, the AOQ value approaches zero, resulting in 100% inspection of the entire lot.
Conclusion
In this paper, we have designed an economic model based on SkSP-2 with double sampling plan as a reference plan. Based on this model, it is found that the proposed plan needs a small number of sample units for the inspection than the conventional plans. So, this method is helpful in reducing the cost and time of inspection at the time of production. The application of the model has been illustrated numerically. Also, AOQ curves were constructed to check the efficiency of the proposed plan.
Figures and tables from the paper
| P | TC | AOQ | ASN | ATI | Dd | Dn | Pa(p) |
|---|---|---|---|---|---|---|---|
| 0 | 207.0 | 0.8620 | 4830.00 | 207.0 | 0.000 | 0.0000 | 1.0000 |
| 0.01 | 319.1 | 0.8258 | 4676.22 | 232.6 | 1.556 | 8.3416 | 0.9677 |
| 0.02 | 529.2 | 0.6549 | 3760.20 | 385.2 | 5.178 | 13.3662 | 0.7753 |
| 0.03 | 770.9 | 0.3977 | 2333.33 | 622.8 | 12.509 | 12.2990 | 0.4756 |
| 0.04 | 940.3 | 0.1904 | 1164.51 | 817.5 | 21.719 | 7.9338 | 0.2301 |
| 0.05 | 1024.7 | 0.0813 | 541.77 | 921.3 | 30.318 | 4.2798 | 0.0993 |
| 0.06 | 1064.6 | 0.0328 | 261.82 | 967.9 | 37.871 | 2.0947 | 0.0405 |
| 0.07 | 1086.3 | 0.0128 | 145.18 | 987.3 | 44.651 | 0.9654 | 0.0160 |
| 0.08 | 1101.2 | 0.0050 | 98.99 | 995.0 | 50.947 | 0.4344 | 0.0063 |
| 0.09 | 1113.9 | 0.0020 | 80.90 | 998.0 | 56.948 | 0.1940 | 0.0025 |
| 0.1 | 1125.6 | 0.0008 | 73.76 | 999.2 | 62.751 | 0.0862 | 0.0010 |
Table text extracted from the original PDF; superscript letters are shown inline. The original table image is below.
View original table image
| TC | CO | Ci | Cf | AOQ | ATI | Dd | Dn |
|---|---|---|---|---|---|---|---|
| 20.7 | 10 | 0.1 | 0.5 | 0.8620 | 207.00 | 0.0000 | 0.0000 |
| 146.5 | 10 | 0.2 | 1 | 0.8258 | 232.61 | 1.6584 | 8.3416 |
| 315.6 | 10 | 0.3 | 1.5 | 0.6549 | 385.19 | 6.6338 | 13.3662 |
| 549.1 | 10 | 0.4 | 2 | 0.3977 | 622.85 | 17.7010 | 12.2990 |
| 808.8 | 10 | 0.5 | 2.5 | 0.1904 | 817.53 | 32.0662 | 7.9338 |
| 1052.8 | 10 | 0.6 | 3 | 0.0813 | 921.26 | 45.7202 | 4.2798 |
| 1277.5 | 10 | 0.7 | 3.5 | 0.0328 | 967.88 | 57.9053 | 2.0947 |
| 1489.8 | 10 | 0.8 | 4 | 0.0128 | 987.31 | 69.0346 | 0.9654 |
| 1695.5 | 10 | 0.9 | 4.5 | 0.0050 | 995.00 | 79.5656 | 0.4344 |
| 1898.0 | 10 | 1 | 5 | 0.0020 | 998.02 | 89.8061 | 0.1940 |
| 2099.1 | 10 | 1.1 | 5.5 | 0.0008 | 999.21 | 99.9138 | 0.0862 |
Table text extracted from the original PDF; superscript letters are shown inline. The original table image is below.
View original table image
| p | TC | AOQ | ASN | ATI | Dd | Dn | Pa(p) |
|---|---|---|---|---|---|---|---|
| 0 | 528.0 | 0.6040 | 34980.00 | 528.0 | 0.000 | 0.0000 | 1.0000 |
| 0.01 | 609.5 | 0.5720 | 33467.60 | 548.5 | 1.616 | 5.7779 | 0.9566 |
| 0.02 | 741.8 | 0.4530 | 26801.17 | 638.8 | 5.285 | 9.2448 | 0.7653 |
| 0.03 | 854.4 | 0.3372 | 20190.51 | 728.3 | 10.913 | 10.4299 | 0.5756 |
| 0.04 | 973.8 | 0.1688 | 10279.74 | 862.6 | 20.433 | 7.0354 | 0.2912 |
| 0.05 | 1046.2 | 0.0506 | 3205.59 | 958.4 | 30.607 | 2.6636 | 0.0882 |
| 0.06 | 1073.0 | 0.0173 | 1194.86 | 985.6 | 38.179 | 1.1053 | 0.0305 |
| 0.07 | 1088.8 | 0.0079 | 619.87 | 993.4 | 44.722 | 0.5919 | 0.0140 |
| 0.08 | 1102.0 | 0.0031 | 327.15 | 997.4 | 50.975 | 0.2706 | 0.0056 |
| 0.09 | 1114.1 | 0.0008 | 184.27 | 999.3 | 56.993 | 0.0815 | 0.0015 |
| 0.1 | 1125.7 | 0.0011 | 201.70 | 999.1 | 62.702 | 0.1208 | 0.0020 |
Table text extracted from the original PDF; superscript letters are shown inline. The original table image is below.
View original table image
| TC | CO | Ci | Cf | AOQ | ATI | Dd | Dn |
|---|---|---|---|---|---|---|---|
| 528.0 | 10 | 0.1 | 0.5 | 0.6040 | 528.00 | 0.0000 | 0.0000 |
| 609.5 | 10 | 0.2 | 1 | 0.5720 | 548.48 | 1.6161 | 5.7779 |
| 741.8 | 10 | 0.3 | 1.5 | 0.4530 | 638.78 | 5.2854 | 9.2448 |
| 854.4 | 10 | 0.4 | 2 | 0.3372 | 728.32 | 10.9134 | 10.4299 |
| 973.8 | 10 | 0.5 | 2.5 | 0.1688 | 862.55 | 20.4332 | 7.0354 |
| 1046.2 | 10 | 0.6 | 3 | 0.0506 | 958.37 | 30.6068 | 2.6636 |
| 1073.0 | 10 | 0.7 | 3.5 | 0.0173 | 985.60 | 38.1794 | 1.1053 |
| 1088.8 | 10 | 0.8 | 4 | 0.0079 | 993.39 | 44.7222 | 0.5919 |
| 1102.0 | 10 | 0.9 | 4.5 | 0.0031 | 997.36 | 50.9751 | 0.2706 |
| 1114.1 | 10 | 1 | 5 | 0.0008 | 999.29 | 56.9930 | 0.0815 |
| 1125.7 | 10 | 1.1 | 5.5 | 0.0011 | 999.06 | 62.7020 | 0.1208 |
Table text extracted from the original PDF; superscript letters are shown inline. The original table image is below.
View original table image
References
6 in the original paper- Mohammad Saber FallahNezhad, Ahmad Ahmadi Yazdi, Parvin Abdollahi, Muhammad Aslam. Design of Economic Optimal Double Sampling Design with Zero Acceptance Numbers. 2015 July-Dec;1(2):45-56.
- Ferrell WG, Chhoker A. Design of economically optimal acceptance sampling plans with inspection error. Computers and Operations Research. 2002;29(10):12831300.
- Balamurali S, Subramani J. Economic Design of sksp-3 Skip-Lot Sampling Plans. International Journal of Applied Mathematics and Statistics, Autumn. 2010;6(10):23-39.
- Shilling EG, Johnson NC. Tables for the construction of matched Single, Double and Multiple Sampling Plan with Application to MILSTD-105D under the switching rules Journal of Quality Technology. 1978;10(3):104-124.
- Vijayaraghavan R, Soundararajan V. Design and evaluation of skip-lot sampling inspection plans with double-sampling plan as the reference plan. Journal of Applied Statistics. 1998;25(3):341-348.
- Robert L. Perry Skip-Lot Sampling Plans. Journal of Quality Technology. 1973;5(3):123-130.